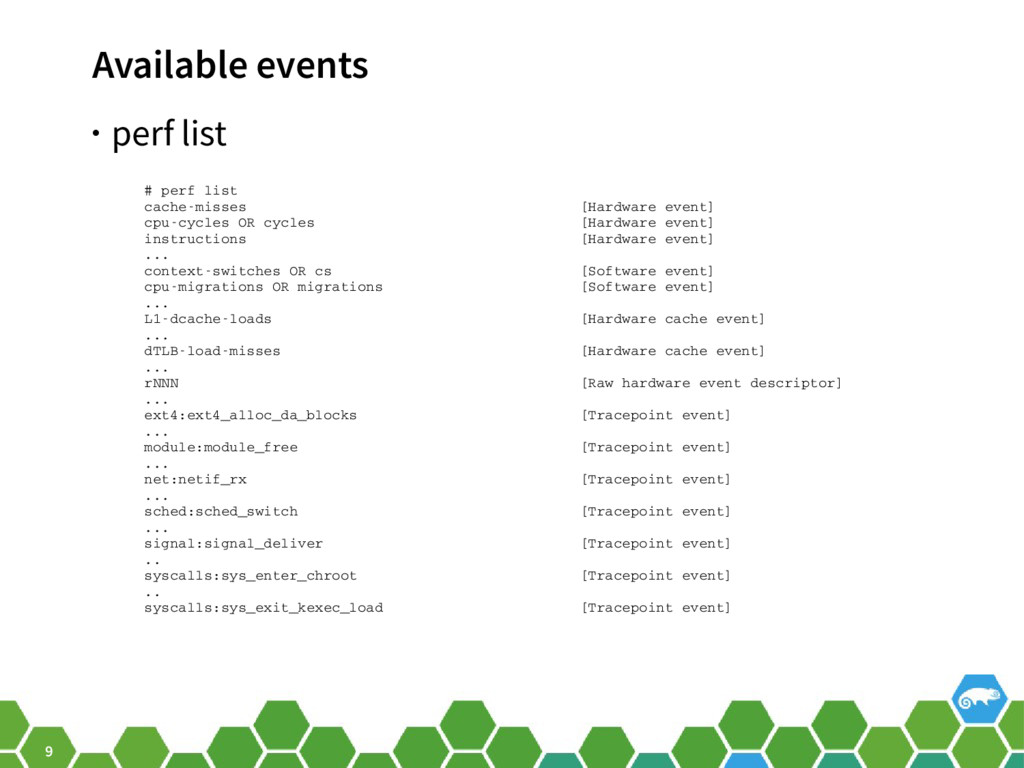
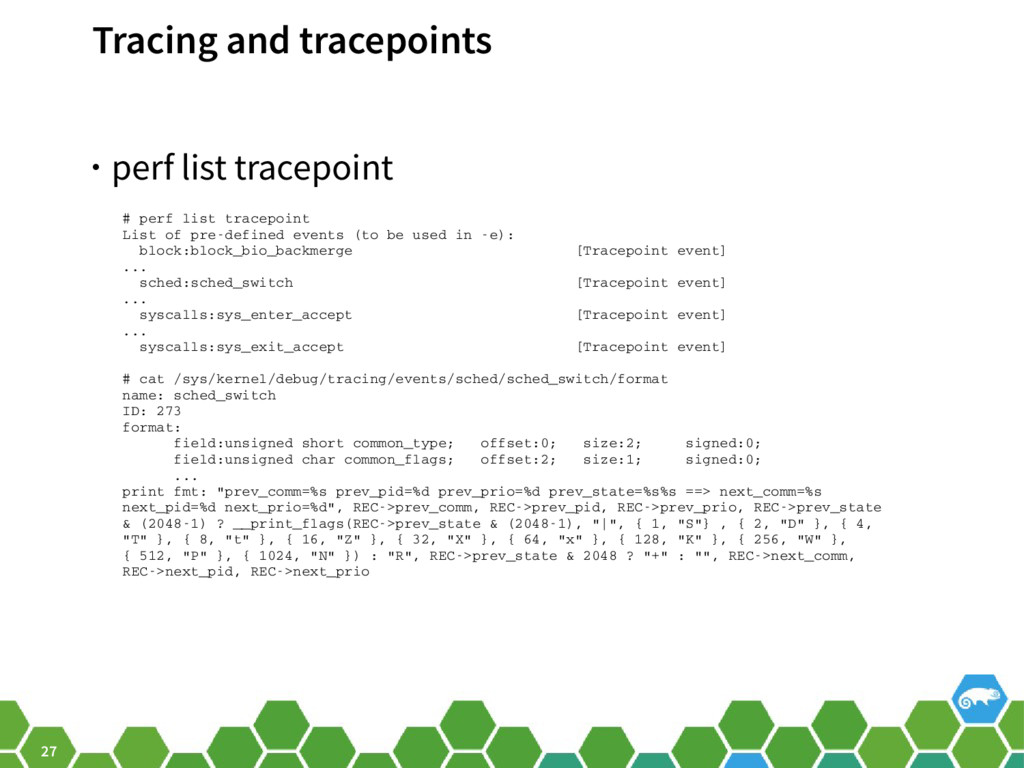
Upgrade to Pro — share decks privately, control downloads, hide ads and more …

Introduction to performance analysis in openSUS...

Introduction to performance analysis in openSUSE using perf

Avatar for Tony Jones

Tony Jones

June 25, 2016
Tweet

Other Decks in Programming

Transcript

  1. Introduction to performance analysis in openSUSE® Using Perf Tony Jones

    – Senior Software Engineer SUSE Labs Portland, Oregon USA [email protected]
  2. 2 Give yourself a break • Performance analysis is not

    easy • It’s rarely black and white, more shades of grey. • Lots of subjectivity
  3. 3 Methodologies and practice are useful • Methodologies are useful,

    there are lots of them. • → be methodical • If you have to dig in, know what options exist. • Write code to test hypothesis/understand tools.
  4. 4 There are lots of tools, perf is one •

    And it’s not the first one you want to use. ‒ dmesg/syslog ‒ top ‒ iostat/vmstat ‒ Iotop ‒ pidstat ‒ strace
  5. 5 Performance Counters • Hardware resource to aid performance analysis.

    • Available on x86 since Pentium 3. • Availability via CPUID and MSR • Basic PMU functionality “standardized” with arch_perfmon_v1 thru v4 • Beyond this, additional PMUs micro-architecture specific
  6. 6 Perfmon • Perfmon 2.0 designed by HP for ia64.

    • Still in kernel tree for ia64. • Extended for other architectures as Perfmon 2.X. • Submission to LKML in 2008 led to counter submission of Performance Counters For Linux • libpfm v4 still relevant today
  7. 7 Perf • Introduced in 2009 in as Performance Counters

    for Linux, kernel version 2.6.31 • Now known as ‘perf events’ • A swiss-army knife but still mostly focused on cpu usage and integration with tracing.
  8. 8 Where to begin • Install perf :) • perf

    cmd ‒ top ‒ list ‒ record ‒ report ‒ annotate ‒ trace
  9. 9 Available events • perf list # perf list cache­misses

    [Hardware event] cpu­cycles OR cycles [Hardware event] instructions [Hardware event] ... context­switches OR cs [Software event] cpu­migrations OR migrations [Software event] ... L1­dcache­loads [Hardware cache event] ... dTLB­load­misses [Hardware cache event] ... rNNN [Raw hardware event descriptor] ... ext4:ext4_alloc_da_blocks [Tracepoint event] ... module:module_free [Tracepoint event] ... net:netif_rx [Tracepoint event] ... sched:sched_switch [Tracepoint event] ... signal:signal_deliver [Tracepoint event] .. syscalls:sys_enter_chroot [Tracepoint event] .. syscalls:sys_exit_kexec_load [Tracepoint event]
  10. 10 Event monikers intel# grep "model name" /proc/cpuinfo | uniq

    model name : Intel(R) Xeon(R) CPU E5­2420 v2 @ 2.20GHz intel# ls /sys/devices/cpu/events/ branch­instructions cache­misses instructions ref­cycles branch­misses cache­references mem­loads stalled­cycles­frontend bus­cycles cpu­cycles mem­stores intel# cat /sys/devices/cpu/events/cpu­cycles event=0x3c # /usr/bin/showevtinfo > /tmp/events IDX : 37748736 PMU name : ix86arch (Intel X86 architectural PMU) Name : UNHALTED_CORE_CYCLES Equiv : None Flags : None Desc : count core clock cycles whenever the clock signal on the specific core is running (not halted) Code : 0x3c Modif­00 : 0x00 : PMU : [k] : monitor at priv level 0 (boolean) Modif­01 : 0x01 : PMU : [u] : monitor at priv level 1, 2, 3 (boolean) Modif­02 : 0x02 : PMU : [e] : edge level (may require counter­mask >= 1) (boolean) Modif­03 : 0x03 : PMU : [i] : invert (boolean) Modif­04 : 0x04 : PMU : [c] : counter­mask in range [0­255] (integer) Modif­05 : 0x05 : PMU : [t] : measure any thread (boolean)
  11. 11 Event monikers (cont) amd# grep "model name" /proc/cpuinfo |

    uniq model name : AMD Opteron(tm) Processor 6128 amd# ls /sys/devices/cpu/events/ branch­instructions cache­misses cpu­cycles branch­misses cache­references instructions amd# cat /sys/devices/cpu/events/cpu­cycles event=0x76 # /usr/bin/showevtinfo > /tmp/events [amd] IDX : 134217766 PMU name : amd64_fam10h_istanbul (AMD64 Fam10h Istanbul) Name : CPU_CLK_UNHALTED Equiv : None Flags : None Desc : CPU Clocks not Halted Code : 0x76 Modif­00 : 0x00 : PMU : [k] : monitor at priv level 0 (boolean) Modif­01 : 0x01 : PMU : [u] : monitor at priv level 1, 2, 3 (boolean) Modif­02 : 0x02 : PMU : [e] : edge level (boolean) Modif­03 : 0x03 : PMU : [i] : invert (boolean) Modif­04 : 0x04 : PMU : [c] : counter­mask in range [0­255] (integer) Modif­05 : 0x05 : PMU : [h] : monitor in hypervisor (boolean) Modif­06 : 0x06 : PMU : [g] : measure in guest (boolean)
  12. 12 Sampling vs counting • Counters operate in two distinct

    ways ‒ Counted. ‒ Sampled. • Sampling rate can be specified via either ‒ Frequency (-F) ‒ Count (-c)
  13. 13 Perf top • Perf top. Sampling view similar to

    standard UNIX utility • Provides view into where cpu is spending time. Not everything is user cpu bound (0.1% user, 4.1% sys) Samples: 32K of event 'cycles:ppp', Event count (approx.): 8956122825 Overhead Shared Object Symbol 44.93% [kernel] [k] _raw_spin_lock 36.76% [kernel] [k] sync_inodes_sb 1.78% [kernel] [k] _raw_spin_unlock 0.78% [kernel] [k] __filemap_fdatawait_range 0.58% [kernel] [k] find_get_pages_tag 0.56% [kernel] [k] _atomic_dec_and_lock 0.50% [kernel] [k] __iget 0.45% [kernel] [k] nmi 0.41% [kernel] [k] iput 0.36% [kernel] [k] unmap_page_range 0.32% [kernel] [k] __wake_up_bit 0.25% [kernel] [k] filemap_map_pages 0.23% [kernel] [k] clear_page_c_e 0.22% [kernel] [k] copy_page ... ...
  14. 14 Perf top (cont) • Sometimes it is (top reports

    100% user, 0% sys) Samples: 867K of event 'cycles:ppp', Event count (approx.): 340340242278 Overhead Shared Object Symbol 51.02% libcrypto.so.1.0.0 [.] DES_set_key_unchecked 26.95% libcrypto.so.1.0.0 [.] DES_encrypt1 1.07% libcrypto.so.1.0.0 [.] DES_set_odd_parity 0.53% libcrypto.so.1.0.0 [.] EVP_DigestInit_ex 0.44% libc­2.23.so [.] _int_free 0.39% libcrypto.so.1.0.0 [.] EVP_Digest 0.38% libc­2.23.so [.] _int_malloc 0.30% libcrypto.so.1.0.0 [.] EVP_MD_CTX_cleanup 0.29% libc­2.23.so [.] malloc ...
  15. 15 Perf top (cont) • Possible to annotate hot code

    • Enable callgraphs (-g) to show paths to hot code • Two types of callgraphs for userspace. Frame pointer and dwarf # zcat /proc/config.gz | egrep ­e "CONFIG_FRAME_POINTER|UNWIND" CONFIG_UNWIND_INFO=y CONFIG_STACK_UNWIND=y # CONFIG_FRAME_POINTER is not set
  16. 16 Perf record • Samples counters for later analysis. •

    Lots of command line options: ‒ perf record command ‒ perf record -a command ‒ perf record -a • Default scope is kernel+usermode ‒ perf record -e cpu-cycles:u command ‒ perf record -a -e cpu-cycles:k
  17. 17 Perf record # perf record ­c 1000 ­e instructions:u

    ./linpack 200 # perf report ­D | grep ­c PERF_RECORD_SAMPLE 3048011 # perf report ­n ­­stdio # Total Lost Samples: 0 # # Samples: 3M of event 'instructions:u' # Event count (approx.): 3048011000 # # Overhead Samples Command Shared Object Symbol # ........ ............ ....... ................. .................................. 48.04% 1464144 linpack linpack [.] daxpy_r 40.31% 1228752 linpack linpack [.] daxpy_ur 7.72% 235359 linpack linpack [.] matgen 2.05% 62548 linpack linpack [.] dgefa 0.83% 25291 linpack linpack [.] idamax 0.52% 15798 linpack linpack [.] dscal_r 0.41% 12496 linpack linpack [.] dscal_ur 0.11% 3337 linpack linpack [.] dgesl 0.00% 56 linpack libc­2.23.so [.] _dl_addr
  18. 18 Perf record # perf annotate ­­print­line ­­stdio daxpy_r ...

    : /* code for both increments equal to 1 */ : : for (i = 0;i < n; i++) 0.21 : 40200e: movl $0x0,­0x4(%rbp) 0.00 : 402015: jmp 40206e <daxpy_r+0x163> : dy[i] = dy[i] + da*dx[i]; linpack.c:599 10.24 : 402017: mov ­0x4(%rbp),%eax 0.28 : 40201a: cltq 0.01 : 40201c: lea 0x0(,%rax,8),%rdx 0.30 : 402024: mov ­0x30(%rbp),%rax 10.31 : 402028: add %rdx,%rax 0.01 : 40202b: mov ­0x4(%rbp),%edx 0.04 : 40202e: movslq %edx,%rdx 0.33 : 402031: lea 0x0(,%rdx,8),%rcx 10.37 : 402039: mov ­0x30(%rbp),%rdx 0.00 : 40203d: add %rcx,%rdx 0.01 : 402040: movsd (%rdx),%xmm1 linpack.c:599 3.04 : 402044: mov ­0x4(%rbp),%edx linpack.c:599 9.35 : 402047: movslq %edx,%rdx 0.00 : 40204a: lea 0x0(,%rdx,8),%rcx 0.00 : 402052: mov ­0x28(%rbp),%rdx linpack.c:599 1.28 : 402056: add %rcx,%rdx linpack.c:599 9.58 : 402059: movsd (%rdx),%xmm0 linpack.c:599 0.88 : 40205d: mulsd ­0x20(%rbp),%xmm0 linpack.c:599 10.86 : 402062: addsd %xmm1,%xmm0 17.50 : 402066: movsd %xmm0,(%rax)
  19. 19 Perf record # perf record ­c 1000 ­e instructions

    ./linpack 200 # perf report ­n ­­stdio | head ­30 # Total Lost Samples: 0 # # Samples: 1M of event 'instructions' # Event count (approx.): 1868359000 # # Overhead Samples Command Shared Object Symbol 47.46% 886656 linpack linpack [.] daxpy_r 40.03% 747911 linpack linpack [.] daxpy_ur 8.32% 155453 linpack linpack [.] matgen 1.60% 29808 linpack linpack [.] dgefa 0.79% 14756 linpack linpack [.] idamax 0.49% 9101 linpack linpack [.] dscal_r 0.39% 7298 linpack linpack [.] dscal_ur 0.26% 4825 linpack [kernel.kallsyms] [k] _raw_spin_lock_irq 0.22% 4181 linpack [kernel.kallsyms] [k] __local_bh_enable 0.10% 1833 linpack [kernel.kallsyms] [k] run_timer_softirq 0.08% 1537 linpack linpack [.] dgesl 0.03% 610 linpack [kernel.kallsyms] [k] __softirqentry_text_start 0.03% 599 linpack [kernel.kallsyms] [k] idle_cpu 0.01% 275 linpack [kernel.kallsyms] [k] load_balance 0.01% 253 linpack [kernel.kallsyms] [k] _raw_spin_unlock_irq 0.01% 226 linpack [kernel.kallsyms] [k] update_sd_lb_stats 0.01% 159 linpack [kernel.kallsyms] [k] _raw_spin_unlock_irqrestore 0.01% 159 linpack [kernel.kallsyms] [k] select_task_rq_fair 0.01% 157 linpack [kernel.kallsyms] [k] enqueue_entity
  20. 20 What events should I monitor • Instructions per cycle

    # perf stat ­e instructions:u ­e cycles:u ./linpack 200 Performance counter stats for './linpack 200': 77,693,957,078 instructions:u # 2.73 insn per cycle 28,421,726,540 cycles:u 25.760008514 seconds time elapsed
  21. 21 What events should I monitor • Cache misses relative

    to references #define MULT 8 // 1 == 8 * 1024 * 1024, ~8MB of 15MB L3 cache int main() { int *p, i; const int num = MULT * 1024 * 1024, loops=50; if (!(p=malloc(num * sizeof(int)))) return 1; srand((unsigned)time(NULL)); for (i;i<num*loops;i++) p[rand() % num] += rand(); free(p); return 0; } # perf stat ­e cache­misses:u ­e cache­references:u ./badcache Performance counter stats for './badcache': 227,020,317 cache­misses:u # 54.474 % of all cache refs 416,750,100 cache­references:u 23.962244212 seconds time elapsed
  22. 22 What events should I monitor • Cache misses relative

    to references IDX : 216006703 PMU name : ivb_ep (Intel Ivy Bridge EP) Name : MEM_LOAD_UOPS_RETIRED Flags : [precise] Desc : Memory loads uops retired Code : 0xd1 Umask­00 : 0x40 : PMU : [HIT_LFB] : [precise] : A load missed L1D but hit the Fill Buffer Umask­01 : 0x01 : PMU : [L1_HIT] : [precise] : Load hit in nearest­level (L1D) cache Umask­02 : 0x02 : PMU : [L2_HIT] : [precise] : Load hit in mid­level (L2) cache Umask­03 : 0x10 : PMU : [L2_MISS] : [precise] : Load misses in mid­level (L2) cache Umask­04 : 0x04 : PMU : [L3_HIT] : [precise] : Load hit in last­level (L3) cache with no snoop needed Umask­05 : 0x20 : PMU : [L3_MISS] : [precise] : Load miss in last­level (L3) cache # for i in L2_HIT L2_MISS L3_HIT L3_MISS; do echo ­n "`/usr/bin/evt2raw MEM_LOAD_UOPS_RETIRED:$i` "; done r5302d1 r5310d1 r5304d1 r5320d1 # perf stat ­e r5302d1:u ­e r5310d1:u ­e r5304d1:u ­e r5320d1:u ./badcache Performance counter stats for './badcache': 2,875,282 r5302d1:u (50.00%) 412,616,740 r5310d1:u (50.01%) 187,720,675 r5304d1:u (50.00%) 224,533,511 r5320d1:u (49.99%) 36.058470947 seconds time elapsed
  23. 23 What events should I monitor • Branch misses relative

    to branch instructions enum{size = 8}; int t[size] = {0,0,0,0,0,0,0,0}; void func(int _v) { #define DO(x) if (_v == x) t[x]++ #define EDO(x) else DO(x) DO(0); EDO(1); EDO(2); EDO(3); EDO(4); EDO(5); EDO(6); EDO(7); } int main() { int i; volatile int v; const int num = 20 * 1024 * 1024; srand((unsigned)time(NULL)); for (i=0;i<num;i++){ v=rand() % size; func(v); } //for (i=0;i<size;i++) // printf("t[%d]=%d\n", i, t[i]); }
  24. 24 What events should I monitor • Counted # perf

    stat ­e branches:u ­e branch­misses:u branch_8x Performance counter stats for 'branch_8x': 490,265,094 branches:u 19,435,491 branch­misses:u # 3.96% of all branches 1.361357178 seconds time elapsed
  25. 25 What events should I monitor • Sampled # perf

    record ­e branches:u ­e branch­misses:u branch_8x # perf report ­n ­­stdio ­­dsos branch_8x # dso: branch_8x # # Samples: 2K of event 'branches:u' # Event count (approx.): 490409129 # Overhead Samples Command Symbol 42.50% 1196 branch_8x [.] func 21.67% 609 branch_8x [.] main # Samples: 2K of event 'branch­misses:u' # Event count (approx.): 19453325 # Overhead Samples Command Symbol 73.30% 2058 branch_8x [.] func 23.79% 669 branch_8x [.] main
  26. 26 Sampling skew/skid • When a performance counter overflows, IP

    passed. • On heavily pipelined architectures reported IP may not be correct • PEBS, precise event based sampling • Specified via the precision qualifier (0 to 3) ‒ event:p [1, skid shall be constant] ‒ event:pp [2, request 0 skid] ‒ event:ppp [3, require 0 skid]
  27. 27 Tracing and tracepoints • perf list tracepoint # perf

    list tracepoint List of pre­defined events (to be used in ­e): block:block_bio_backmerge [Tracepoint event] ... sched:sched_switch [Tracepoint event] ... syscalls:sys_enter_accept [Tracepoint event] ... syscalls:sys_exit_accept [Tracepoint event] # cat /sys/kernel/debug/tracing/events/sched/sched_switch/format name: sched_switch ID: 273 format: field:unsigned short common_type; offset:0; size:2; signed:0; field:unsigned char common_flags; offset:2; size:1; signed:0; ... print fmt: "prev_comm=%s prev_pid=%d prev_prio=%d prev_state=%s%s ==> next_comm=%s next_pid=%d next_prio=%d", REC­>prev_comm, REC­>prev_pid, REC­>prev_prio, REC­>prev_state & (2048­1) ? __print_flags(REC­>prev_state & (2048­1), "|", { 1, "S"} , { 2, "D" }, { 4, "T" }, { 8, "t" }, { 16, "Z" }, { 32, "X" }, { 64, "x" }, { 128, "K" }, { 256, "W" }, { 512, "P" }, { 1024, "N" }) : "R", REC­>prev_state & 2048 ? "+" : "", REC­>next_comm, REC­>next_pid, REC­>next_prio
  28. 28 Tracing and tracepoints • perf stat -a -e ‘syscalls:sys_enter_*’

    sleep 30 • perf stat -e ‘sched:sched_switch’ ./benchmark • perf record -a -g -e ‘syscalls:sys_enter_write’ --filter ‘count > 1024’ # tail ­1 /sys/kernel/debug/tracing/events/syscalls/sys_enter_write/format print fmt: "fd: 0x%08lx, buf: 0x%08lx, count: 0x%08lx", ((unsigned long)(REC­>fd)), ((unsigned long)(REC­>buf)), ((unsigned long)(REC­>count))
  29. 29 Perf trace • Track costly syscalls # perf trace

    ­­duration 1.0 dd if=/dev/zero of=/tmp/out bs=1k count=10 10+0 records in 10+0 records out 10240 btes (10 kB, 10 KiB) copied, 0.000448134 s, 22.9 MB/s # perf trace ­­duration 1.0 dd if=/dev/zero of=/tmp/out bs=1k count=10 conv=fdatasync 8.652 ( 6.035 ms): dd/9820 fdatasync(fd: 1</tmp/out> ) = 0 10+0 records in 10+0 records out 10240 bytes (10 kB, 10 KiB) copied, 0.00663256 s, 1.5 MB/s # perf trace ­­duration 1.0 dd if=/dev/zero of=/tmp/out bs=1k count=10 oflag=sync 7.795 ( 6.127 ms): dd/9847 write(fd: 1</tmp/out>, buf: 0x559fbf625000, count: 1024 ) = 1024 9.278 ( 1.463 ms): dd/9847 write(fd: 1</tmp/out>, buf: 0x559fbf625000, count: 1024 ) = 1024 10.746 ( 1.448 ms): dd/9847 write(fd: 1</tmp/out>, buf: 0x559fbf625000, count: 1024 ) = 1024 12.195 ( 1.418 ms): dd/9847 write(fd: 1</tmp/out>, buf: 0x559fbf625000, count: 1024 ) = 1024 13.704 ( 1.486 ms): dd/9847 write(fd: 1</tmp/out>, buf: 0x559fbf625000, count: 1024 ) = 1024 15.312 ( 1.564 ms): dd/9847 write(fd: 1</tmp/out>, buf: 0x559fbf625000, count: 1024 ) = 1024 16.754 ( 1.419 ms): dd/9847 write(fd: 1</tmp/out>, buf: 0x559fbf625000, count: 1024 ) = 1024 18.214 ( 1.437 ms): dd/9847 write(fd: 1</tmp/out>, buf: 0x559fbf625000, count: 1024 ) = 1024 19.741 ( 1.503 ms): dd/9847 write(fd: 1</tmp/out>, buf: 0x559fbf625000, count: 1024 ) = 1024 21.200 ( 1.431 ms): dd/9847 write(fd: 1</tmp/out>, buf: 0x559fbf625000, count: 1024 ) = 1024
  30. 30 Perf trace • Summary of syscalls # perf trace

    ­s dd if=/dev/zero of=/tmp/out bs=1k count=10 10+0 records in 10+0 records out 10240 bytes (10 kB, 10 KiB) copied, 0.000364407 s, 28.1 MB/s Summary of events: dd (9990), 305 events, 97.8%, 0.000 msec syscall calls total min avg max stddev (msec) (msec) (msec) (msec) (%) ­­­­­­­­­­­­­­­ ­­­­­­­­ ­­­­­­­­­ ­­­­­­­­­ ­­­­­­­­­ ­­­­­­­­­ ­­­­­­ read 13 0.032 0.002 0.002 0.004 9.14% write 13 0.102 0.004 0.008 0.021 17.20% open 50 0.257 0.003 0.005 0.057 21.01% close 22 0.037 0.001 0.002 0.002 2.77% fstat 17 0.037 0.002 0.002 0.005 9.72% lseek 1 0.002 0.002 0.002 0.002 0.00% mmap 21 0.118 0.003 0.006 0.009 5.66% mprotect 4 0.030 0.004 0.008 0.012 23.08% munmap 1 0.010 0.010 0.010 0.010 0.00% brk 3 0.009 0.002 0.003 0.004 23.94% rt_sigaction 3 0.005 0.001 0.002 0.002 14.85% access 1 0.006 0.006 0.006 0.006 0.00% Dup2 2 0.005 0.002 0.002 0.003 8.43% arch_prctl 1 0.002 0.002 0.002 0.002 0.00%
  31. 31 Perf probe • Dynamically created tracepoints • Count or

    sample # perf probe _copy_from_user Added new event: probe:_copy_from_user (on _copy_from_user) You can now use it in all perf tools, such as: perf record ­e probe:_copy_from_user ­aR sleep 1 # perf stat ­a ­e probe:_copy_from_user sleep 1 Performance counter stats for 'system wide': 1,209 probe:_copy_from_user 1.001884191 seconds time elapsed
  32. 32 Scripting • perf script • perf script -l •

    perf script -g [python|perl] • perf script record <script> [perf record options] • perf script report <script> [script options]
  33. 34 Flame Graphs http://www.brendangregg.com/FlameGraphs/cpuflamegraphs.html • perf record -a -g -e

    cycles:k scp /tmp/file.10gb host: • perf script | stackcollapse-perf.pl | flamegraph.pl > data.svg • firefox data.svg
  34. 36 PAPI / self-monitoring • Performance Application Programming Interface •

    http://icl.cs.utk.edu/papi/ ‒ Has it’s own event monikers termed “event presets”s but can work with perf raw event codes. • Alternative: see implemention of tools/perf/tests/rdpmc.c ‒ http://web.eece.maine.edu/~vweaver/projects/perf_events/ overhead/2015_ispass_overhead.pdf ‒ Mainline commits fe4a3308 and 08aa0d1f
  35. 37 Off-cpu analysis • Monitoring time spent not running. •

    Many reasons ‒ disc io ‒ synchronization (locks, mutexes, signals) ‒ virtual memory ‒ context switching • http://www.brendangregg.com/offcpuanalysis.html
  36. 38 Virtualization • Monitoring guest requires virtualization of pmu hardware.

    • Xen DomU reports software/tracepoint only • QEMU: use ‘-cpu *,pmu=on’ or ‘-cpu host’ (kvm) • Use perf kvm to monitor guest