Upgrade to Pro
— share decks privately, control downloads, hide ads and more …
Speaker Deck
Features
Speaker Deck
PRO
Sign in
Sign up for free
Search
Search
SRE Lounge#3 UZABASE
Search
Sponsored
·
SiteGround - Reliable hosting with speed, security, and support you can count on.
→
tanan
May 18, 2018
Technology
4.1k
2
Share
Embed
Copy iframe code
Copy JS code
Copy link
Start on current slide
SRE Lounge#3 UZABASE
SPEEDAでのProduction Kubernetes運用についてSREの取り組みを話しました。
tanan
May 18, 2018
More Decks by tanan
See All by tanan
SRE Lounge#2 UZABASE
toshianan
0
2.8k
Other Decks in Technology
See All in Technology
ACE-Step-1.5で見る 音楽生成AIのしくみと“破綻だけ直す”Retake機能の開発【zennfes spring 2026 登壇資料】
personabb
1
460
GitHub Copilot 最新アップデート – 「一歩先」の実践活用術
moulongzhang
2
350
手塩にかけりゃいいってもんじゃない
ming_ayami
0
580
AIはどのように 組織のアジリティを変えるのか?
junki
3
790
SONiC Scale-Up Working Group から探る Scale-UpやUltraEthernet機能の実装方法
ebiken
PRO
2
330
LayerX コーポレートエンジニアリング室におけるサプライチェーンセキュリティへの取り組み / Supply Chain Security at LayerX Corporate Engineering
yuyatakeyama
2
310
2026 TECHFRESH 畢業分享會 - AI-Native 重塑軟體工程與虛擬講師
line_developers_tw
PRO
0
1k
AI駆動開発を通して感じた、 AI時代のデザイナーの役割変化
whisaiyo
3
2.1k
【セミナー資料】Claude Code をセキュアに使うための考え方と設定の勘どころ / Claude Code Webinar 20260616
masahirokawahara
2
330
Claude Codeをどのように キャッチアップしているか
oikon48
12
8k
RSA暗号を手計算したくなること、ありますよね?? (20260615_orestudy6_rsa)
thousanda
0
420
FinOps × AIエージェントで実現する コストインシデントの自動調査
oasis1994liveforever
0
140
Featured
See All Featured
Collaborative Software Design: How to facilitate domain modelling decisions
baasie
1
250
Building Better People: How to give real-time feedback that sticks.
wjessup
370
20k
Optimizing for Happiness
mojombo
378
71k
4 Signs Your Business is Dying
shpigford
187
22k
Designing for Performance
lara
611
70k
Self-Hosted WebAssembly Runtime for Runtime-Neutral Checkpoint/Restore in Edge–Cloud Continuum
chikuwait
0
590
HTML-Aware ERB: The Path to Reactive Rendering @ RubyCon 2026, Rimini, Italy
marcoroth
1
190
Thoughts on Productivity
jonyablonski
76
5.2k
How to train your dragon (web standard)
notwaldorf
97
6.7k
[Rails World 2023 - Day 1 Closing Keynote] - The Magic of Rails
eileencodes
38
2.9k
Balancing Empowerment & Direction
lara
6
1.2k
Helping Users Find Their Own Way: Creating Modern Search Experiences
danielanewman
31
3.2k
Transcript
UZABASE SRE
• 阿南 肇史 • 2016年7月 UZABASE 入社 – 前職はSIerでアドテク系Infra Enginner
• UZABASE SRE Team 所属 – Infra Team => SRE Team (2017/07〜現在) 自己紹介
Mission 経済情報で、世界をかえる Business Intelligence to Change Your World 私たちは、世界中で愛される経済情報インフラをつくります。 あらゆる経済情報を人とテクノロジーの力で整理・分析・創出し、
ビジネスパーソンの生産性を高め、創造性を解放します。 私たちは経済情報を通じて世界中の意思決定を支え、世界をかえます。
Our Services B2Bマーケティングエンジン ソーシャル経済ニュース 企業・業界情報プラットフォーム 日本最大級のベンチャーデータベース 2009年 2008年 創業 2014年
2016年 2017年
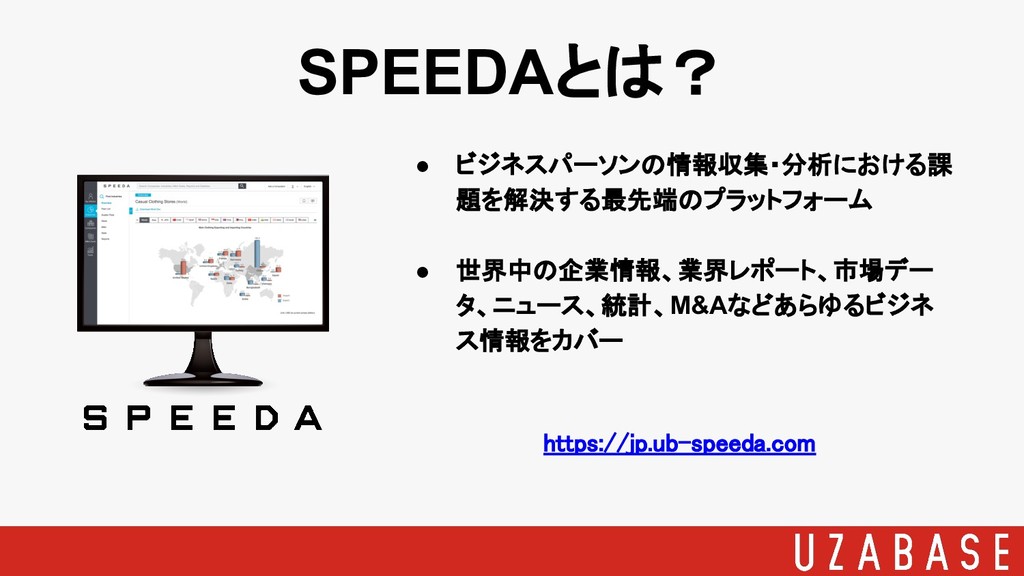
• ビジネスパーソンの情報収集・分析における課 題を解決する最先端のプラットフォーム • 世界中の企業情報、業界レポート、市場デー タ、ニュース、統計、M&Aなどあらゆるビジネ ス情報をカバー https://jp.ub-speeda.com SPEEDAとは?
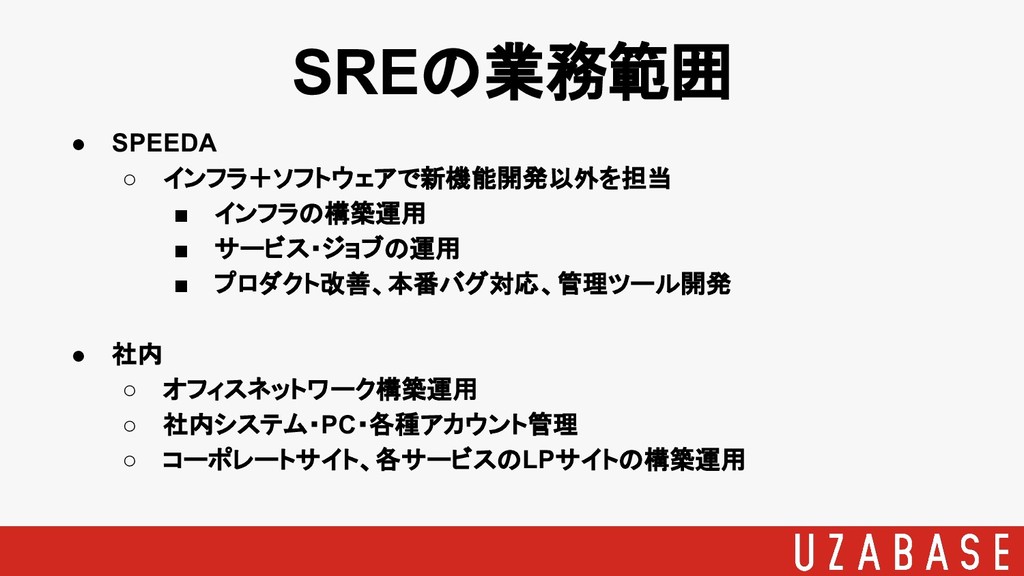
• SPEEDA ◦ インフラ+ソフトウェアで新機能開発以外を担当 ▪ インフラの構築運用 ▪ サービス・ジョブの運用 ▪ プロダクト改善、本番バグ対応、管理ツール開発
• 社内 ◦ オフィスネットワーク構築運用 ◦ 社内システム・PC・各種アカウント管理 ◦ コーポレートサイト、各サービスのLPサイトの構築運用 SREの業務範囲
Kubernetes運用における 開発チームとSREの関わり方 本日のテーマ
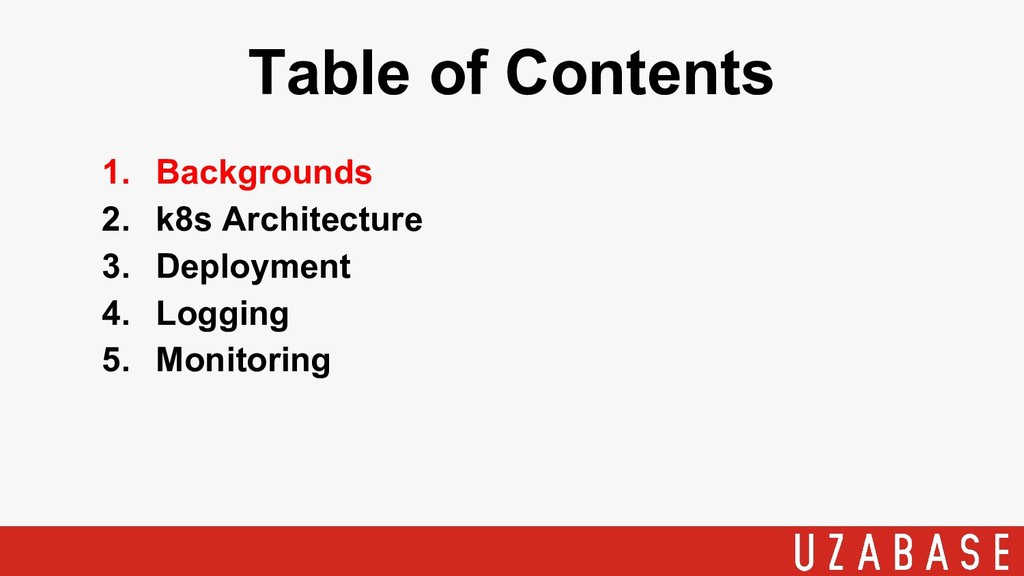
1. Backgrounds 2. k8s Architecture 3. Deployment 4. Logging 5.
Monitoring Table of Contents
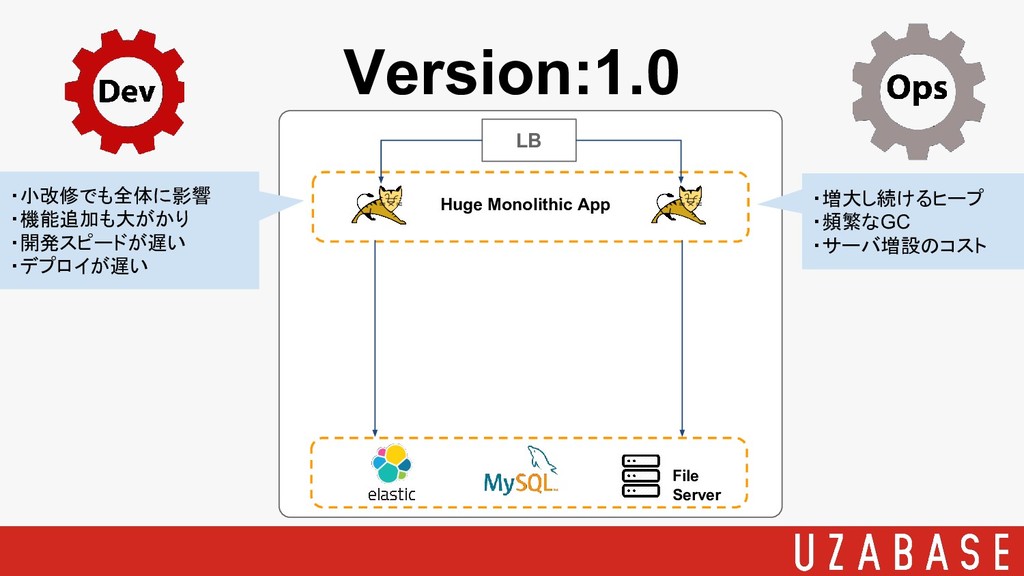
Version:1.0 LB Huge Monolithic App File Server
Version:1.0 LB Huge Monolithic App File Server ・小改修でも全体に影響 ・機能追加も大がかり ・開発スピードが遅い
・デプロイが遅い ・増大し続けるヒープ ・頻繁なGC ・サーバ増設のコスト
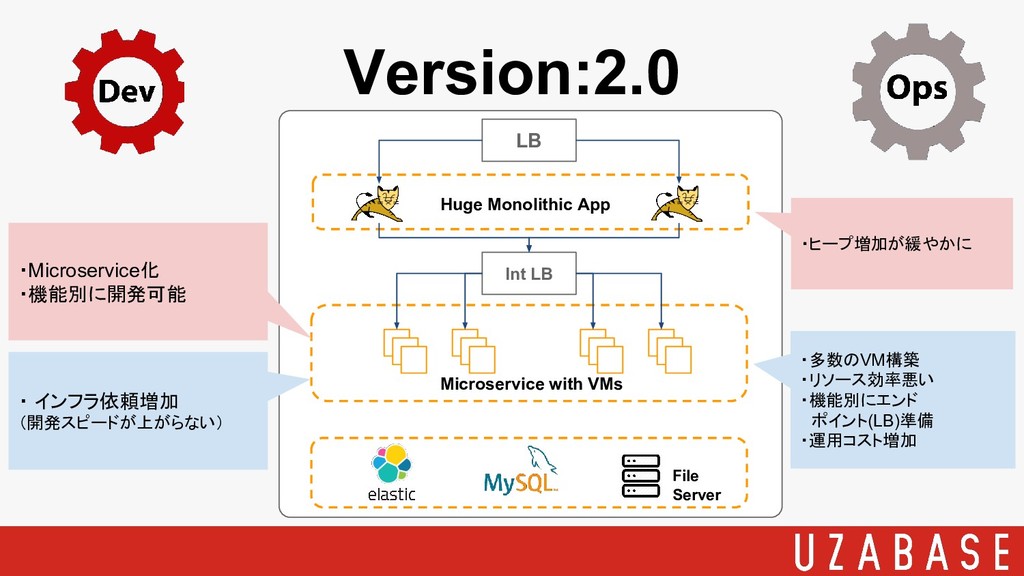
Version:2.0 LB Huge Monolithic App File Server Int LB Microservice
with VMs
Version:2.0 LB Huge Monolithic App File Server Int LB Microservice
with VMs ・Microservice化 ・機能別に開発可能 ・ インフラ依頼増加 (開発スピードが上がらない) ・多数のVM構築 ・リソース効率悪い ・機能別にエンド ポイント(LB)準備 ・運用コスト増加 ・ヒープ増加が緩やかに
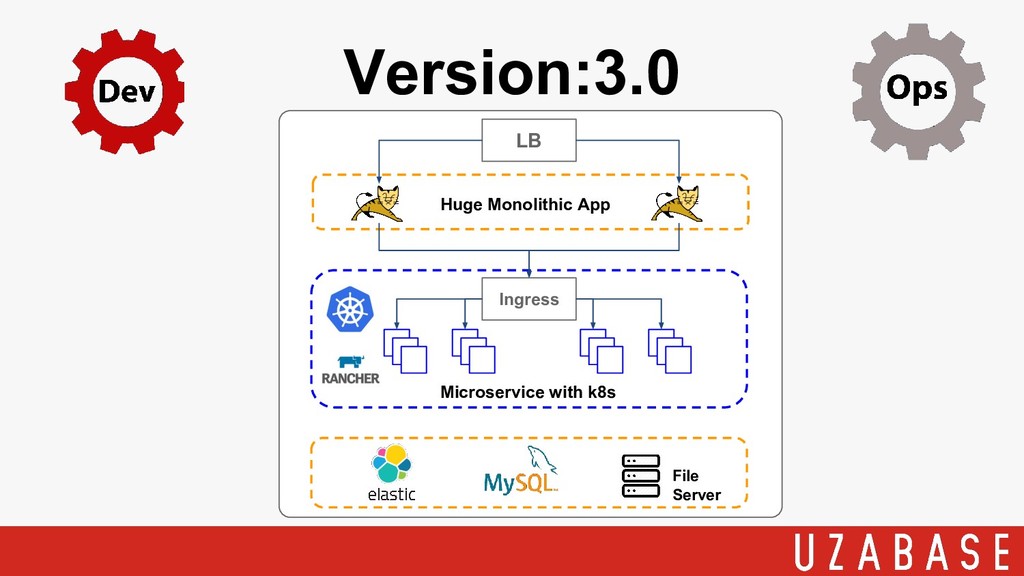
Version:3.0 LB Huge Monolithic App File Server Microservice with k8s
Ingress
Product Development Team Site Reliability Engineering Team CI / CDまで開発チームで完結できる世界を作る
• アプリケーション開発 • テスト • コンテナイメージ作成 • デプロイ • 監視用エンドポイント作成 • Logging • Cluster全体の設定 • Nodeメンテナンス • Logging • Monitoring • Security • Kubernetes外のDataStore構築
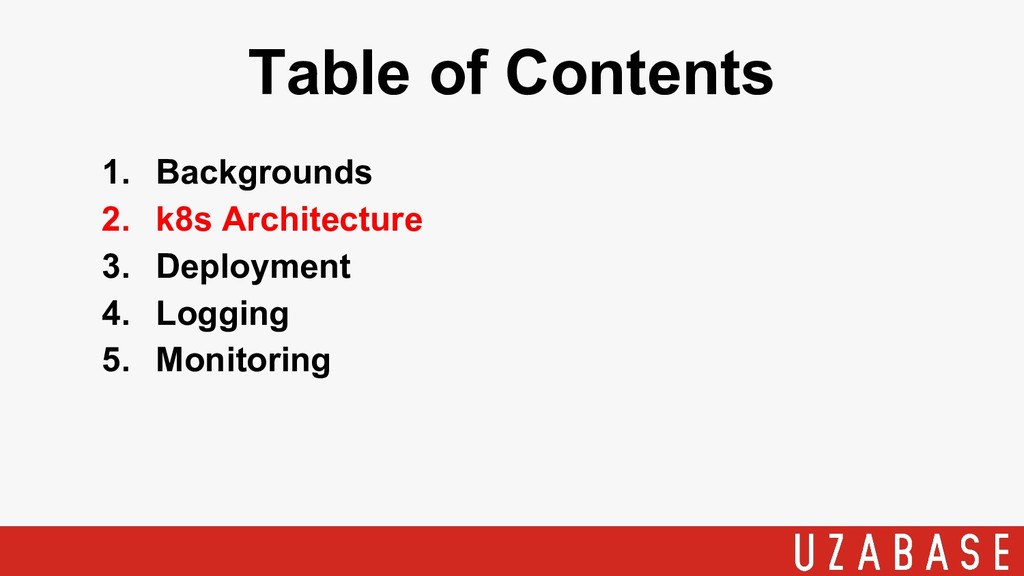
1. Backgrounds 2. k8s Architecture 3. Deployment 4. Logging 5.
Monitoring Table of Contents
Rancher Server Rancher Agent ・Rancher Dashboard ・Cluster追加 / 削除 ・ノード追加
/ 削除 ・Audit Logging ・Security Kubernetes Cluster rancher/agent rancher/agent rancher/agent rancher/agent Rancher Ingress service A : 8080 service B : 8080 Namespace A Namespace B external LB k8s Architecture
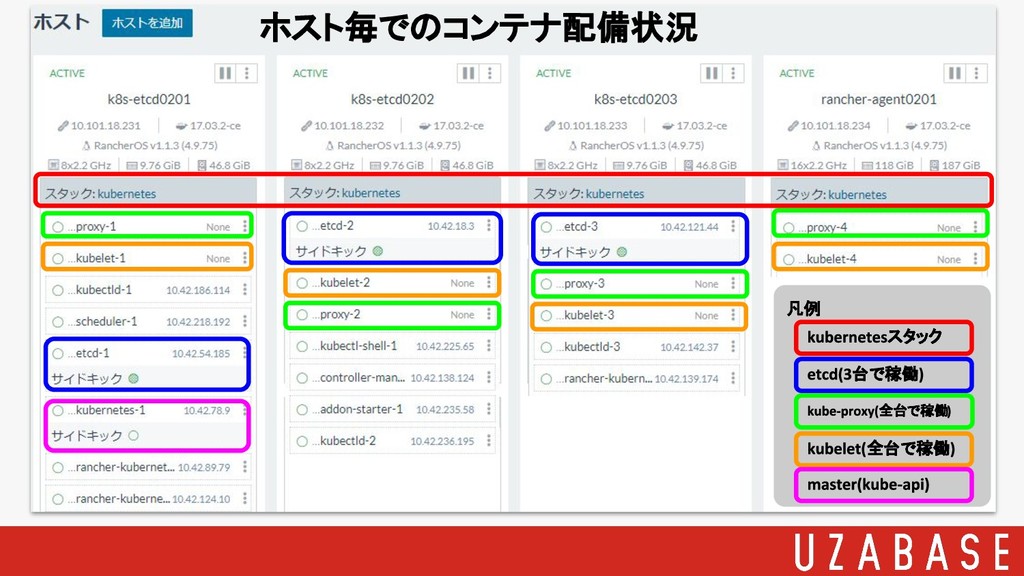
凡例 ホスト毎でのコンテナ配備状況 台で稼働 全台で稼働 全台で稼働 スタック
1. Backgrounds 2. k8s Architecture 3. Deployment 4. Logging 5.
Monitoring Table of Contents
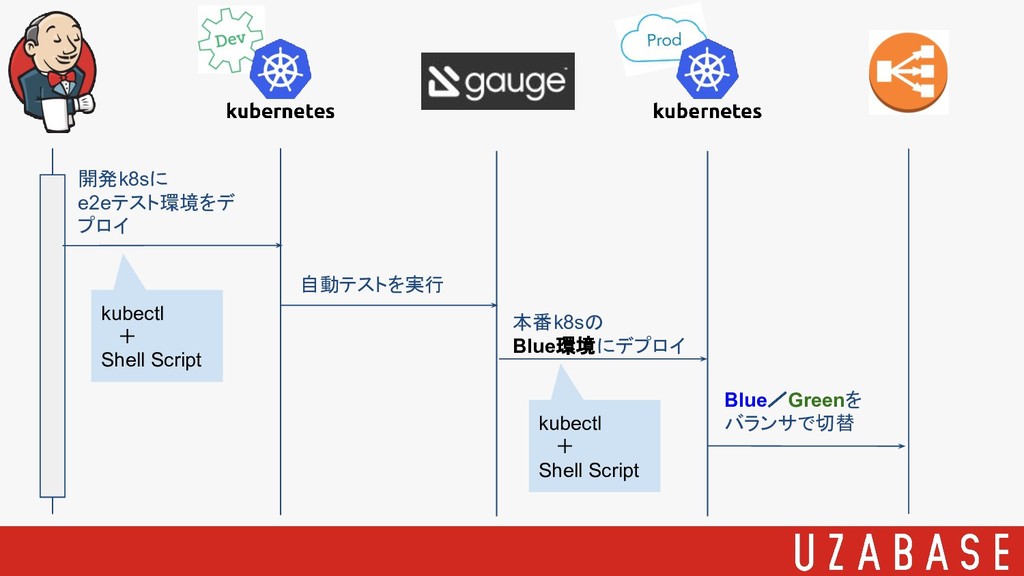
Blue/Greenを バランサで切替 開発k8sに e2eテスト環境をデ プロイ 自動テストを実行 本番k8sの Blue環境にデプロイ kubectl +
Shell Script kubectl + Shell Script
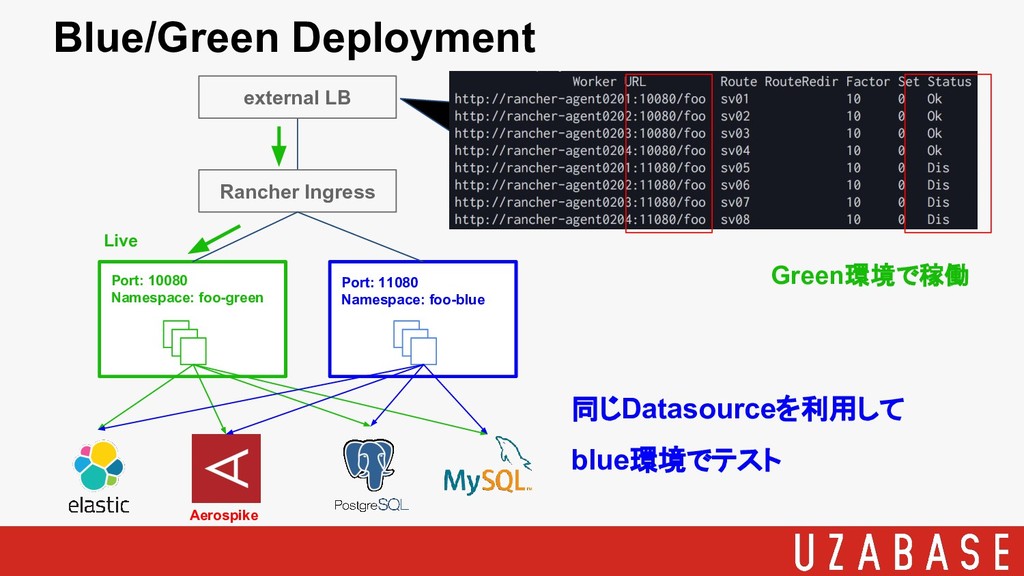
Rancher Ingress external LB Port: 10080 Namespace: foo-green Port: 11080
Namespace: foo-blue Aerospike Live 同じDatasourceを利用して blue環境でテスト Green環境で稼働 Blue/Green Deployment
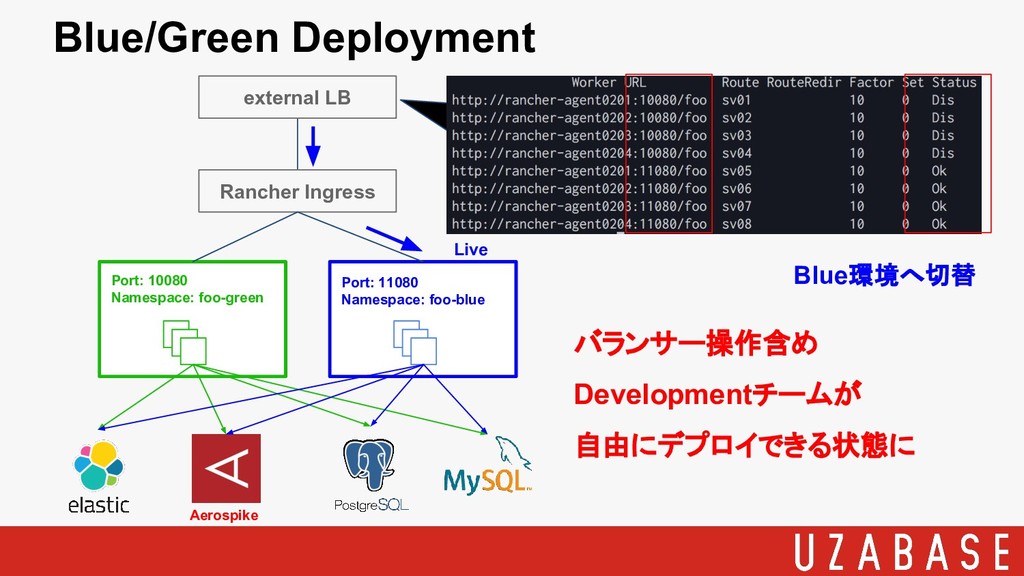
Rancher Ingress external LB Port: 10080 Namespace: foo-green Port: 11080
Namespace: foo-blue Aerospike Live Blue環境へ切替 バランサー操作含め Developmentチームが 自由にデプロイできる状態に Blue/Green Deployment
1. Backgrounds 2. k8s Architecture 3. Deployment 4. Logging 5.
Monitoring Table of Contents
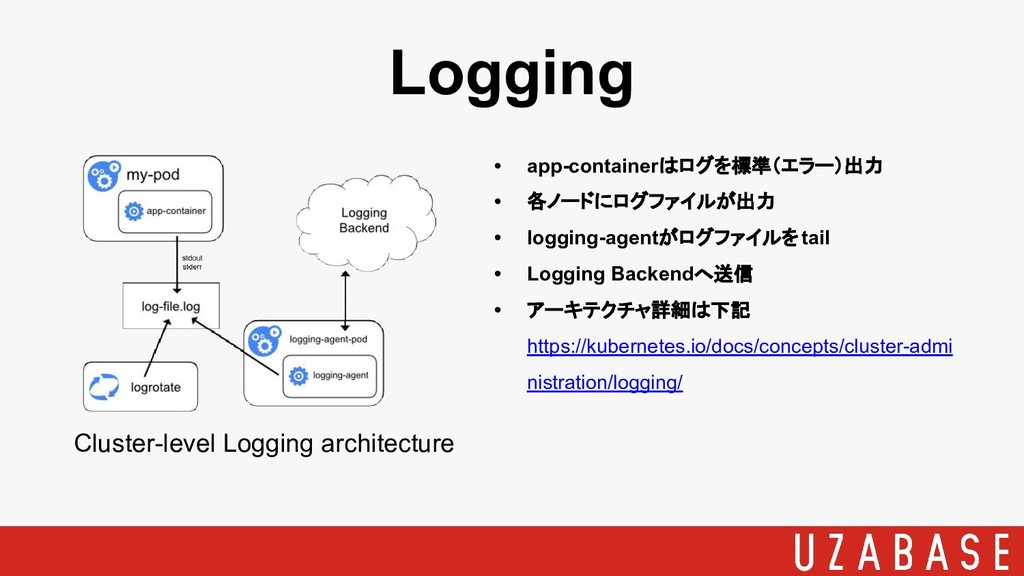
• app-containerはログを標準(エラー)出力 • 各ノードにログファイルが出力 • logging-agentがログファイルをtail • Logging Backendへ送信 •
アーキテクチャ詳細は下記 https://kubernetes.io/docs/concepts/cluster-admi nistration/logging/ Logging Cluster-level Logging architecture
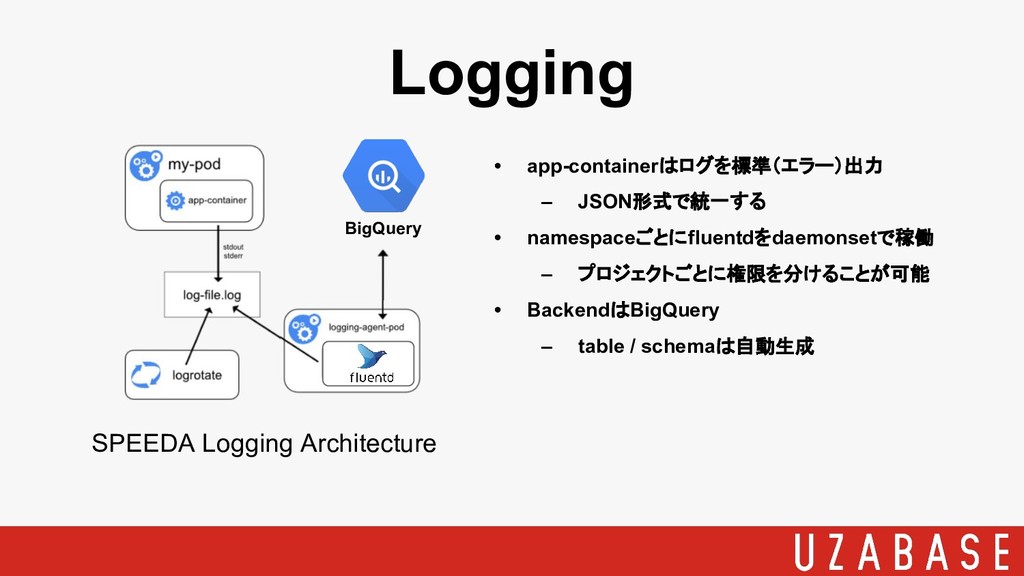
Logging SPEEDA Logging Architecture BigQuery • app-containerはログを標準(エラー)出力 – JSON形式で統一する •
namespaceごとにfluentdをdaemonsetで稼働 – プロジェクトごとに権限を分けることが可能 • BackendはBigQuery – table / schemaは自動生成
Logging 【Containerで標準出力(JSON形式)】 【Node上のファイル(ネストした JSON形式)】 各Nodeの /var/log/containers/[pod_name]-[namespace]-[container_name]-[container_id].log に出力
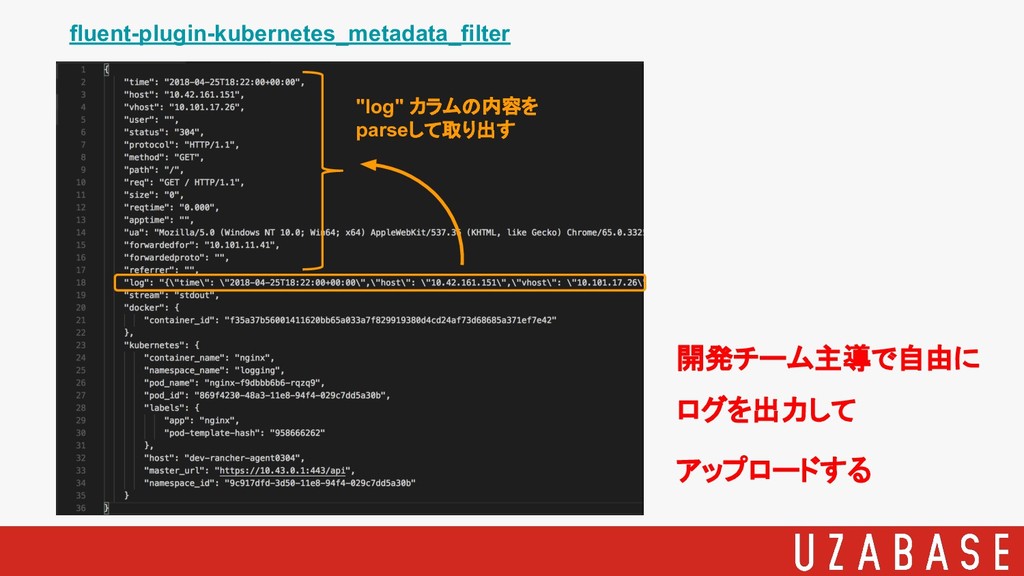
fluent-plugin-kubernetes_metadata_filter "log" カラムの内容を parseして取り出す 開発チーム主導で自由に ログを出力して アップロードする
1. Backgrounds 2. k8s Architecture 3. Deployment 4. Logging 5.
Monitoring Table of Contents
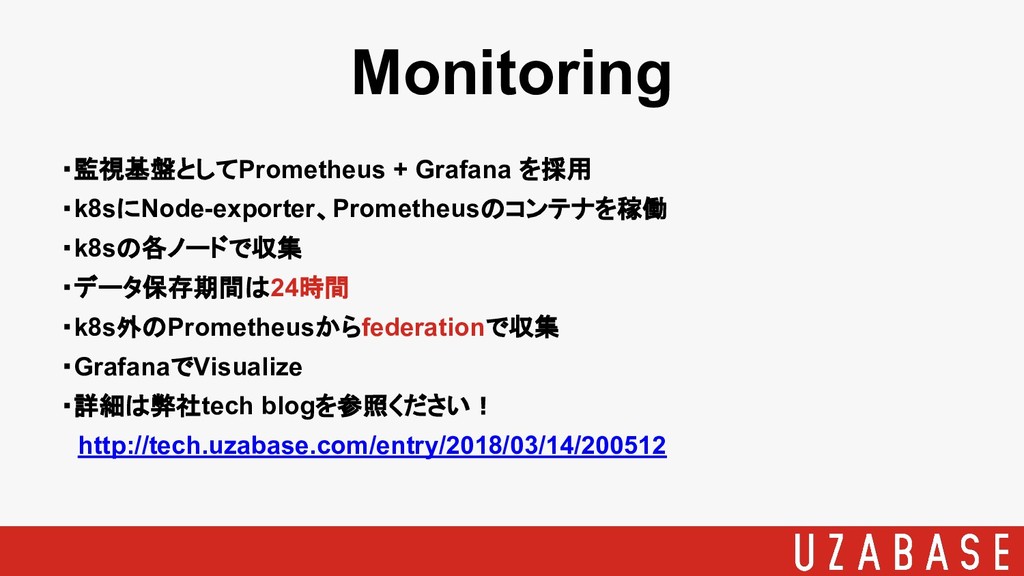
Monitoring ・監視基盤としてPrometheus + Grafana を採用 ・k8sにNode-exporter、Prometheusのコンテナを稼働 ・k8sの各ノードで収集 ・データ保存期間は24時間 ・k8s外のPrometheusからfederationで収集 ・GrafanaでVisualize
・詳細は弊社tech blogを参照ください! http://tech.uzabase.com/entry/2018/03/14/200512
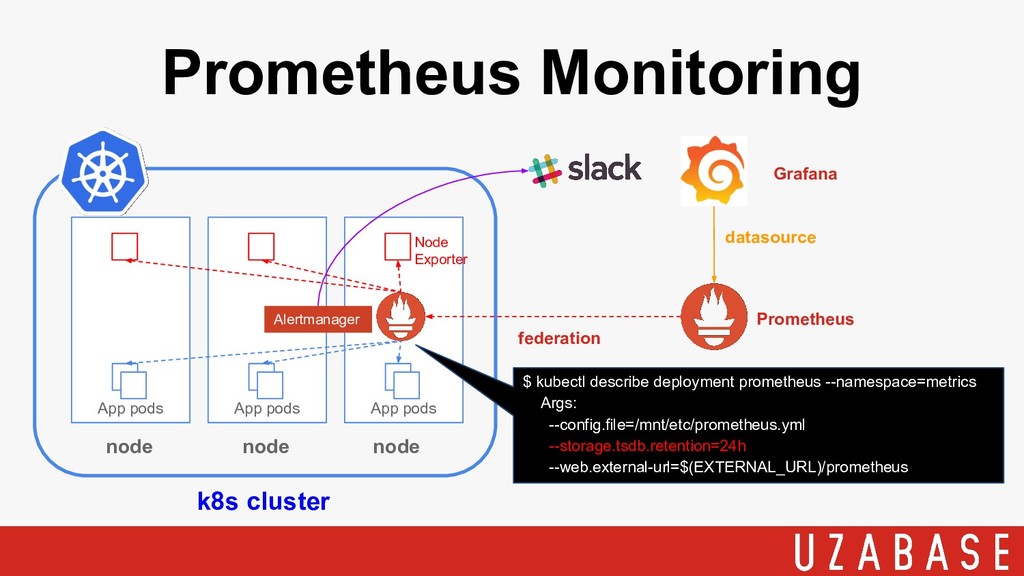
Prometheus Monitoring k8s cluster App pods node node node App
pods App pods Node Exporter federation datasource Prometheus Alertmanager $ kubectl describe deployment prometheus --namespace=metrics Args: --config.file=/mnt/etc/prometheus.yml --storage.tsdb.retention=24h --web.external-url=$(EXTERNAL_URL)/prometheus Grafana
• 開発チームでデプロイまで完結する • SREはクラスター全体の設計に集中 • 権限を移譲することにより各チームが自律して プロジェクトに取り組める環境を作る まとめ
Any questions? Thank you for listening!
![Logging 【Containerで標準出力(JSON形式)】 【Node上のファイル(ネストした JSON形式)】 各Nodeの /var/log/containers/[pod_name]-[namespace]-[container_name]-[container_id].log に出力](https://files.speakerdeck.com/presentations/877dfbb3b03143d3897cabad3eeffde7/slide_24.jpg)