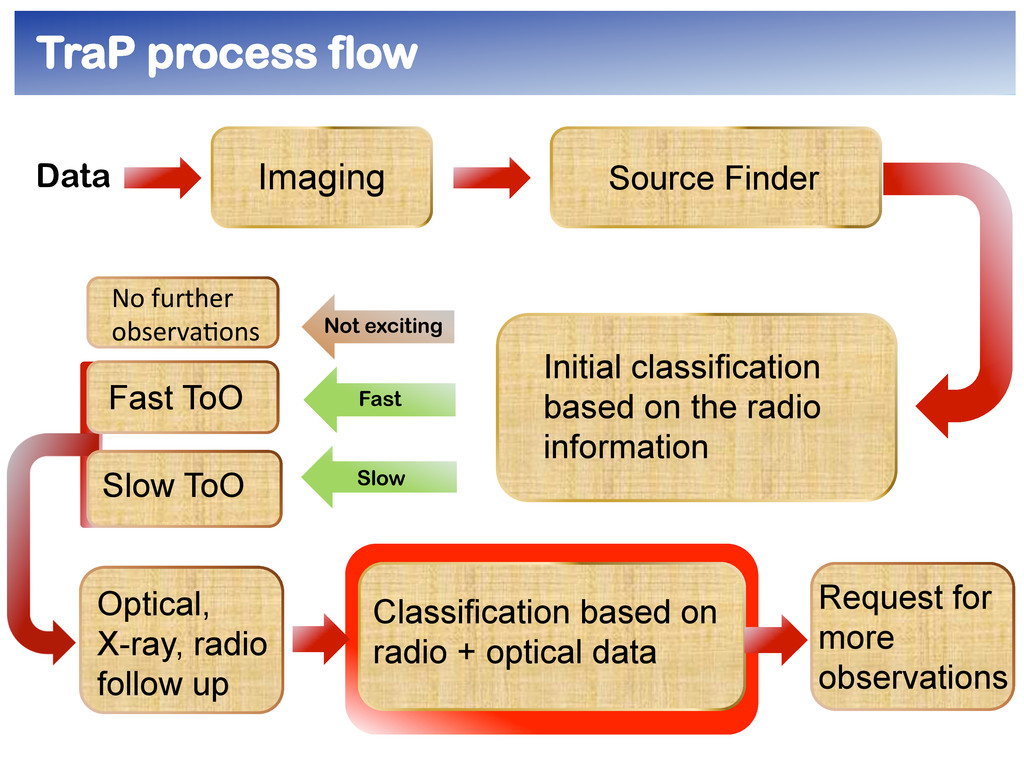
based on the radio information Classification based on radio + optical data No further observa.ons Fast ToO Slow ToO Slow Fast Not exciting Request for more observations Optical, X-ray, radio follow up
based on the radio information Classification based on radio + optical data No further observa.ons Fast ToO Slow ToO Optical, X-ray, radio follow up Slow Fast Not exciting Request for more observations
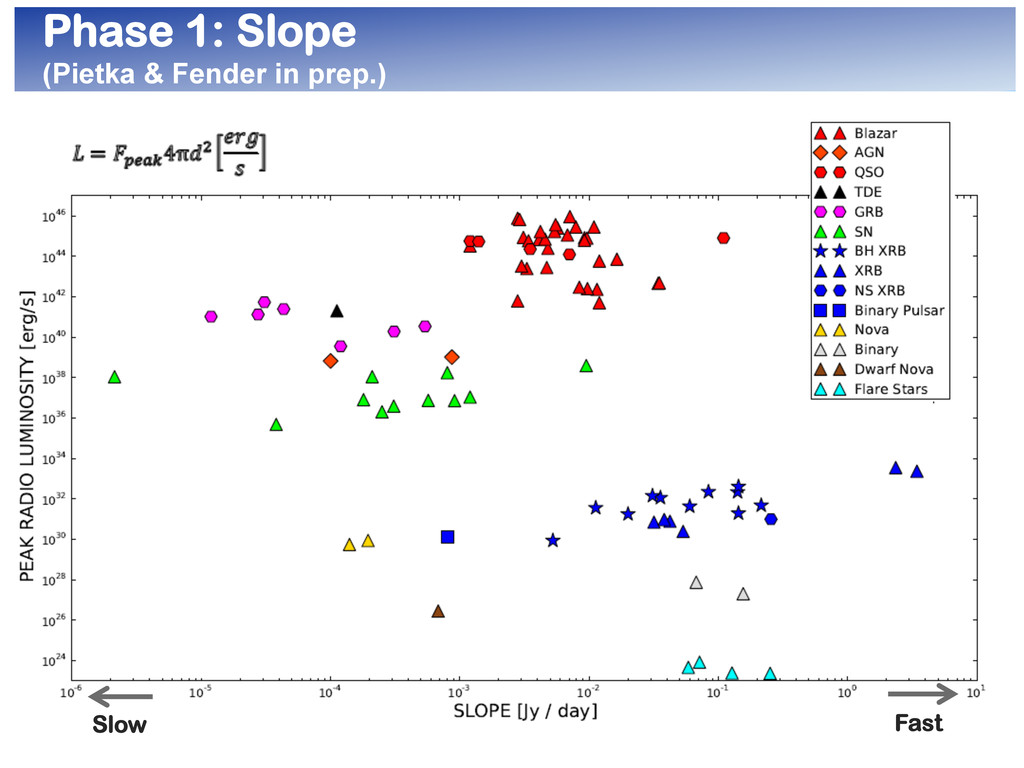
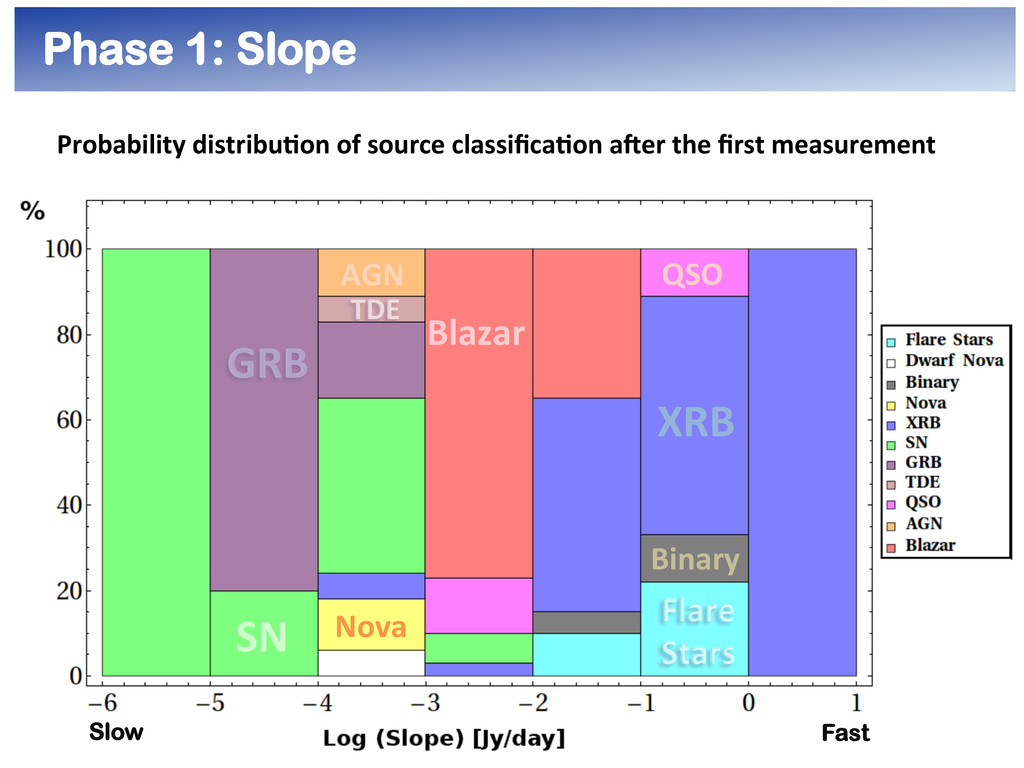
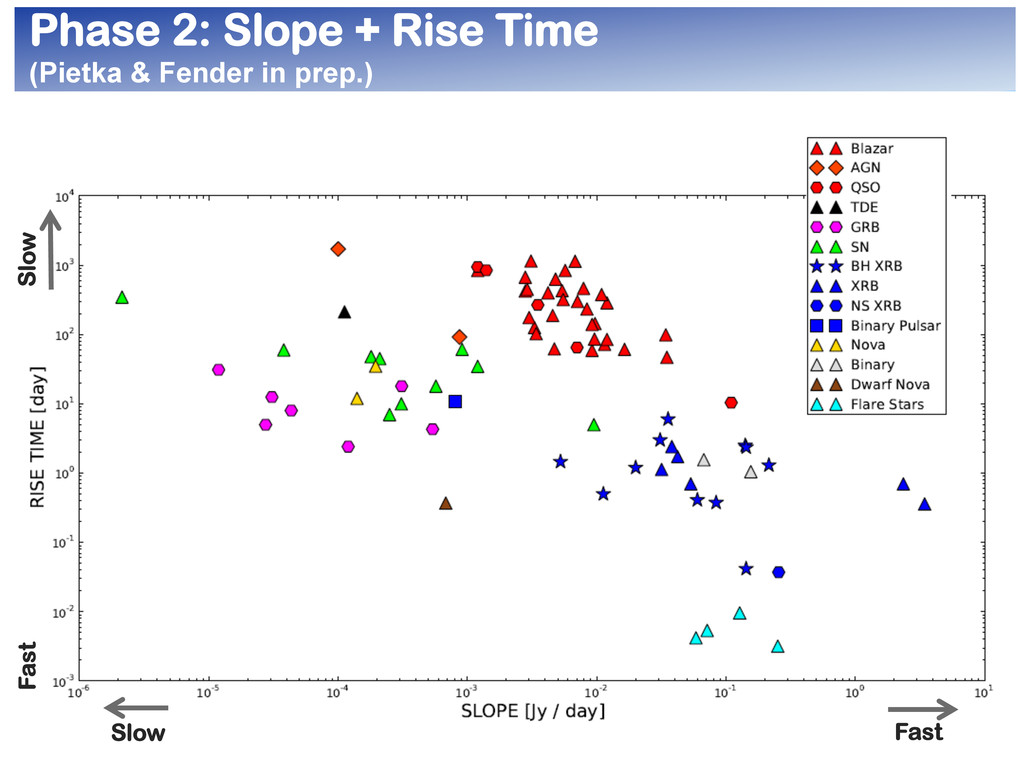
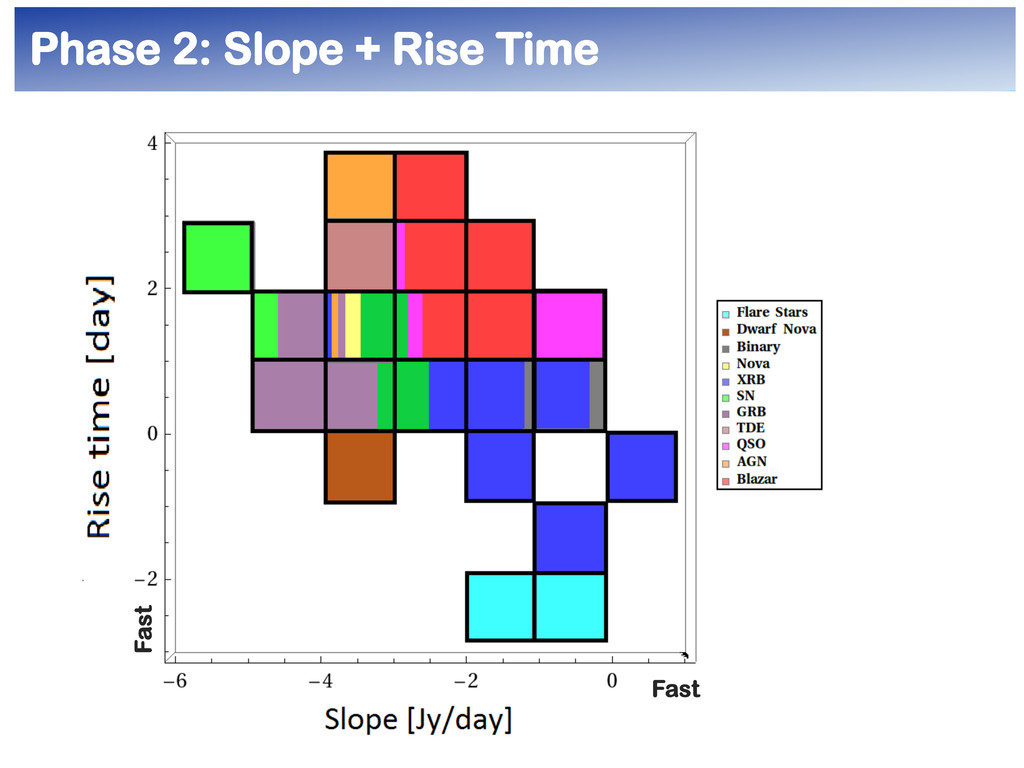
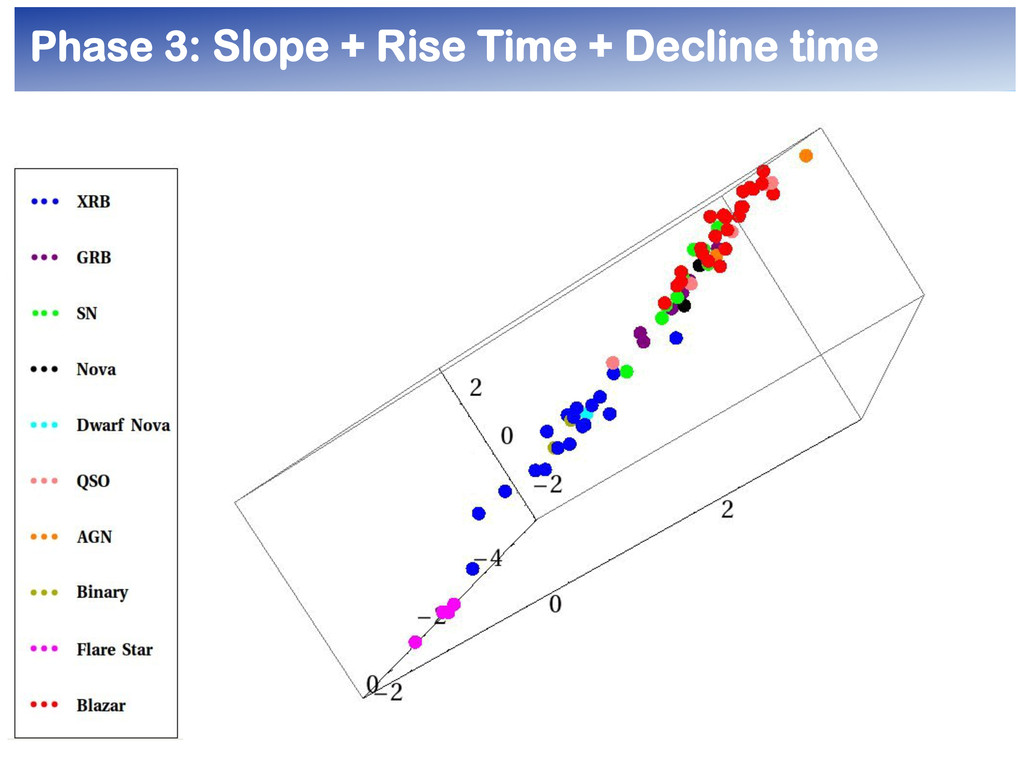
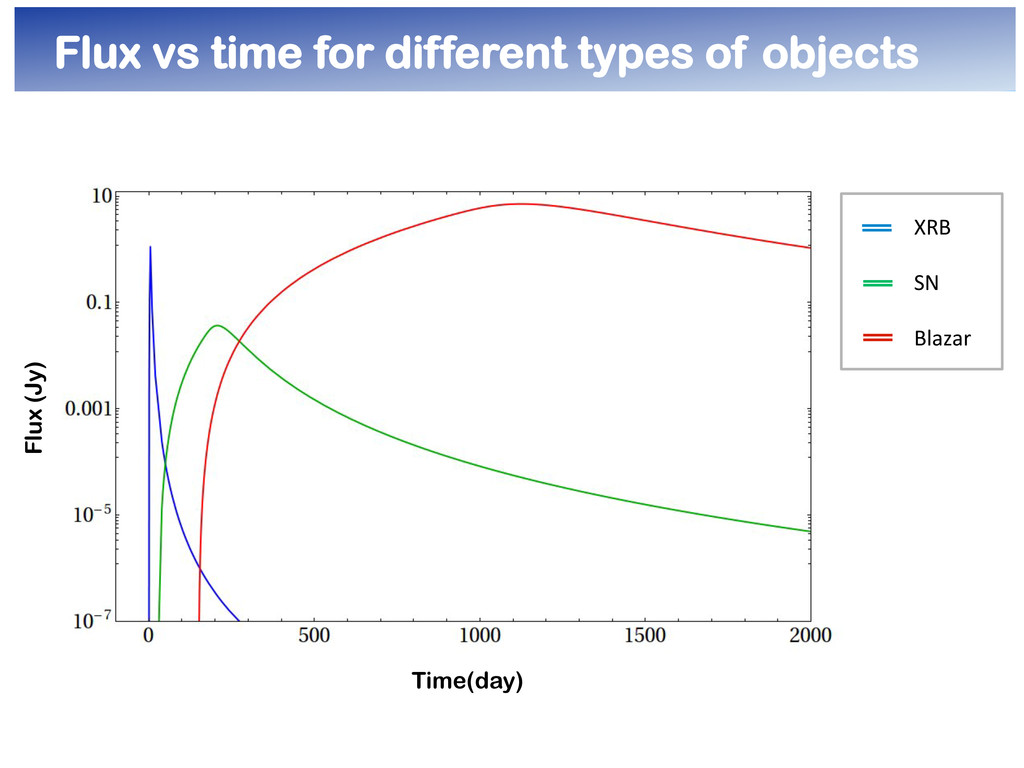
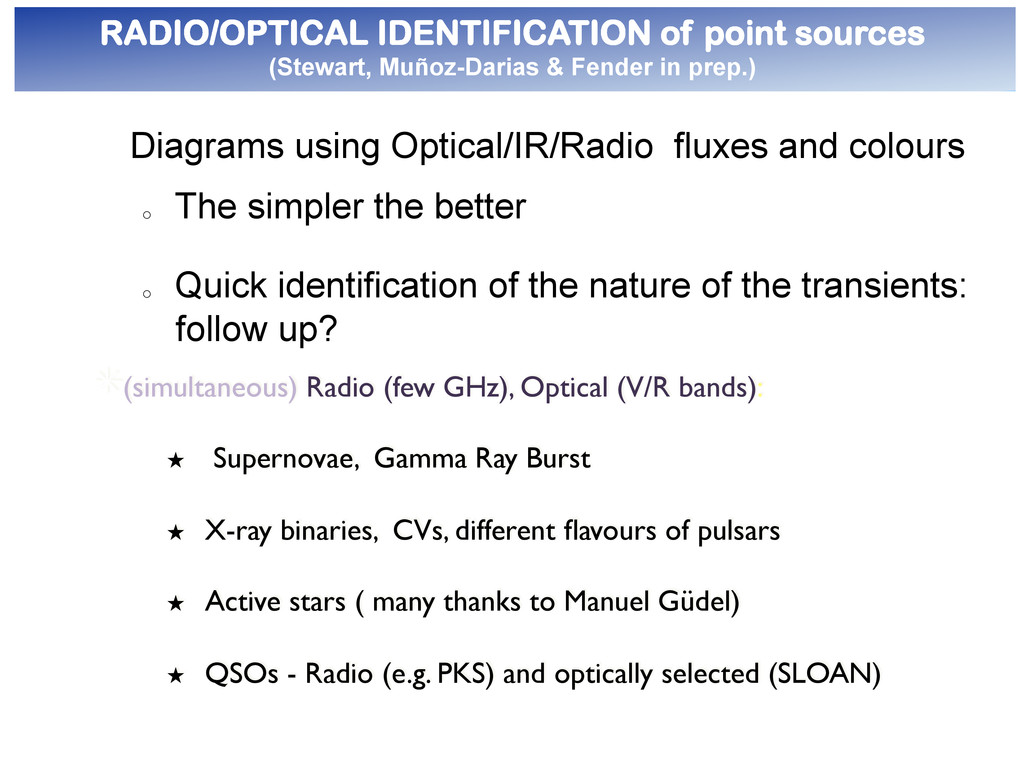
in prep.) " Diagrams using Optical/IR/Radio fluxes and colours o The simpler the better o Quick identification of the nature of the transients: follow up? " (simultaneous) Radio (few GHz), Optical (V/R bands): ★ Supernovae, Gamma Ray Burst ★ X-ray binaries, CVs, different flavours of pulsars ★ Active stars ( many thanks to Manuel Güdel) ★ QSOs - Radio (e.g. PKS) and optically selected (SLOAN)