Upgrade to Pro — share decks privately, control downloads, hide ads and more …

Statistical Inference in Quantum Tomography - Uses of Hypothesis Testing and Information Criteria

Statistical Inference in Quantum Tomography - Uses of Hypothesis Testing and Information Criteria

My PhD candidacy exam talk, presented at the Center for Quantum Information and Control at UNM.

Screencast available via https://www.youtube.com/watch?v=GpJ-bbFkgac

Travis Scholten

October 30, 2014
Tweet

More Decks by Travis Scholten

Other Decks in Science

Transcript

  1. Statistical Inference In Quantum Tomography - Uses of Hypothesis Testing

    and Information Criteria Travis L Scholten! University of New Mexico! Sandia National Labs! (Department 1425)! ! CQuIC Candidacy Exam @ UNM! 30 October 2014 1. Tomography! 2. Better Tomography! 3. Classical Hypothesis Testing! 4. Model Selection! 5. Results Sandia National Laboratories is a multi-program laboratory operated by Sandia Corporation, a wholly owned subsidiary of Lockheed Martin Corporation, for the U.S. Department of Energy’s National Nuclear Security Administration under contract DE-AC04-94AL85000. 0/55
  2. Tomography is the! characterization of systems Control - making systems

    do interesting things Characterization - what does this system even do? Diagnostics - why does the system not do ! what I want it to? 2/55 On what systems can we do tomography?
  3. A Standard Tomographic Process Quantum State Measurement Data Estimate State

    Preparation Measurement ! Implementation Estimate! Reconstruction Error! Evaluation Lots of great work/results… not the focus of this talk. 9/55
  4. Better Tomography It is of the highest importance in the

    art of detection to be able to recognize, out of a number of facts, which … [are] vital. —Sherlock Holmes (The Reigate Puzzle)
  5. Hilbert Space dimension! is vital for tomography! Dimension d analogous

    to number of ! accessible degrees of freedom Quantum states are d x d matrices (density operator) You need to know d to do a reconstruction! Other, more “practical” reasons?…. 12/55
  6. We want our devices! to behave as qubits…. By Glosser.ca

    (Own work) [CC-BY-SA-3.0 (http://creativecommons.org/licenses/by-sa/3.0)], via Wikimedia Commons …should we not check! if this is the case? = 13/55
  7. Physical intuition tells us! some systems have ! small dimension…

    too high energy low enough energy (optical phase space) 17/55
  8. A Better Tomographic Process Quantum State Measurement Data Estimate Pick

    Dimension How to do this?! We need a tool ! to help choose… 20/55 2? 3? 4? 5? …
  9. Inference can use hypothesis tests and/or information criteria Likelihoods What

    are likelihoods? Hypothesis Testing Information Criteria 22/55
  10. Likelihoods are Data Driven p(n) = ✓ N n ◆

    bn(1 b)N n A coin with bias b! comes up heads n times! out of N throws. What is the probability p this happens? 23/55
  11. Likelihoods are Data Driven A coin comes up heads !

    n times out of N throws. What inferences do the data support? Can we say anything about the bias b? 24/55
  12. Likelihoods are Data Driven A coin comes up heads !

    n times out of N throws. What is probability of the data,! given a fixed choice of bias? L(b) = p(n|b) = ✓ N n ◆ bn(1 b)N n 25/55
  13. A Single Flip… The likelihood for the bias being 0

    is 0. "2006 Benjamin Franklin Silver Dollar (Obverse)". Licensed under Public domain via Wikimedia Commons N = 1 n = 1 26/55 L(b) = b
  14. Flip Once More… The likelihood for the bias being 1

    is 0. "2006 Benjamin Franklin Silver Dollar (Reverse)". Licensed under Public domain via Wikimedia Commons N = 2 n = 1 27/55 L(b) = 2b(1 b)
  15. Models for Coins Model = description of possible outcomes (probability

    simplex) TLS RBK p = (.75, .25, 0) p = (.05, .05, .9) p = (heads, tails, edge) 29/55
  16. Models for Coins TLS RBK p = (.75, .25, 0)

    p = (.05, .05, .9) If any edge shows up, TLS is wrong -! assigned 0 probability to that outcome! oops! 30/55
  17. Models for Coins TLS RBK p = (.75, .25, 0)

    p = (.05, .05, .9) If no edge shows up, RBK can do no better than TLS - has extra outcome to account for irrelevant! 31/55
  18. We compare models with loglikelihood ratio statistics (LLRS). Compare models

    = compare maximum likelihoods Which model assigns higher probability to data we saw? Quantify weight of evidence for one model or another 33/55 = 2 log 0 @ max p2TLS L ( p ) max p2RBK L ( p ) 1 A
  19. We compare models with loglikelihood ratio statistics (LLRS). Any edge:

    = 2 log(0) = 1 No edge: Quantify weight of evidence for one model or another (Evidence for RBK) = 2 log(1) = 0 (No evidence either way) 34/55 = 2 log 0 @ max p2TLS L ( p ) max p2RBK L ( p ) 1 A
  20. General Framework Quantify weight of evidence for one model or

    another. = 2 log ✓ max p2 1 L ( p ) max p2 2 L ( p ) ◆ Knowing distribution to infer ! something about our model(s). 35/55 is a random variable - in some cases, its distribution can be computed. p( )
  21. Case 1 Model Mismatch: / N When truth outside smaller

    model! LLRS grows with sample size true 37/55
  22. Case 2 The Wilks theorem: ⇠ 2 k2 k1 kj

    is number of parameters in model j When truth inside smaller model! LLRS has chi-squared distribution h i = k2 k1 ( )2 = 2(k2 k1) true 38/55
  23. To Sum Up…. Need tool for dimension decisions Project Goal:

    Devise, Use, and Evaluate a rule based on LLRS Hypothesis testing provides a framework via LLRS Hypotheses: state is d or D dimensional 40/55
  24. Testing A Rule Estimate (do MLE) in many dimensions Examine

    relationship between ! LLRS and sample size Pick a quantum system optical modes Simulate measurements coherent state projection |↵ih↵| Compute LLRS Pick some (fiducial) quantum state 42/55 ⇢true
  25. Using Hypothesis Testing to Establish! Choices for Dimension N Both

    equally good? Keep this one! Reject this! Can we use pattern matching (“just plot it!”)? h i 43/55
  26. Using Hypothesis Testing to Establish ! Choices for Dimension N

    Can we compute some threshold value of LLRS and compare data against it? Both equally good? Keep this one! Reject this! h i 44/55
  27. n/m = 2 log ✓ max p2n L ( p

    ) max p2m L ( p ) ◆ Asymptotic Convergence? 48/55 Loglikelihood Ratio for ⇢true = | 0 ih 0 |
  28. Does the Wilks theorem work? k2 k1 = d2 2

    d2 1 The Wilks theorem predicts values which are way too high? “All parameters estimate” ⇢ ⇠ Expected: h i = ( d ) 2 + 2 d1( d ) Observed: h i / ( d) 49/55 Loglikelihood Ratio for ⇢true = | 0 ih 0 | Loglikelihood Ratio for ⇢true = | 0 ih 0 |
  29. High energy Fock state ! contributes 0 to density matrix

    elements ~ 0 Only “coherencies” with smaller model are retained? Does the Wilks theorem work? 50/55
  30. Does the Wilks theorem work? An effect of boundaries? “Some

    parameters estimate” k2 k1 = 2(d2 d1) ⇢ ⇠ Observed: h i / ( d) Expected: h i / ( d ) 51/55 Loglikelihood Ratio for ⇢true = | 0 ih 0 | Loglikelihood Ratio for ⇢true = | 0 ih 0 |
  31. Observations Asymptotic convergence happens, but not as expected from naive

    application of the Wilks theorem When smaller model does not fit, we observe linear growth 52/55 Loglikelihood Ratio for ⇢true = | 0 ih 0 | Loglikelihood Ratio for ⇢true = | 2 ih 2 |
  32. The Road Ahead ❖ Develop a general theory for LLRS

    and tomography! ❖ Use information criteria instead?! ❖ “Real life” use? Hypothesis Testing Information Criteria Tries to Fit Past Data Future Data True Model? Yes No Arbitrary Complexity? Possible Not Usually Right Now Future 53/55
  33. Take Away Determining system dimension is a big deal.! Practical

    and theoretical use for new tools to do so! LLRS is a way to go! Develop a theory for LLRS & quantum tomography! Use information criteria 55/55
  34. Qudit quantum-state tomography R. T. Thew* omputer Technology, University of

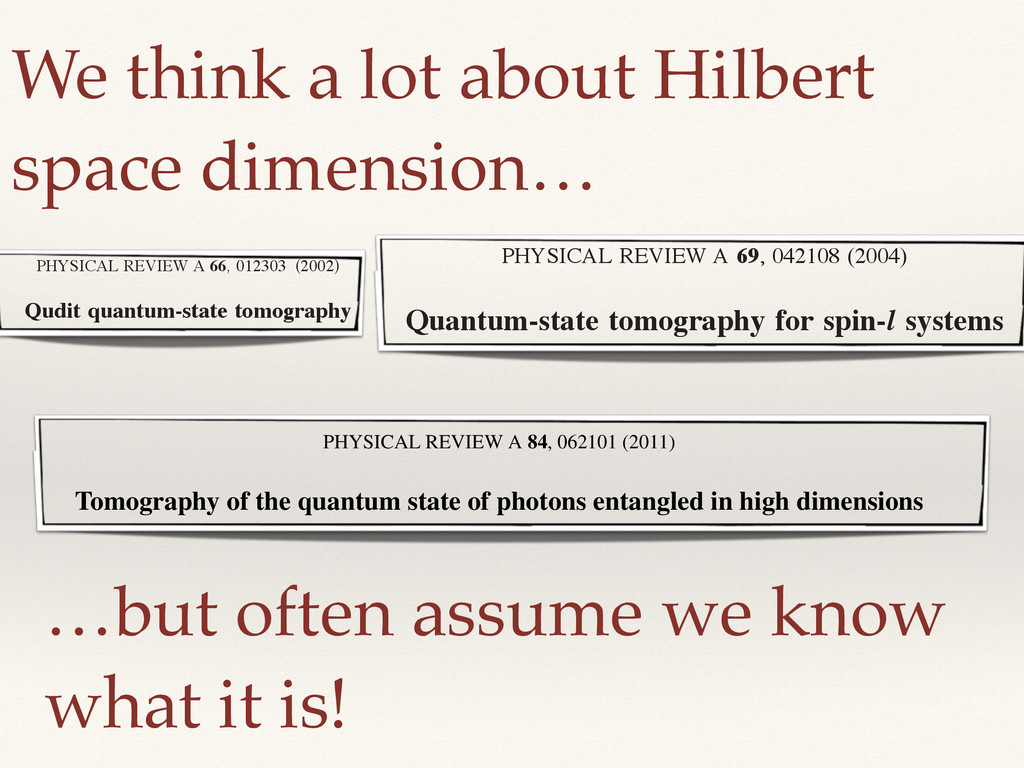
    Queensland, QLD 4072, Brisbane, Australia University of Geneva, 20 rue de l’Ecole-de-Me ´decine, CH-1211 Geneva 4, Switzerland K. Nemoto formatics, University of Wales, Bangor LL57 1UT, United Kingdom A. G. White omputer Technology, University of Queensland, QLD 4072, Brisbane, Australia W. J. Munro boratories, Filton Road, Stoke Gifford, Bristol BS34 8QZ, United Kingdom ͑Received 14 January 2002; published 16 July 2002͒ graphy has been proposed as a fundamental tool for prototyping a few qubit quan- complete reconstruction of the state produced from a given input into the device. nsity matrix, relevant quantum information quantities such as the degree of entangle- alculated. Generally, orthogonal measurements have been discussed for this tomog- is paper, we extend the tomographic reconstruction technique to two new regimes. hogonal measurements allow the reconstruction of the state of the system provided PHYSICAL REVIEW A 66, 012303 ͑2002͒ PHYSICAL REVIEW A 84, 062101 (2011) Tomography of the quantum state of photons entangled in high dimensions Megan Agnew,1 Jonathan Leach,1 Melanie McLaren,2 F. Stef Roux,2 and Robert W. Boyd1,3 1Department of Physics, University of Ottawa, 150 Louis Pasteur, Ottawa, Ontario, K1N 6N5 Canada 2CSIR National Laser Centre, Pretoria 0001, South Africa 3Institute of Optics, University of Rochester, Rochester, New York 14627, USA (Received 28 September 2011; published 2 December 2011) Systems entangled in high dimensions have recently been proposed as important tools for various quantum information protocols, such as multibit quantum key distribution and loophole-free tests of nonlocality. It is therefore important to have precise knowledge of the nature of such entangled quantum states. We tomographically Quantum-state tomography for spin-l systems Holger F. Hofmann* and Shigeki Takeuchi PRESTO, Japan Science and Technology Corporation (JST), Research Institute for Electronic Sci Kita-12 Nishi-6, Kita-ku, Sapporo 060-0812, Japan (Received 30 September 2003; published 23 April 2004) We show that the density matrix of a spin-l system can be described entirely in terms statistics of projective spin measurements along a minimum of 4l+1 different spin direction to represent the complete quantum statistics of any N-level system within the spherical dimensional space defined by the spin vector. An explicit method for reconstructing the spin-1 system from the measurement statistics of five nonorthogonal spin directions is generalization to spin-l systems is discussed. DOI: 10.1103/PhysRevA.69.042108 PACS number(s): 03.65.Wj, PHYSICAL REVIEW A 69, 042108 (2004) We think a lot about Hilbert space dimension… …but often assume we know what it is!
  35. n/m = 2 log ✓ max p2n L ( p

    ) max p2m L ( p ) ◆ Asymptotic Convergence? Loglikelihood ratio for ⇢ = | 1 ih 1 |
  36. Does the Wilks theorem work? An effect of reconstruction?! Of

    true state? k2 k1 = 2(d2 d1) ⇢ ⇠ Observed: h i / ( d) Expected: h i / ( d ) “Some parameters estimate” Loglikelihood ratio for ⇢ = | 1 ih 1 |
  37. Technical Aside ❖ Simple hypotheses = Neyman-Pearson! ❖ Guaranteed best

    statistic is likelihood ratio! ❖ Composite hypotheses = NO Neyman-Pearson! ❖ A different idea of best test wrt power! ❖ Allows nesting Hilbert space dimensions
  38. Wigner Function Reconstruction 55 Wigner function = representation of quantum

    state in phase space By Gerd Breitenbach (dissertation) [GFDL (http://www.gnu.org/copyleft/fdl.html) or CC-BY-SA-3.0 (http://creativecommons.org/licenses/by-sa/3.0/)], via Wikimedia Commons Make plots to visualize! states Are the wiggles real? Can we even tell?
  39. Categories of POVMs POVM finite dimensional POVM infinite dimensional Finite

    Number of Outcomes Pauli eigenbasis! measurement Parity measurement Countably Infinite Outcomes Photon number counting Uncountably Infinite Outcomes Haar uniform qudit projection Heterodyne/ Homodyne/Coherent state projections