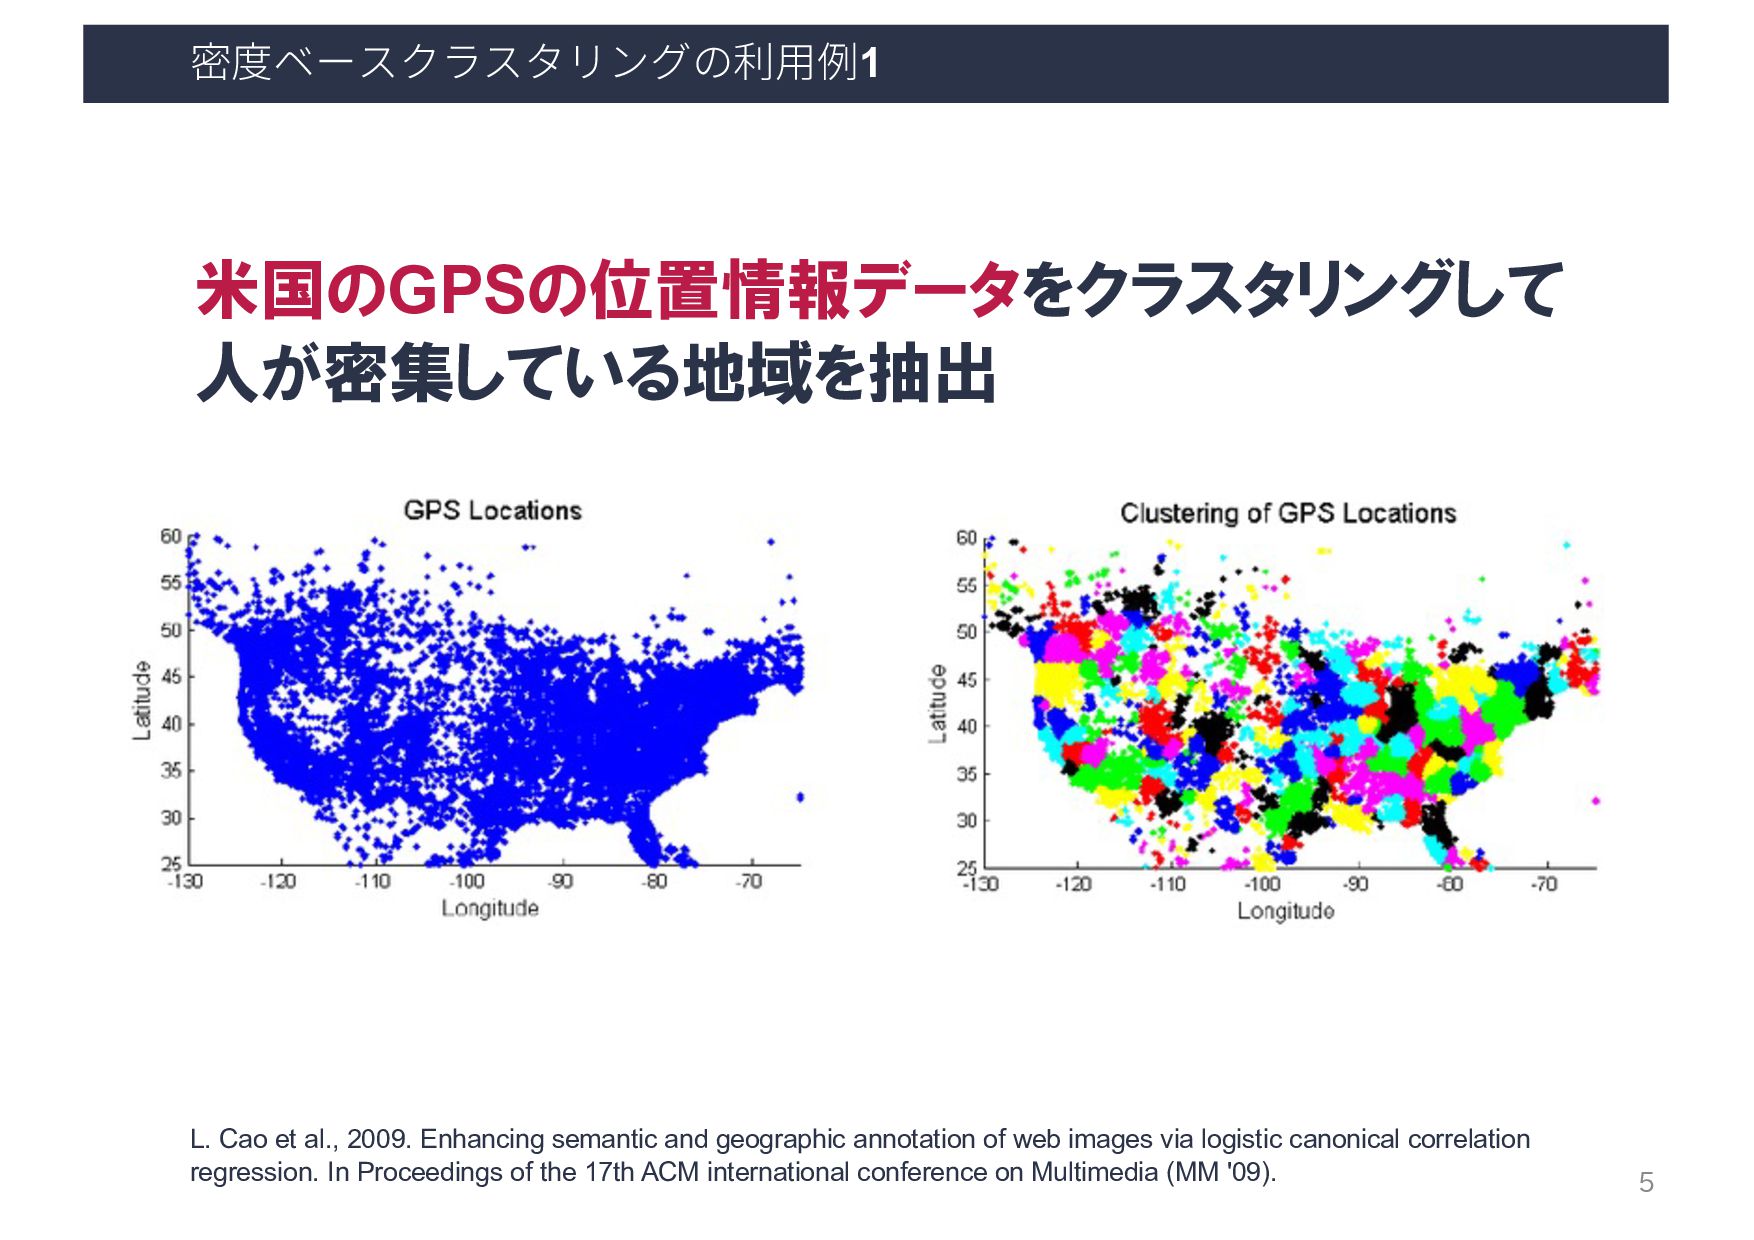
and geographic annotation of web images via logistic canonical correlation regression. In Proceedings of the 17th ACM international conference on Multimedia (MM '09). 5
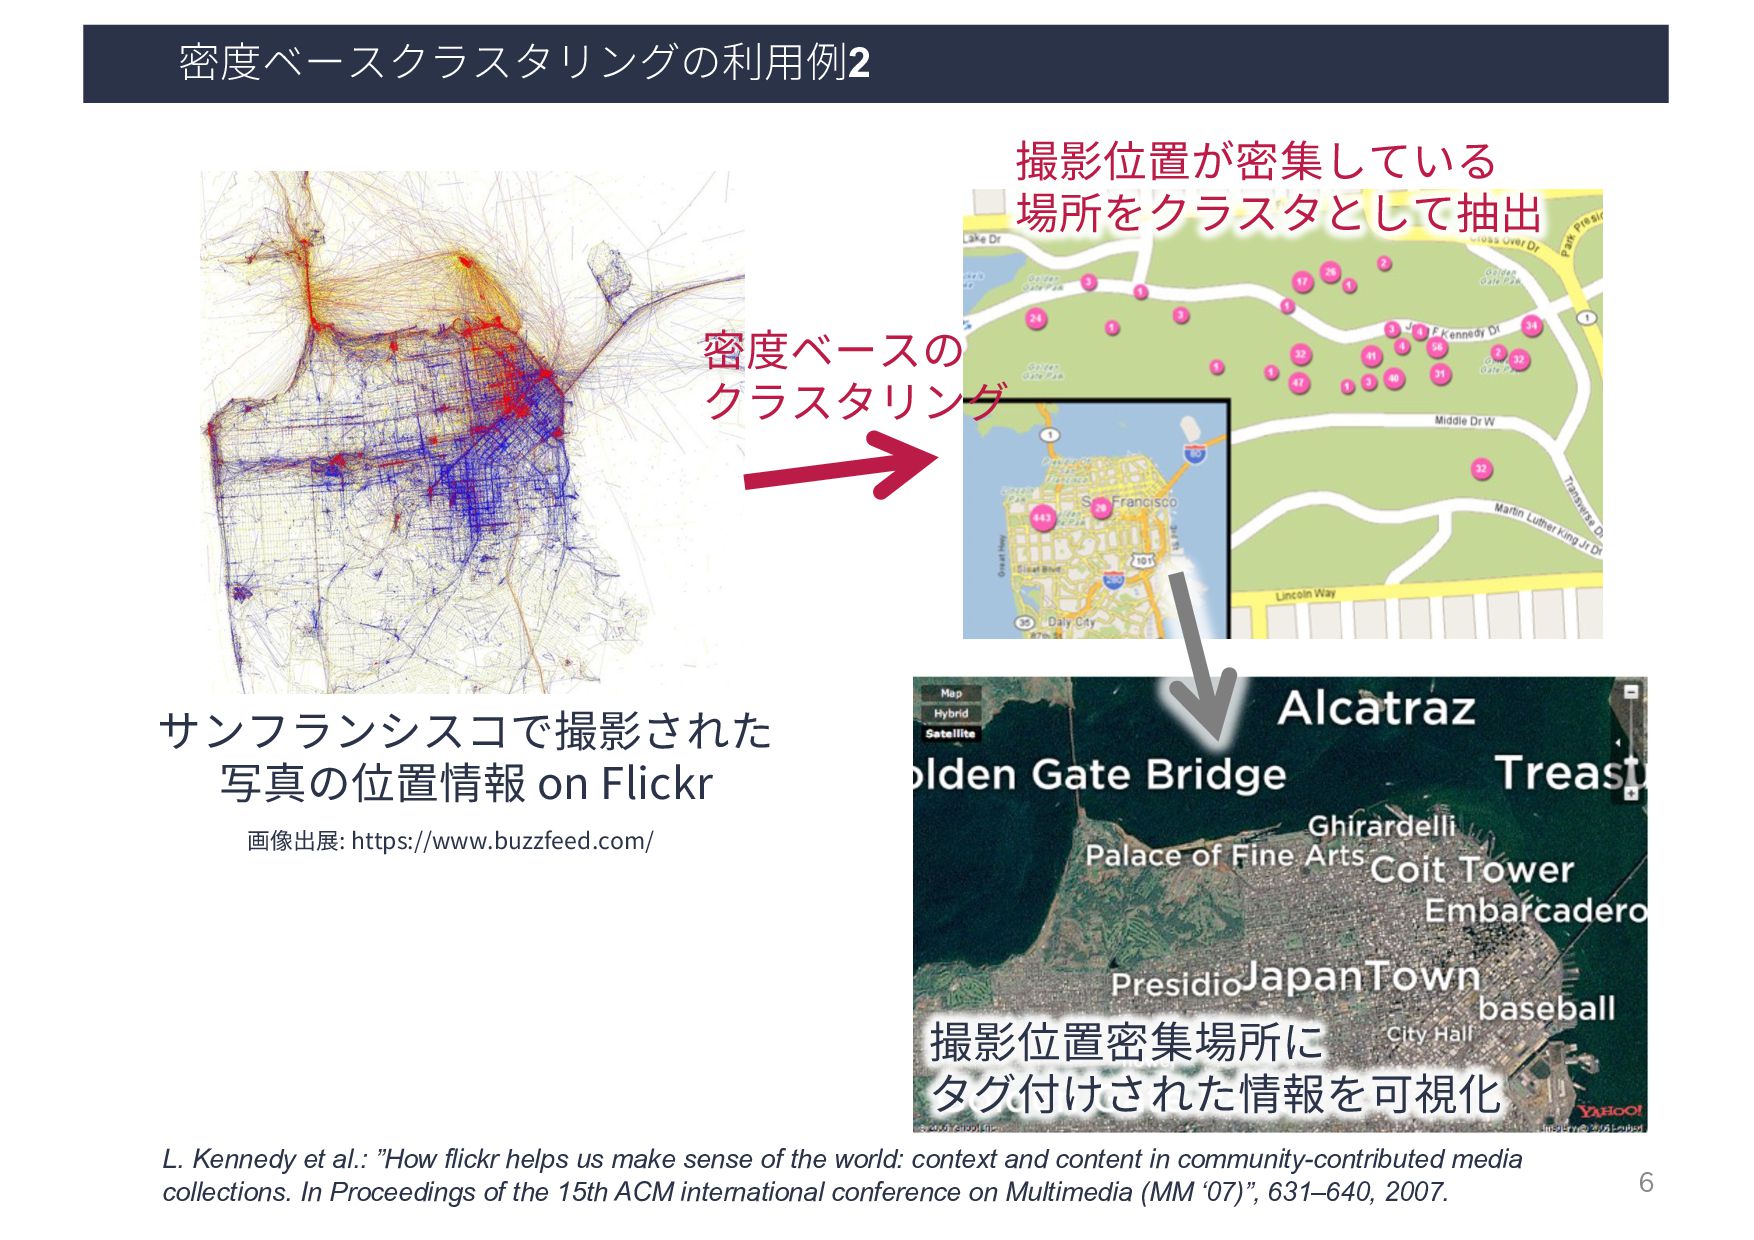
et al.: ”How flickr helps us make sense of the world: context and content in community-contributed media collections. In Proceedings of the 15th ACM international conference on Multimedia (MM ‘07)”, 631–640, 2007. 密度ベースの クラスタリング 撮影位置が密集している 場所をクラスタとして抽出 撮影位置密集場所に タグ付けされた情報を可視化
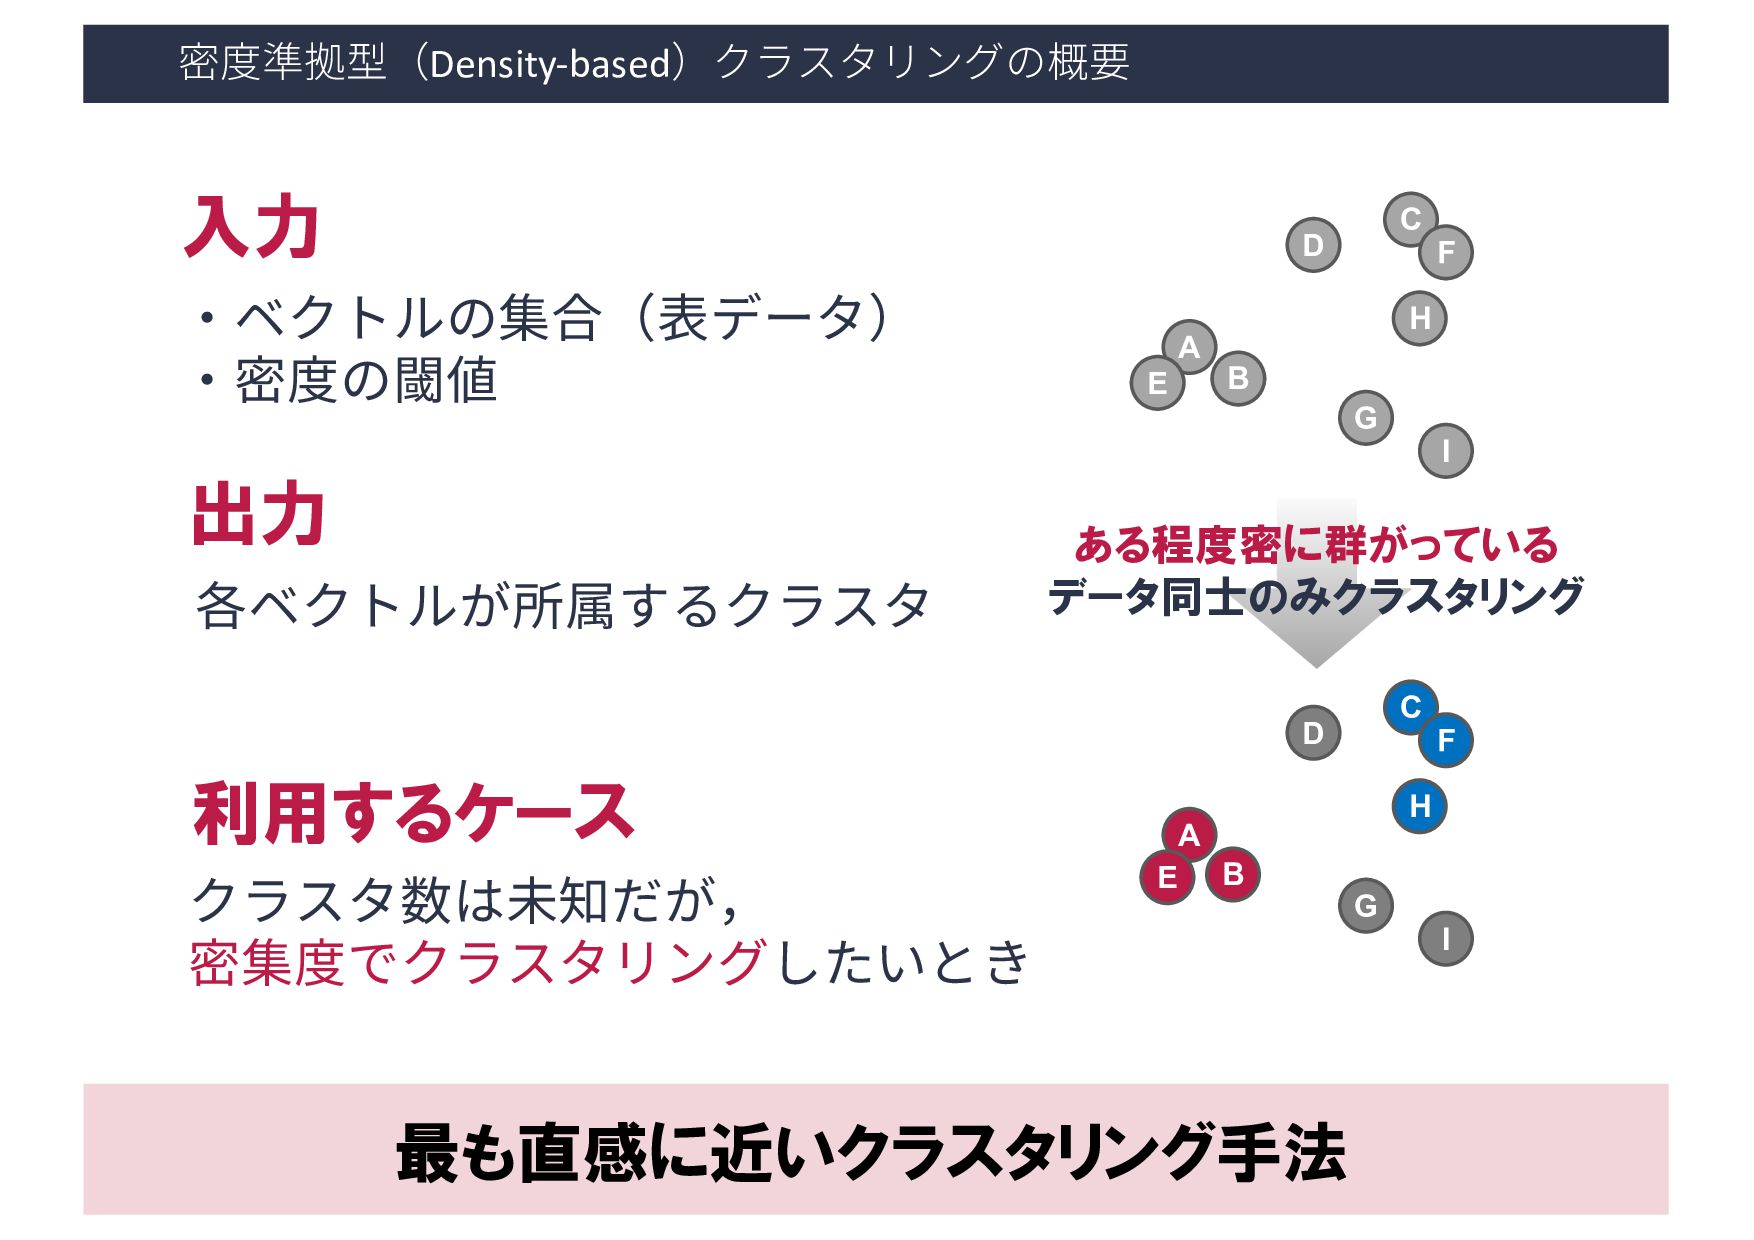
・密度の閾値 - 到達可能距離: ε - コア点の数: minPts 出力 各ベクトルが所属するクラスタ & ノイズデータ 利用するケース クラスタ数は未知だが, 密集度でクラスタリングしたいとき A B D C E F G H I A B D C E F G H I 8 ある程度密に群がっている データ同士のみクラスタリング
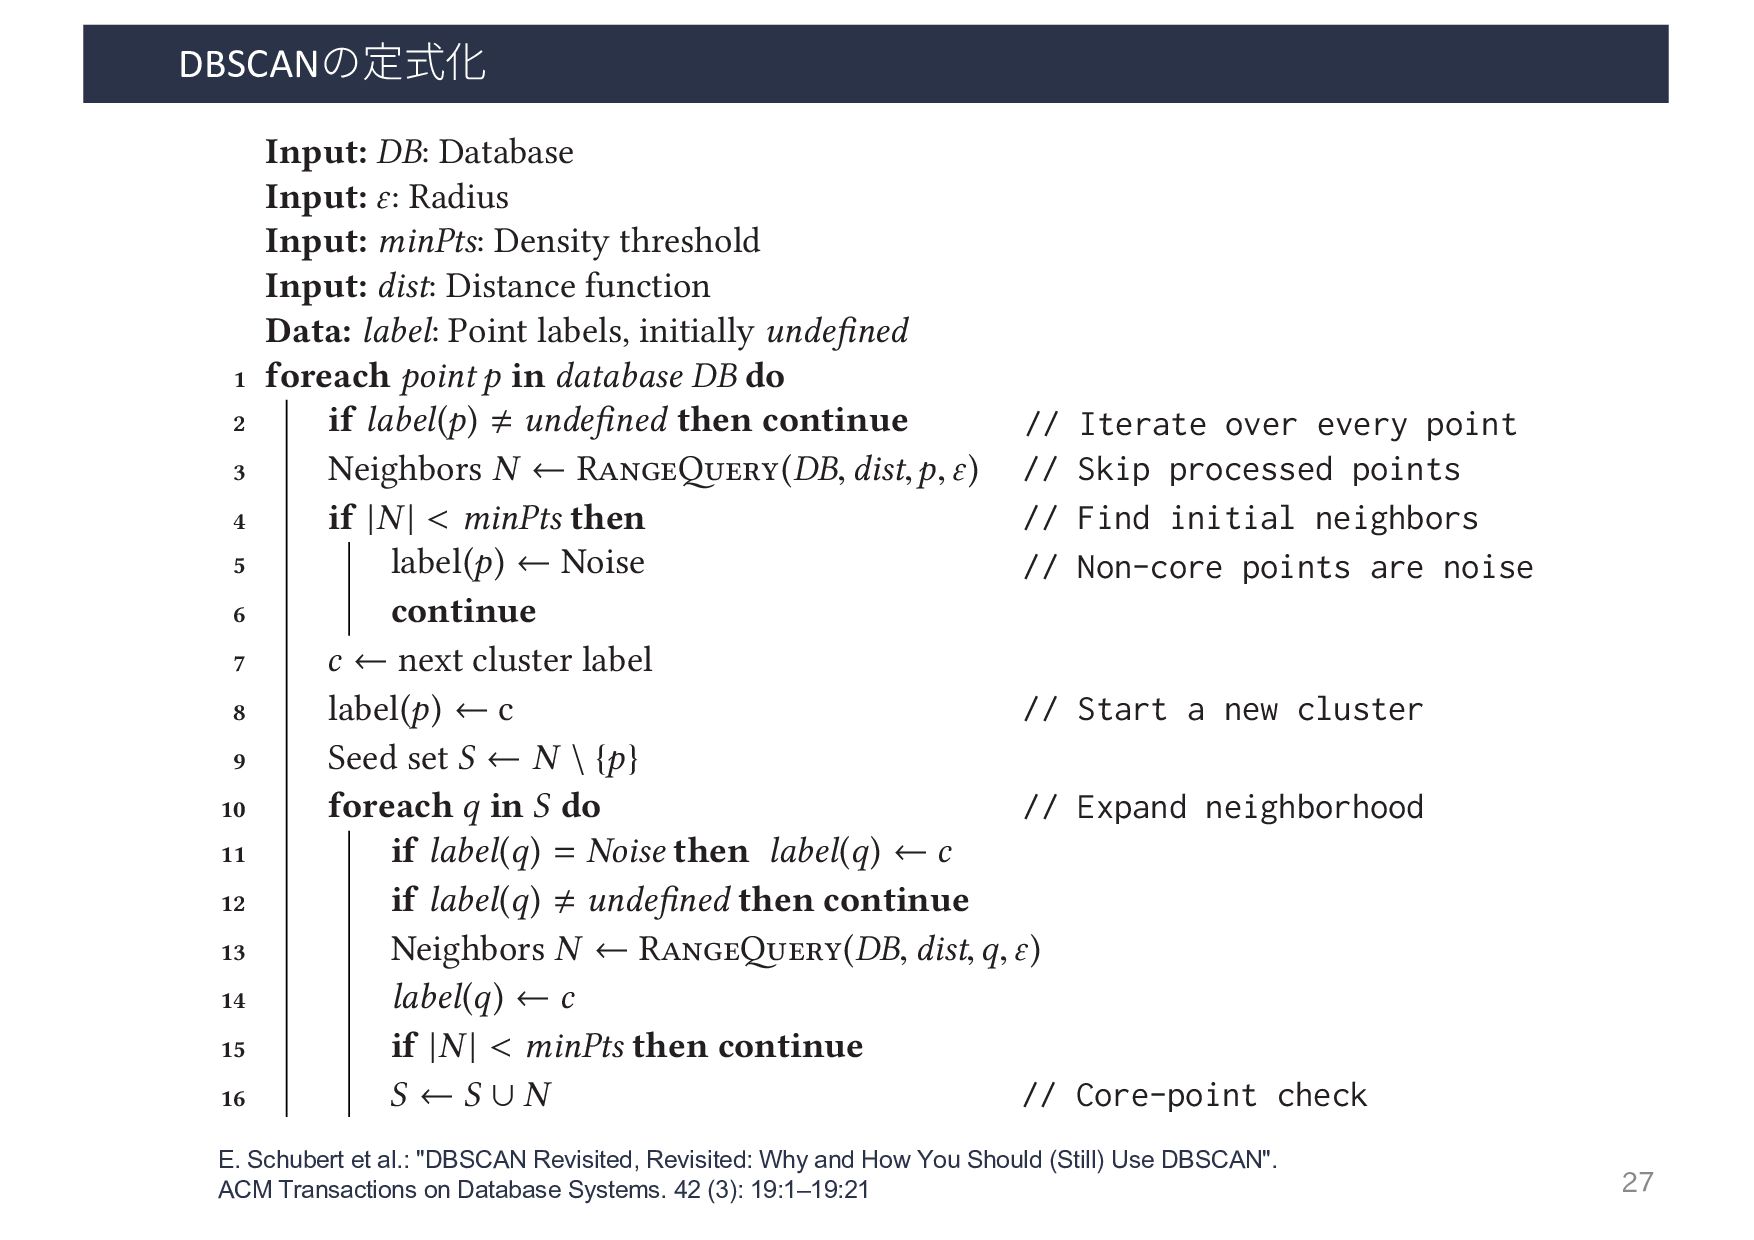
Input: DB: Database Input: ε: Radius Input: minPts: Density threshold Input: dist: Distance function Data: label: Point labels, initially unde ned 1 foreach point p in database DB do // Iterate over every poin 2 if label(p) unde ned then continue // Skip processed points 3 Neighbors N ← R (DB, dist,p,ε) // Find initial neighbors 4 if |N | < minPts then // Non-core points are noi 5 label(p) ← Noise 6 continue 7 c ← next cluster label // Start a new cluster 8 label(p) ← c 9 Seed set S ← N \ {p} // Expand neighborhood 10 foreach q in S do 11 if label(q) = Noise then label(q) ← c 12 if label(q) unde ned then continue 13 Neighbors N ← R (DB, dist,q,ε) 14 label(q) ← c 15 if |N | < minPts then continue // Core-point check 16 S ← S ∪ N :4 E. Schubert et al. LGORITHM 1: Pseudocode of Original Sequential DBSCAN Algorithm Input: DB: Database Input: ε: Radius Input: minPts: Density threshold Input: dist: Distance function Data: label: Point labels, initially unde ned foreach point p in database DB do // Iterate over every point if label(p) unde ned then continue // Skip processed points Neighbors N ← R (DB, dist,p,ε) // Find initial neighbors if |N | < minPts then // Non-core points are noise label(p) ← Noise continue c ← next cluster label // Start a new cluster label(p) ← c Seed set S ← N \ {p} // Expand neighborhood foreach q in S do if label(q) = Noise then label(q) ← c if label(q) unde ned then continue Neighbors N ← R (DB, dist,q,ε) label(q) ← c if |N | < minPts then continue // Core-point check S ← S ∪ N E. Schubert et al.: "DBSCAN Revisited, Revisited: Why and How You Should (Still) Use DBSCAN". ACM Transactions on Database Systems. 42 (3): 19:1–19:21
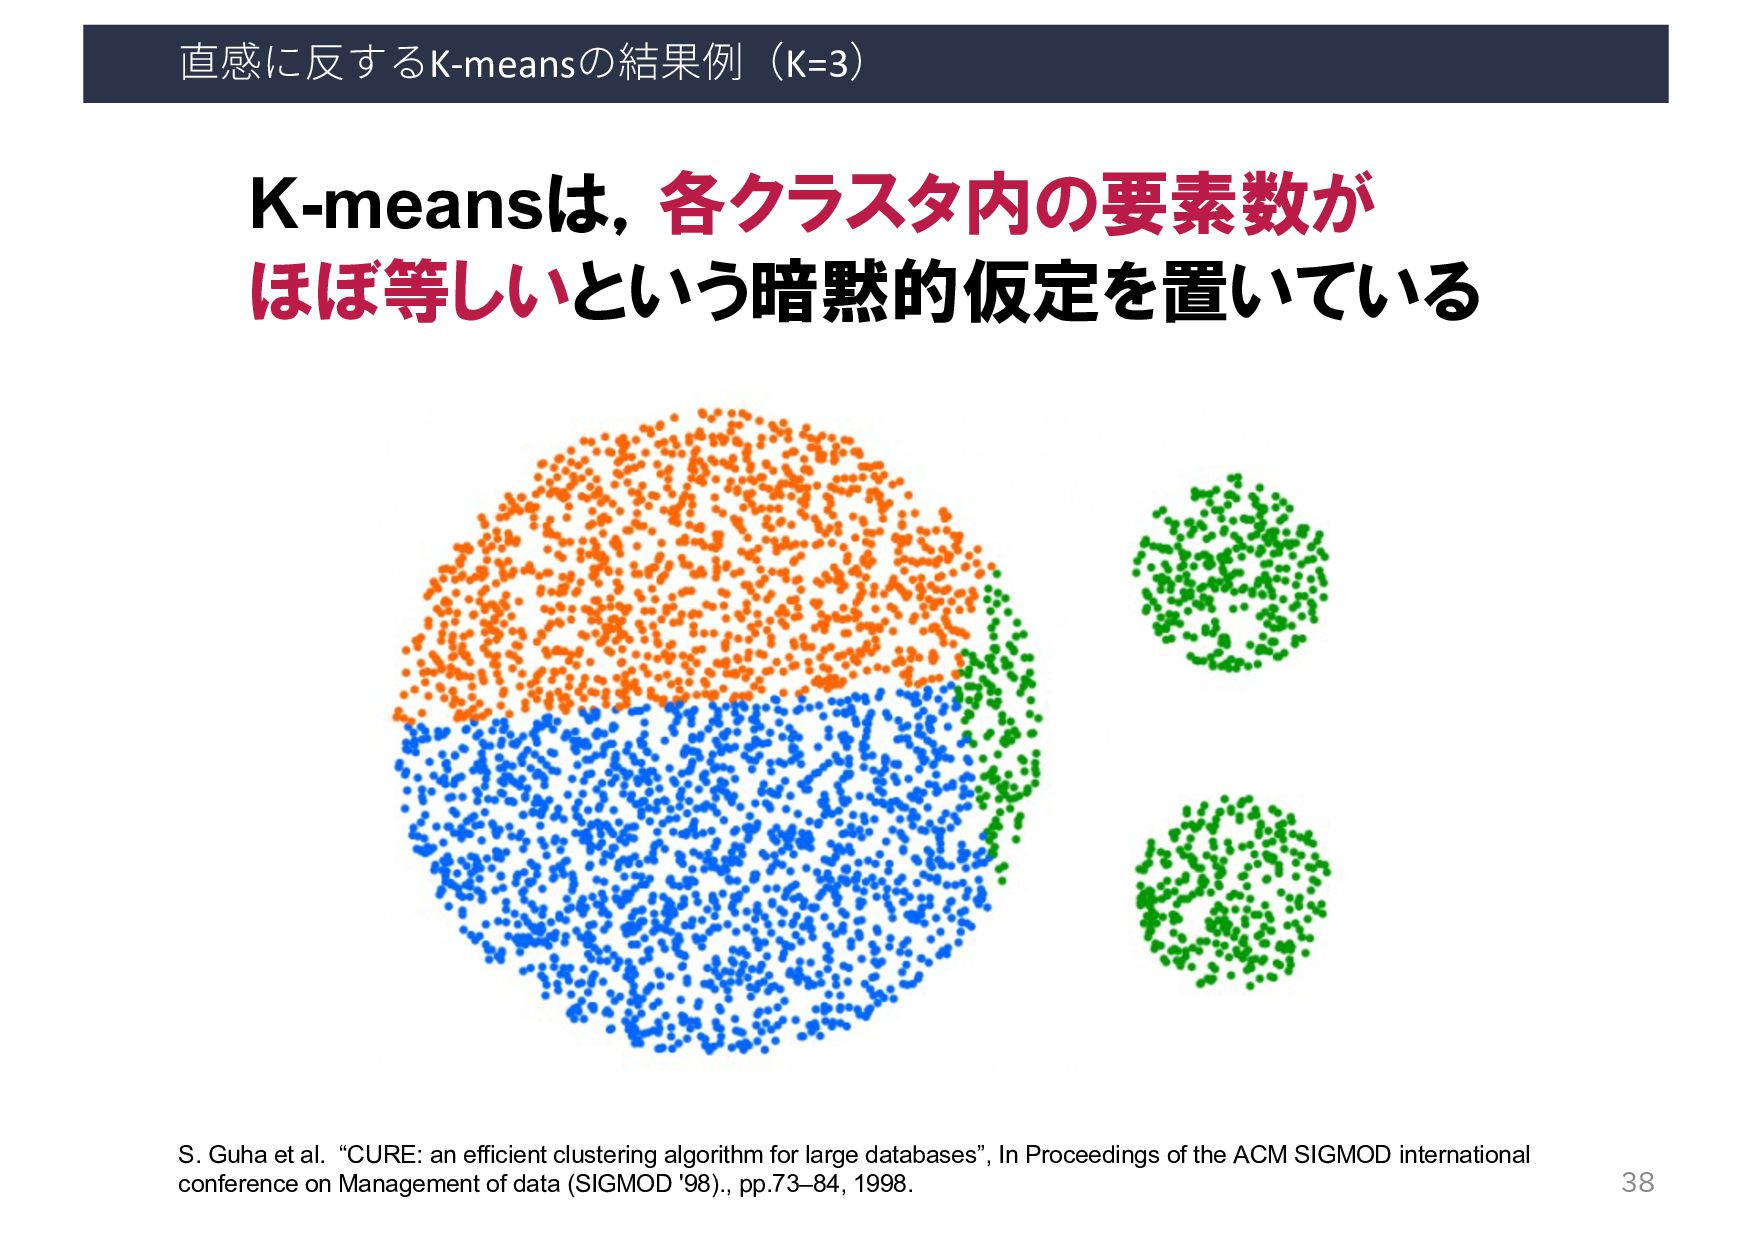
algorithm for large databases”, In Proceedings of the ACM SIGMOD international conference on Management of data (SIGMOD '98)., pp.73–84, 1998. K-meansは,各クラスタ内の要素数が ほぼ等しいという暗黙的仮定を置いている
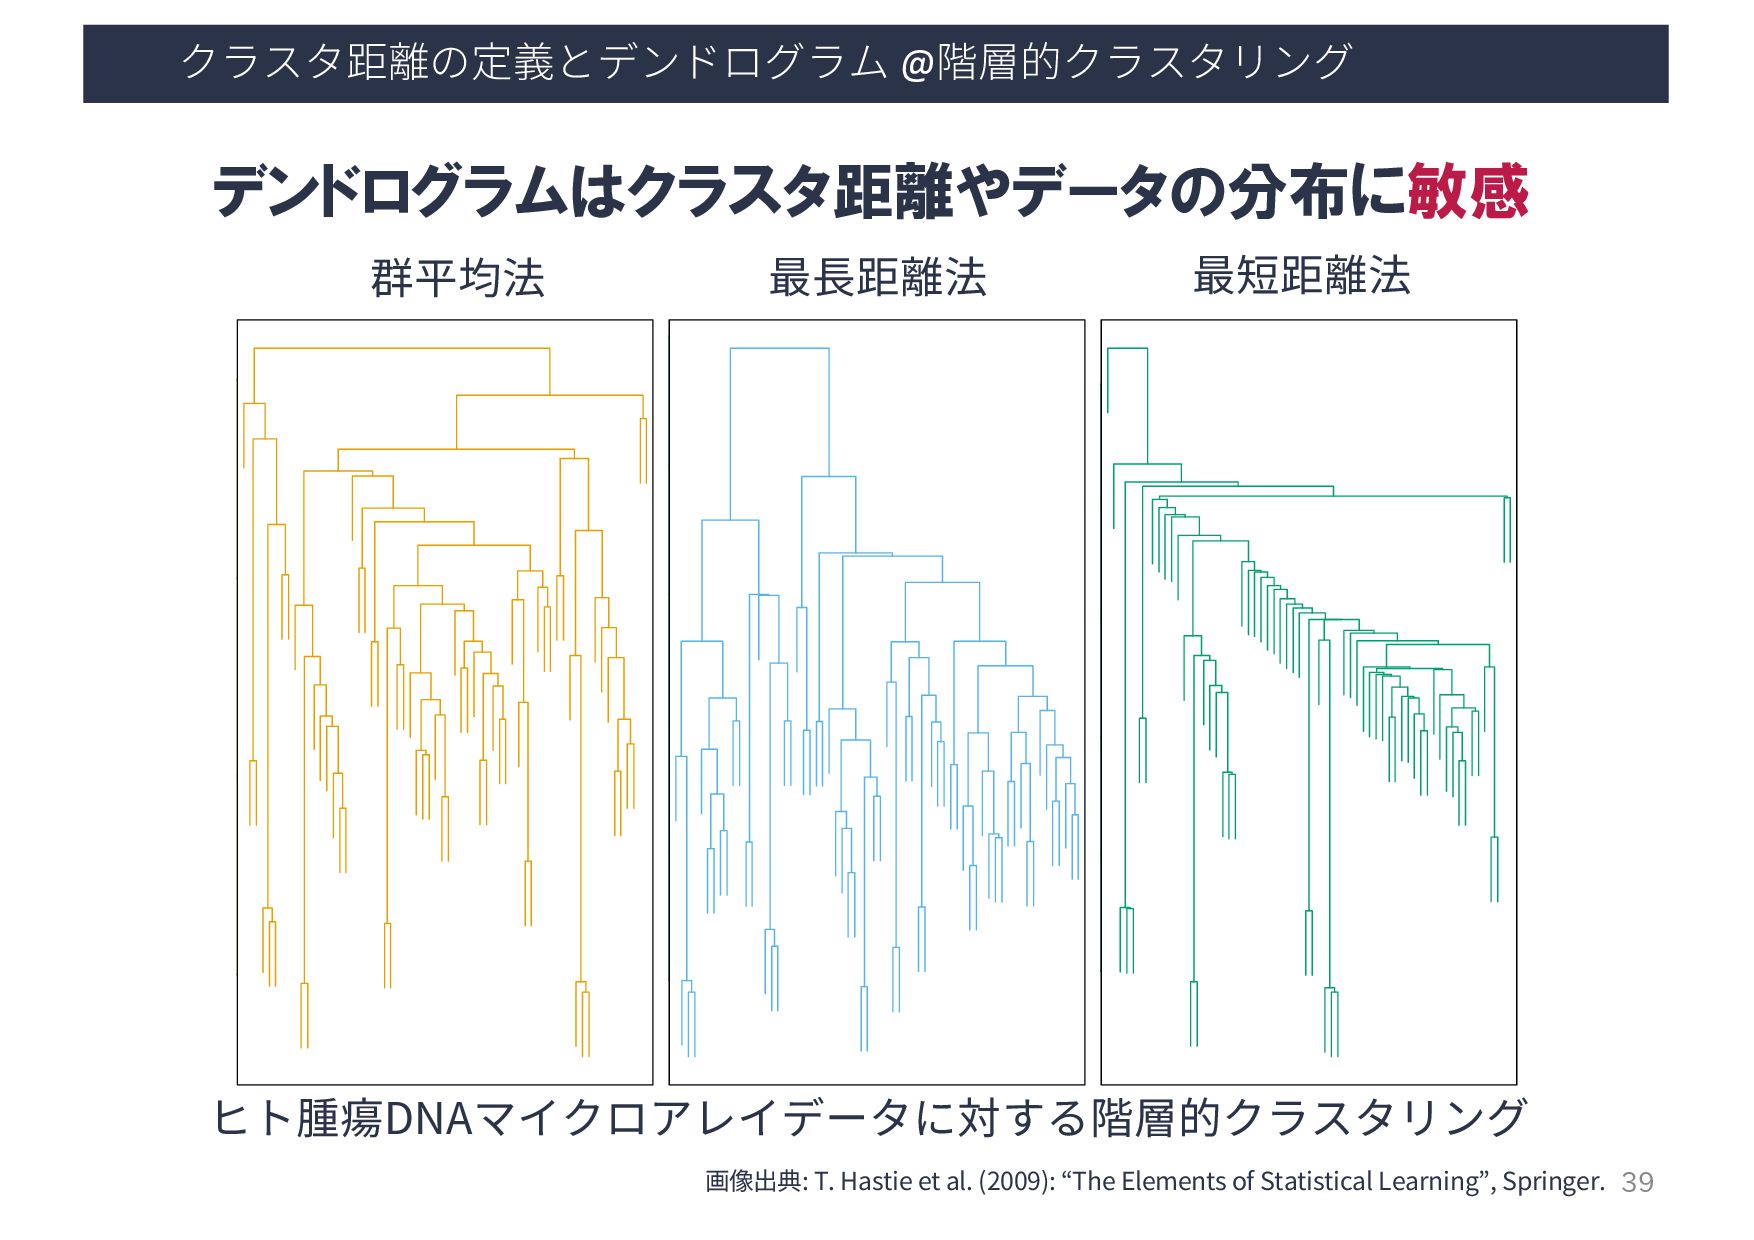
Linkage Single Linkage FIGURE 14.13. Dendrograms from agglomerative hierarchical clustering of hu- ヒト腫瘍DNAマイクロアレイデータに対する階層的クラスタリング 群平均法 最⻑距離法 最短距離法 デンドログラムはクラスタ距離やデータの分布に敏感 画像出典: T. Hastie et al. (2009): “The Elements of Statistical Learning”, Springer.
![クラスタリング2 密度ベースクラスタリング & クラスタリングの実用上の問題 ⼭本 祐輔 名古屋市⽴⼤学 データサイエンス研究科 [email protected] 第5回](https://files.speakerdeck.com/presentations/0660ca7ba16d4f039505765add8e74df/slide_0.jpg)