Upgrade to Pro
— share decks privately, control downloads, hide ads and more …
Speaker Deck
Features
Speaker Deck
PRO
Sign in
Sign up for free
Search
Search
Xdebug / debugging PHP applications (WebElement...
Search
Vladimír Kriška
December 08, 2011
Programming
300
0
Share
Embed
Copy iframe code
Copy JS code
Copy link
Start on current slide
Xdebug / debugging PHP applications (WebElement #2)
Vladimír Kriška
December 08, 2011
More Decks by Vladimír Kriška
See All by Vladimír Kriška
Twelve-Factor app with Docker
ujovlado
0
180
Design a REST API you will love to work with
ujovlado
0
810
Docker for PHP developers - Tips, Tricks & Lessons learned
ujovlado
3
520
Docker ‐ from development to production in minutes (PoSobota #91)
ujovlado
0
430
Non-traditional use of Docker (Nette Camp #3)
ujovlado
0
190
Contributions [lightning talk] (PyconCZ 2015)
ujovlado
0
140
CSS Flexbox (WebElement #35)
ujovlado
0
200
Simplify your dev life with Docker (WebElement Banská Bystrica)
ujovlado
0
200
Don't underestimate CSS (WebElement #30)
ujovlado
0
640
Other Decks in Programming
See All in Programming
Welcome to the "Parametricity" 🏙️ − Generic だけど Specific な世界 −
guvalif
1
110
20260623_Loop Engineeringで自分の分身の問い合わせBotを作る
ryugen04
0
130
SREは、MCPとSRE Agentをこう使え!
kazumax55
0
140
AIエージェントで 変わるAndroid開発環境
takahirom
1
430
Webフレームワークの ベンチマークについて
yusukebe
0
200
AI駆動開発を妨げる技術的負債の解消アプローチ / ai-refactoring-approach
minodriven
17
8.7k
フィードバックで育てるAI開発
kotaminato
1
100
任せる範囲はこう広がった / How the Scope of AI Delegation Has Expanded
nrslib
1
240
Vue × Nuxt × Oxc どこまで使える?実運用の現在地
andpad
0
360
1B+ /day規模のログを管理する技術
broadleaf
0
130
分散システム、なんですぐ死んでしまうん?耐障害性を高めたいあなたのためのレジリエンスパターン入門
mshibuya
7
3.8k
キャリア迷子上等 ─ "ない道"は自分で作ればいい
16bitidol
3
2.8k
Featured
See All Featured
Site-Speed That Sticks
csswizardry
13
1.2k
Side Projects
sachag
455
43k
StorybookのUI Testing Handbookを読んだ
zakiyama
31
6.8k
Docker and Python
trallard
47
3.9k
Jess Joyce - The Pitfalls of Following Frameworks
techseoconnect
PRO
1
180
Mozcon NYC 2025: Stop Losing SEO Traffic
samtorres
1
270
A Guide to Academic Writing Using Generative AI - A Workshop
ks91
PRO
1
340
Visual Storytelling: How to be a Superhuman Communicator
reverentgeek
2
590
Six Lessons from altMBA
skipperchong
29
4.3k
How STYLIGHT went responsive
nonsquared
100
6.2k
The Hidden Cost of Media on the Web [PixelPalooza 2025]
tammyeverts
2
340
Lessons Learnt from Crawling 1000+ Websites
charlesmeaden
PRO
1
1.3k
Transcript
Xdebug debugging PHP applications WebElement event #2, 08.12.2011 Vladimír Kriška,
@ujovlado
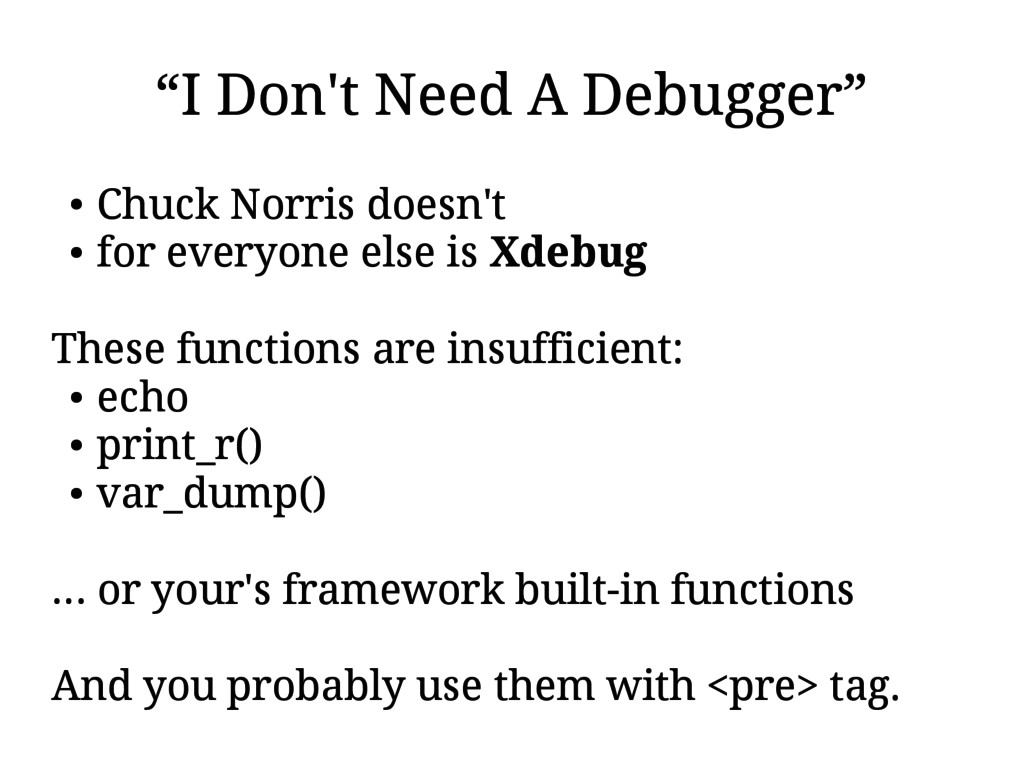
“I Don't Need A Debugger” • Chuck Norris doesn't •
for everyone else is Xdebug These functions are insufficient: • echo • print_r() • var_dump() … or your's framework built-in functions And you probably use them with <pre> tag.
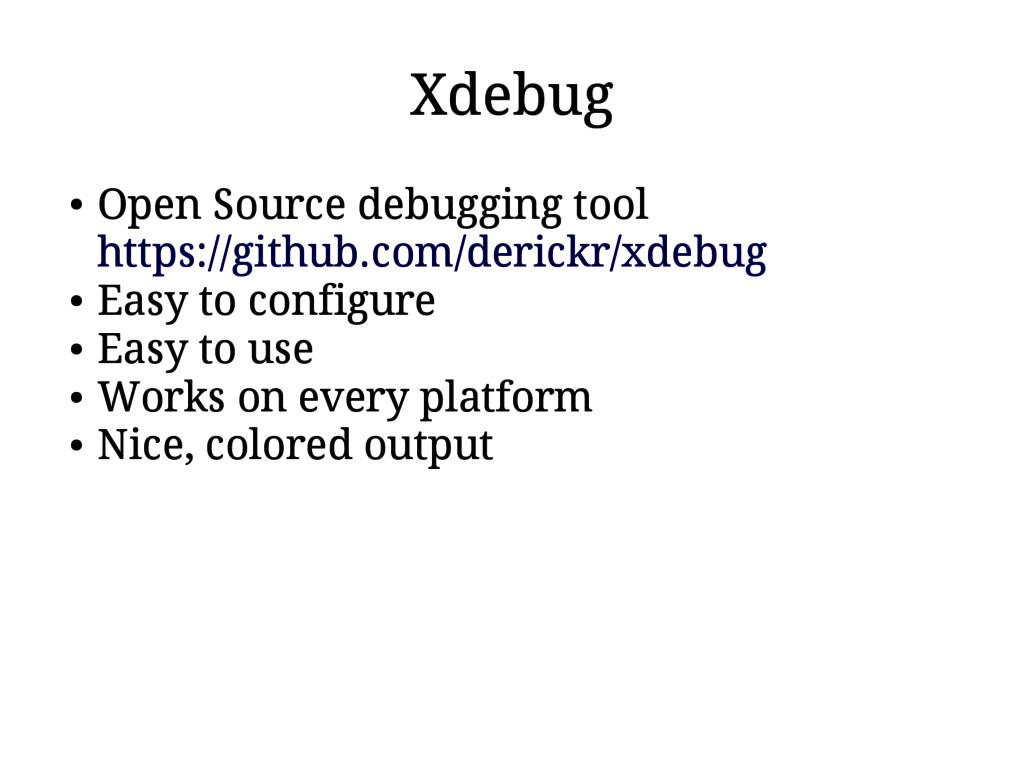
Xdebug • Open Source debugging tool https://github.com/derickr/xdebug • Easy to
configure • Easy to use • Works on every platform • Nice, colored output
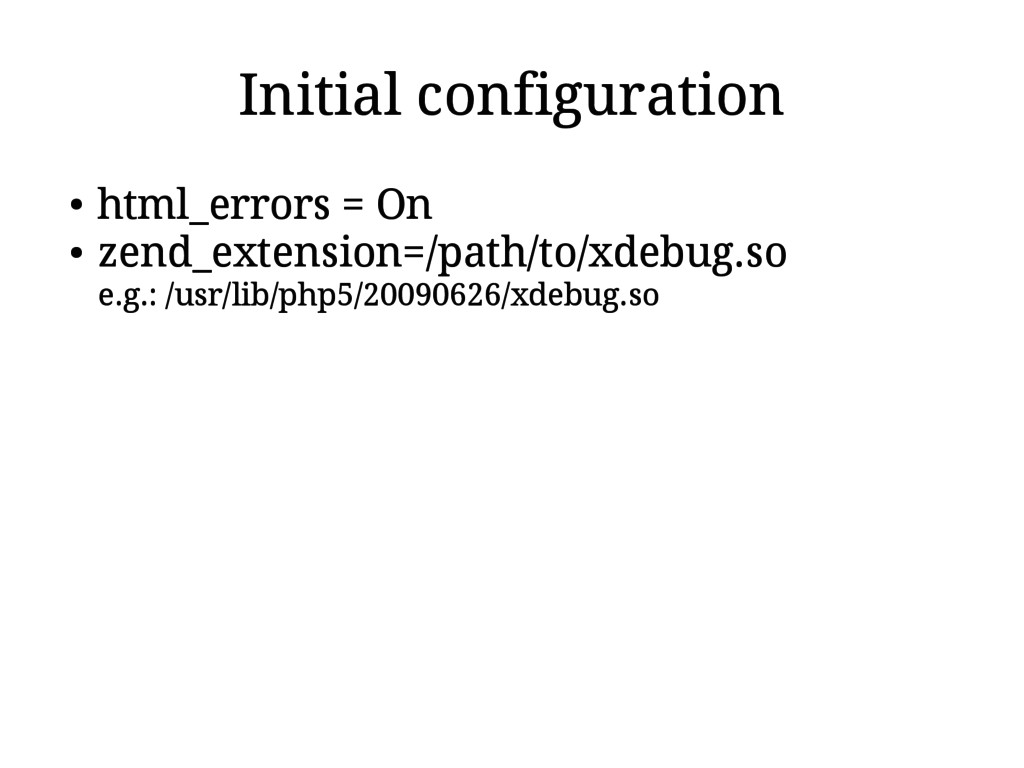
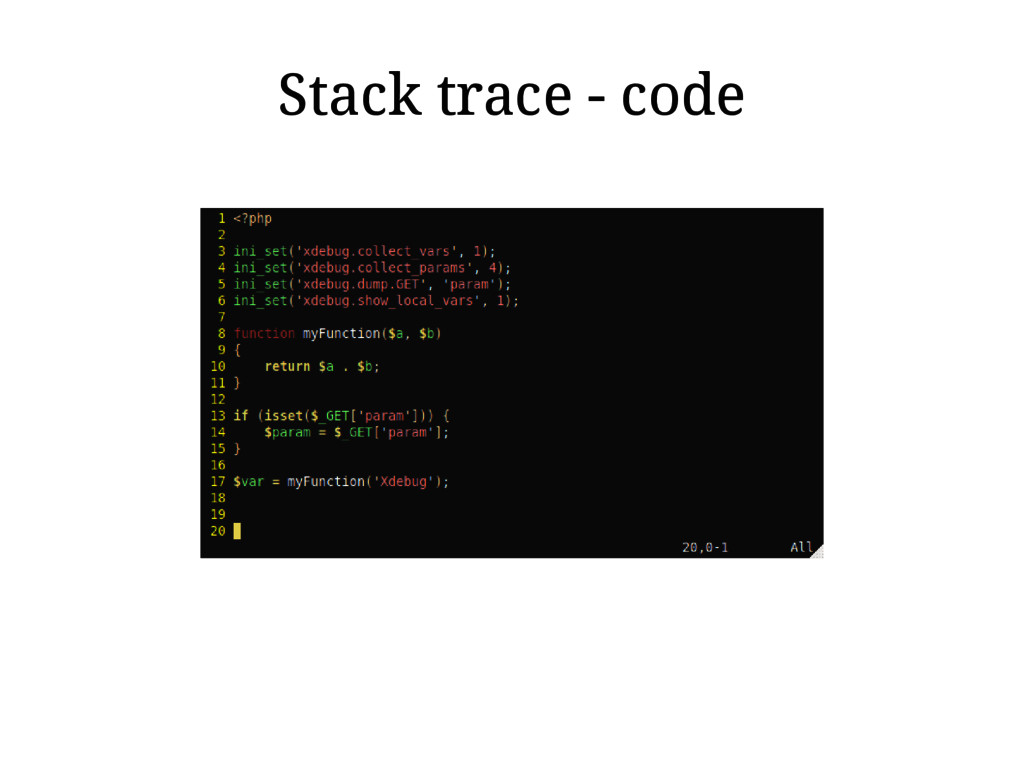
Initial configuration • html_errors = On • zend_extension=/path/to/xdebug.so e.g.: /usr/lib/php5/20090626/xdebug.so
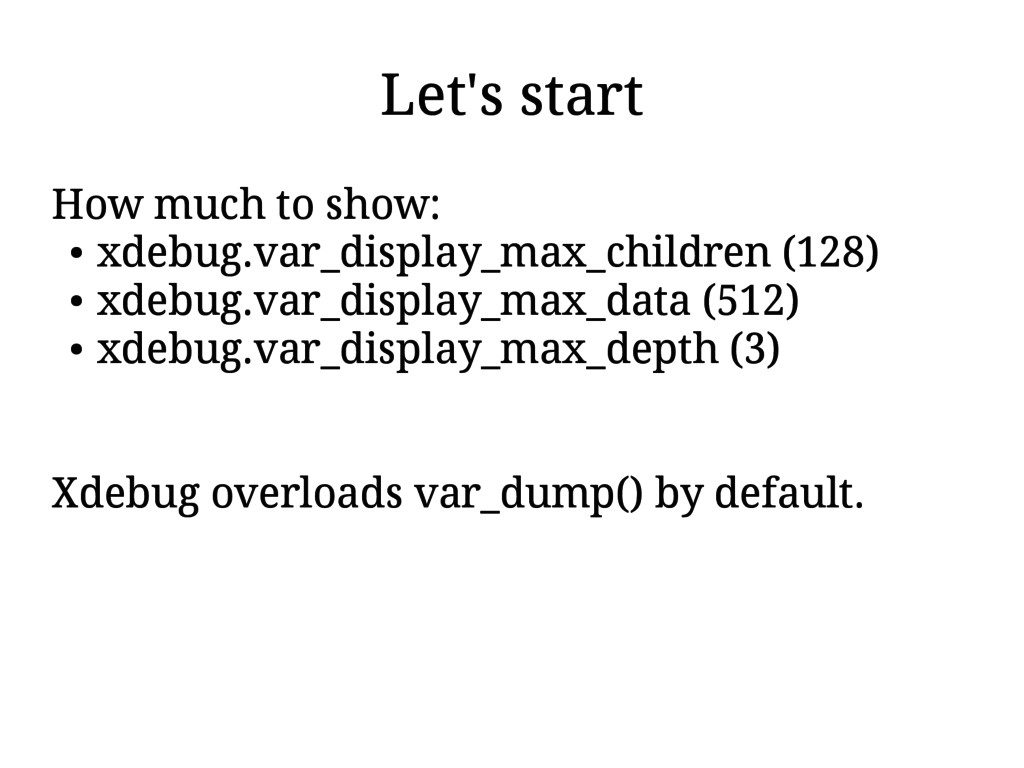
Let's start How much to show: • xdebug.var_display_max_children (128) •
xdebug.var_display_max_data (512) • xdebug.var_display_max_depth (3) Xdebug overloads var_dump() by default.
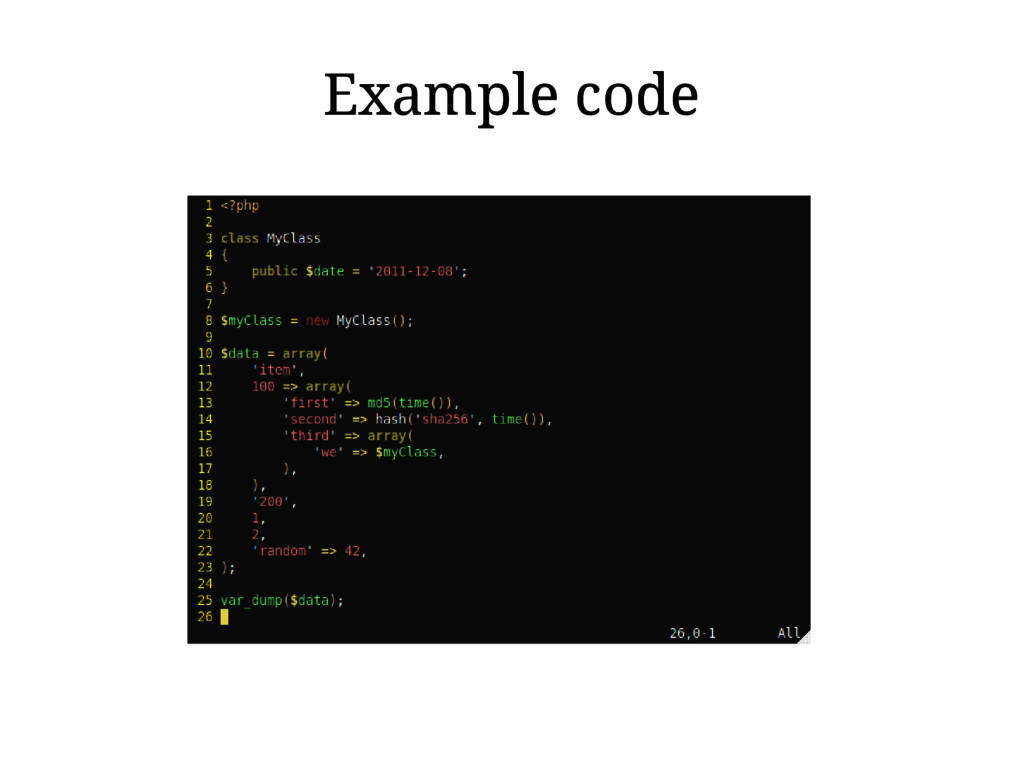
Example code
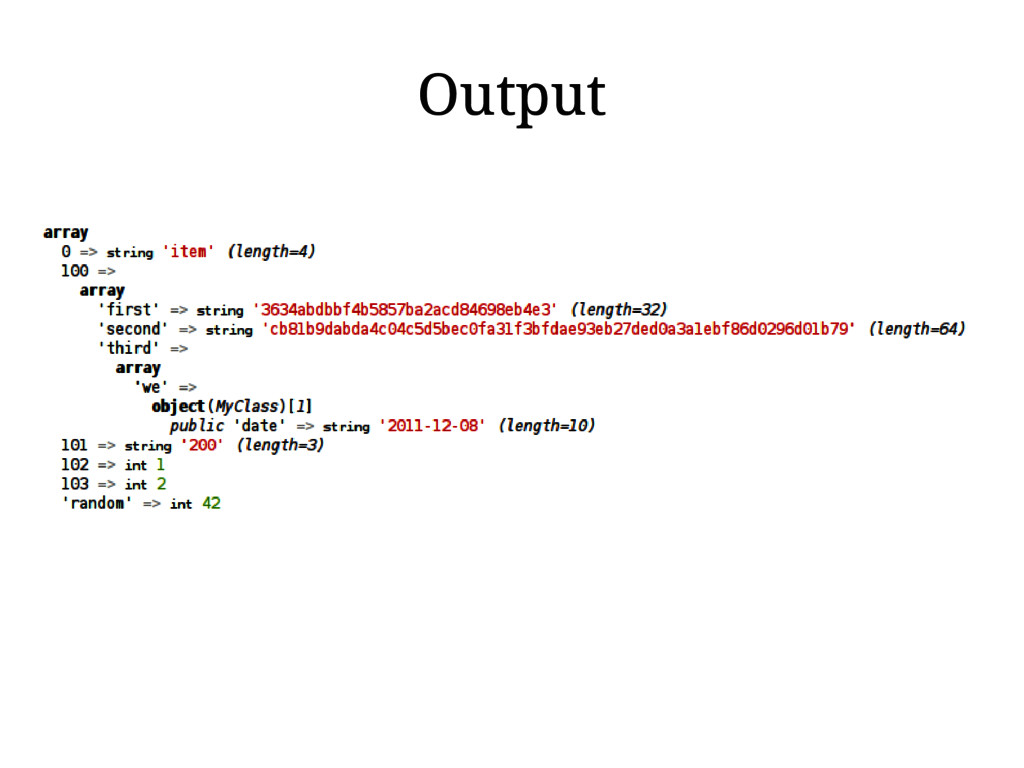
Output
Stack trace - code
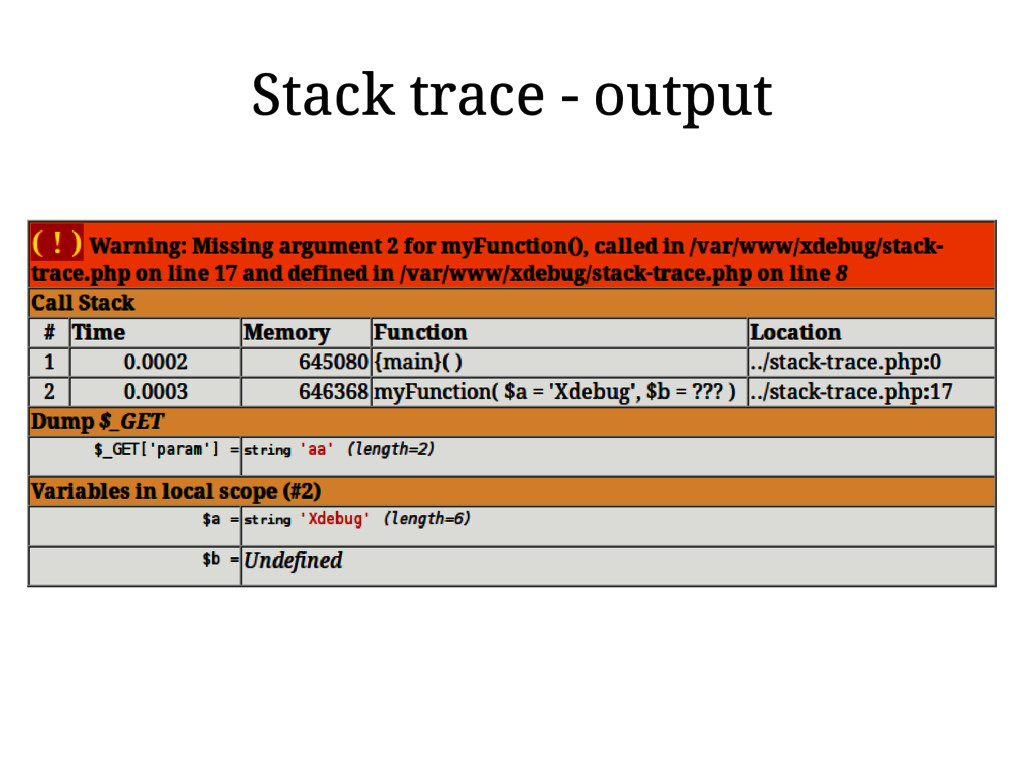
Stack trace - output
Function trace - code
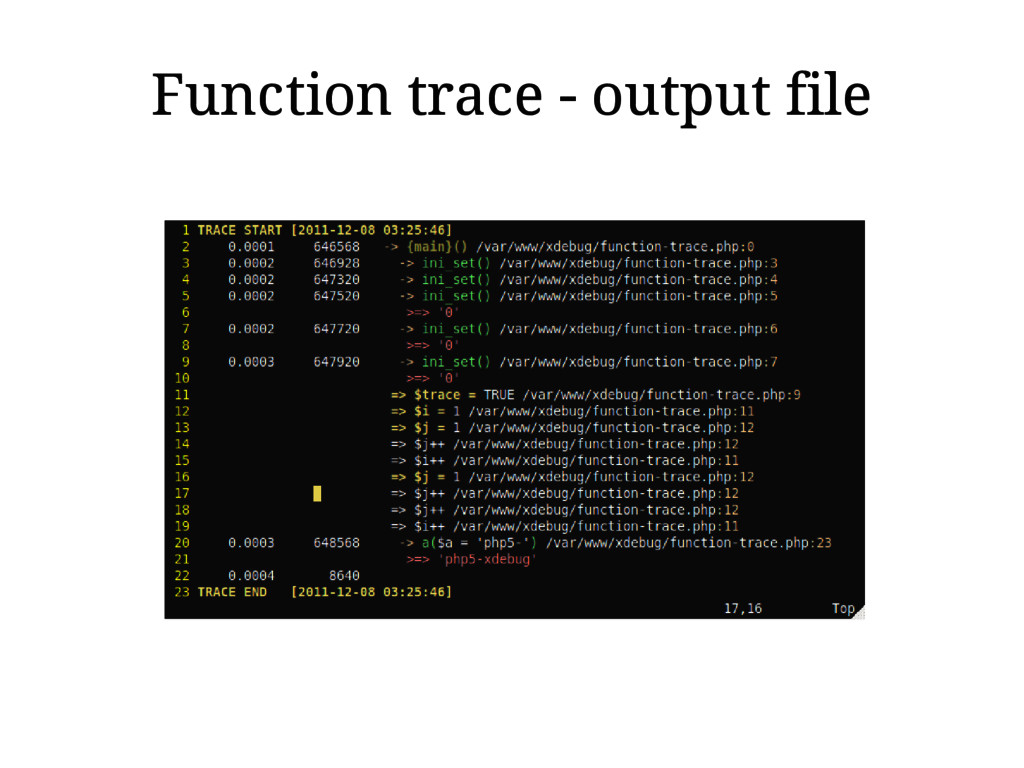
Function trace - output file
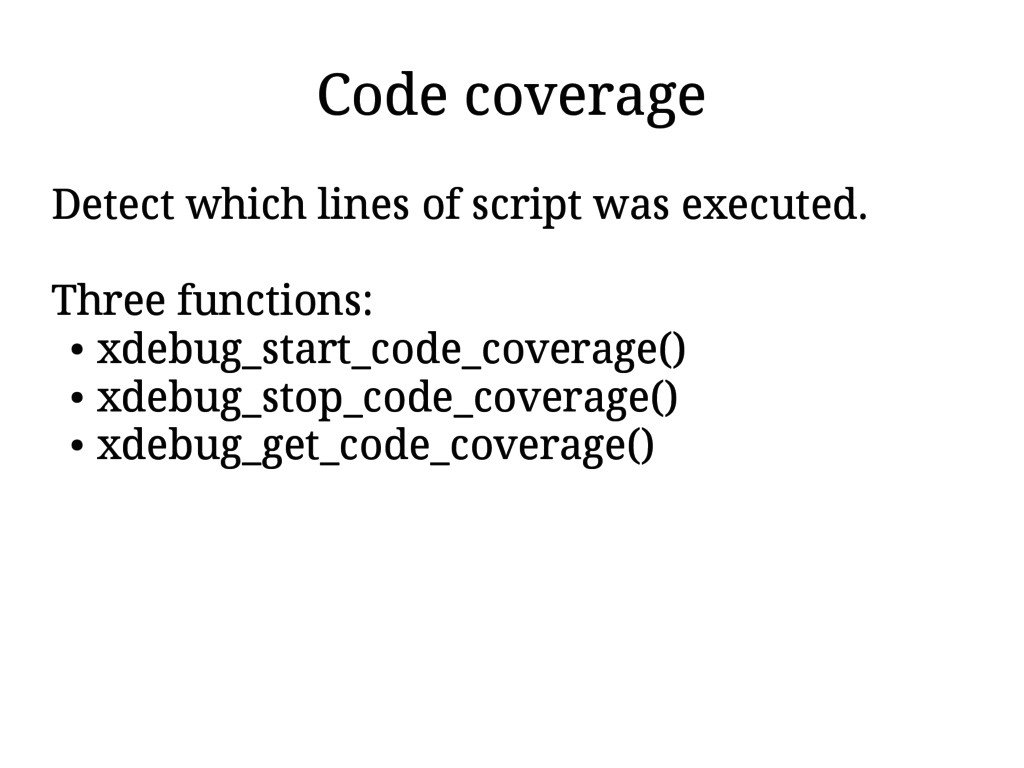
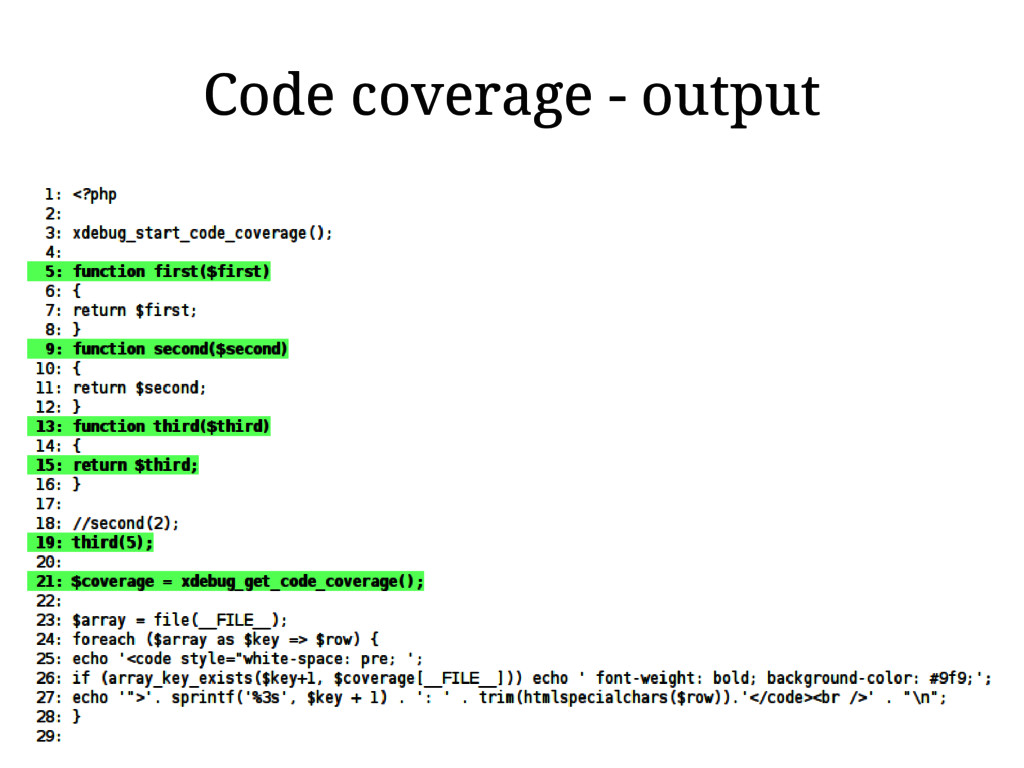
Code coverage Detect which lines of script was executed. Three
functions: • xdebug_start_code_coverage() • xdebug_stop_code_coverage() • xdebug_get_code_coverage()
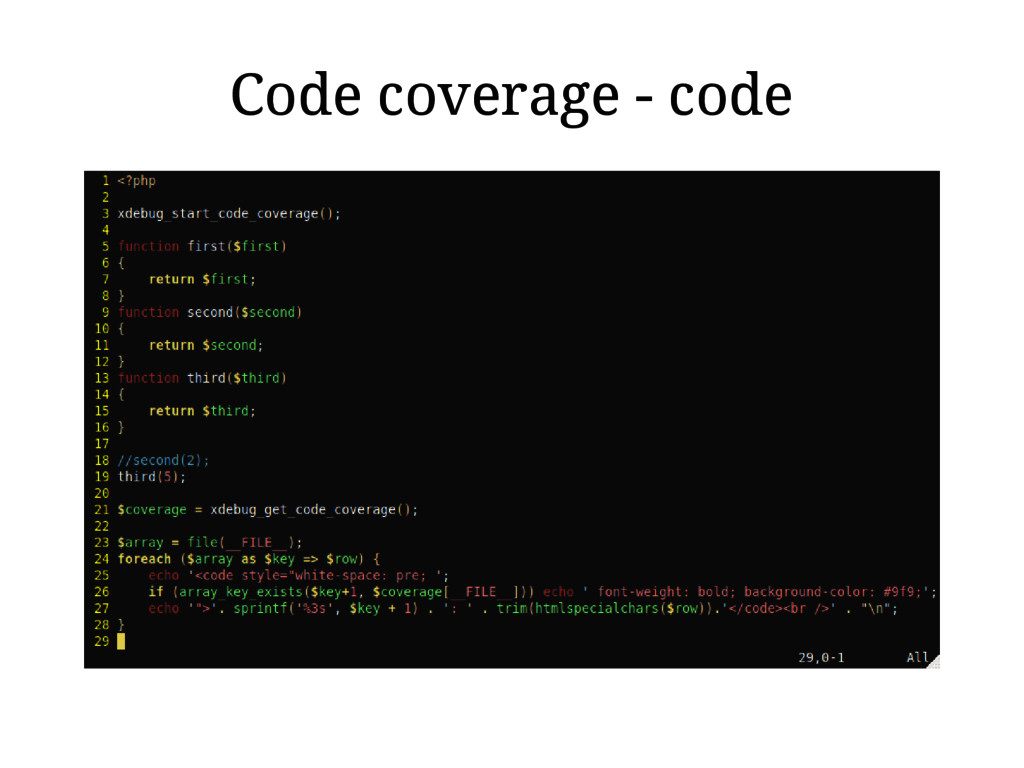
Code coverage - code
Code coverage - output
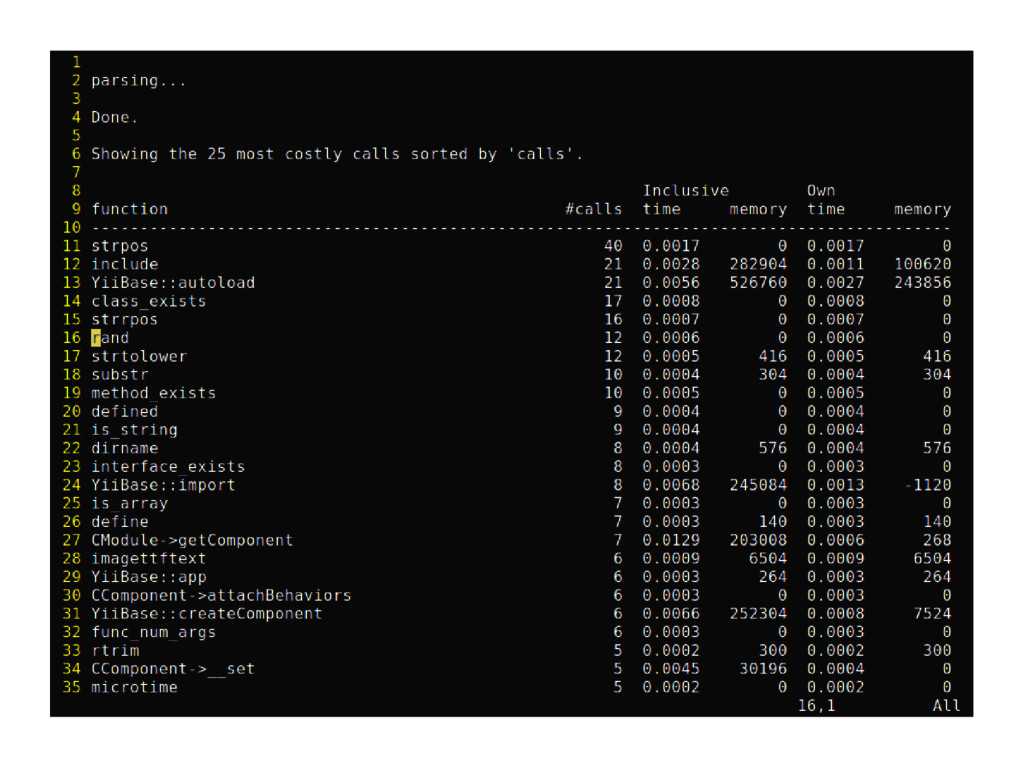
Tracefile analyser Set xdebug.trace_format=1 tracefile-analyser.php tracefile.xt [sortkey] [elements] Available sortkeys:
• calls • time-inclusive • memory-inclusive • time-own • memory-own
None
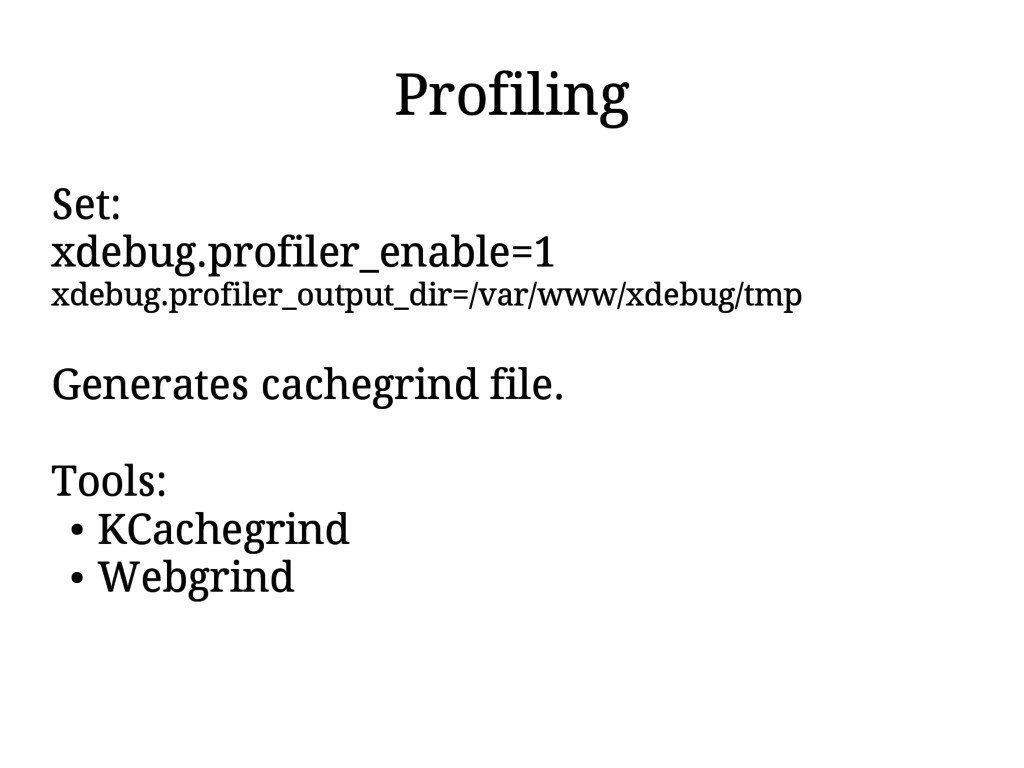
Profiling Set: xdebug.profiler_enable=1 xdebug.profiler_output_dir=/var/www/xdebug/tmp Generates cachegrind file. Tools: • KCachegrind
• Webgrind
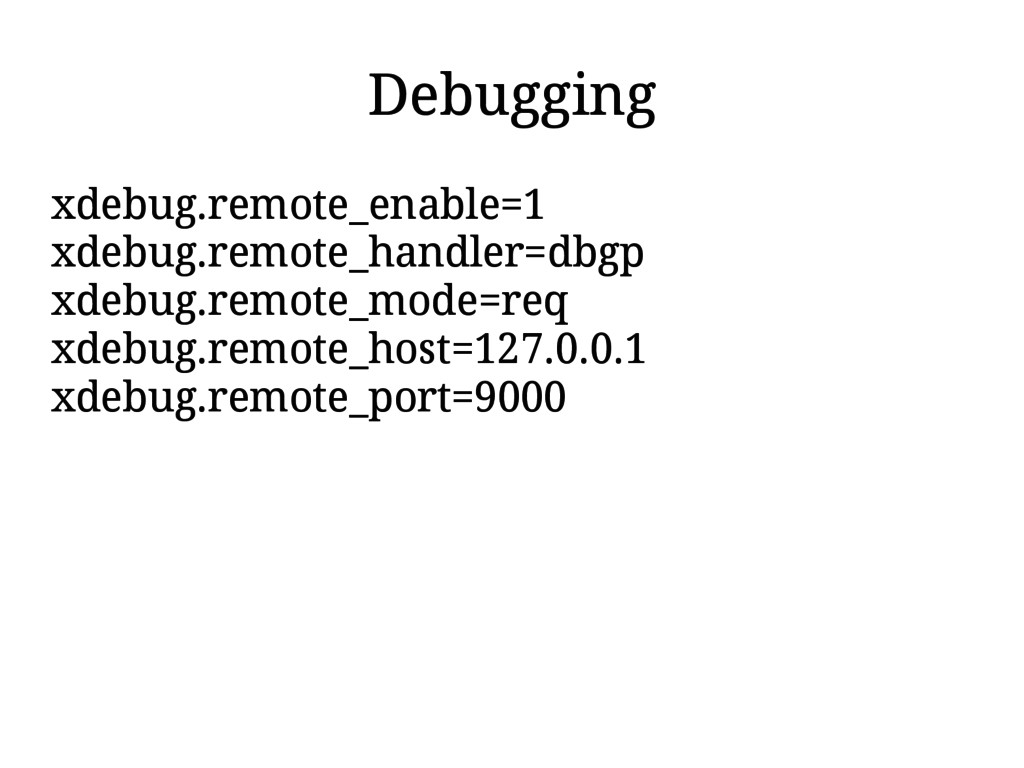
Debugging xdebug.remote_enable=1 xdebug.remote_handler=dbgp xdebug.remote_mode=req xdebug.remote_host=127.0.0.1 xdebug.remote_port=9000
“Scream” mode xdebug.scream=1 Set this to disable the “@” operator.
All errors, warnings and notices will be visible.
Some new features in 2.2 xdebug.cli_color - colored output in
CLI mode xdebug.coverage_enable - if you turn this off, it speeds up Xdebug, but coverage analysis won't work
Resources Xdebug home page - http://xdebug.org/ Derick Rethans - http://derickrethans.nl/
Thank you! Any questions?
![Tracefile analyser Set xdebug.trace_format=1 tracefile-analyser.php tracefile.xt [sortkey] [elements] Available sortkeys:](https://files.speakerdeck.com/presentations/76ea1e9c84024f968f7d29b637aded23/slide_14.jpg)