Upgrade to Pro — share decks privately, control downloads, hide ads and more …

Designing dashboards for a Sense of Control

Ann Wuyts
November 20, 2014

Designing dashboards for a Sense of Control

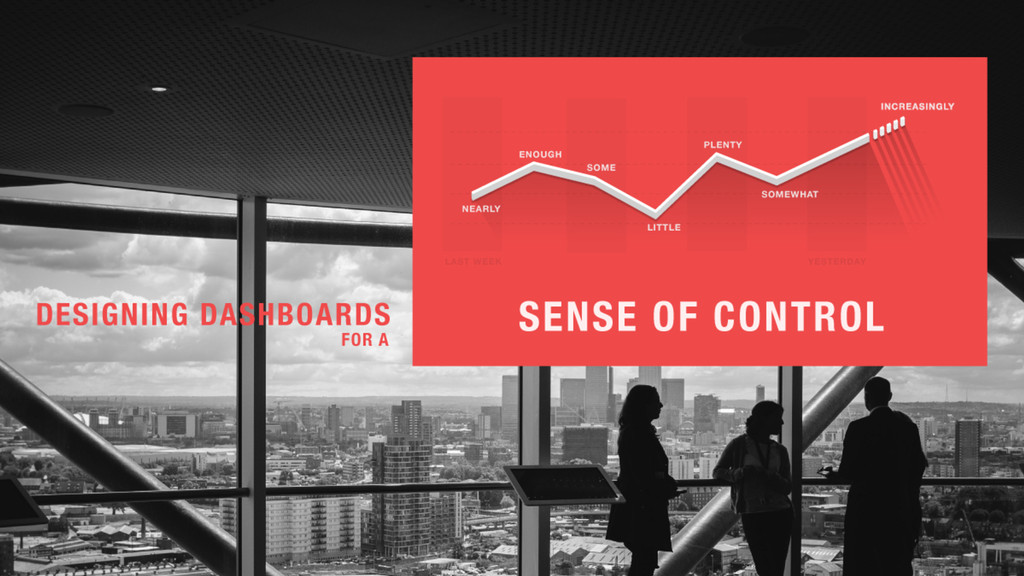
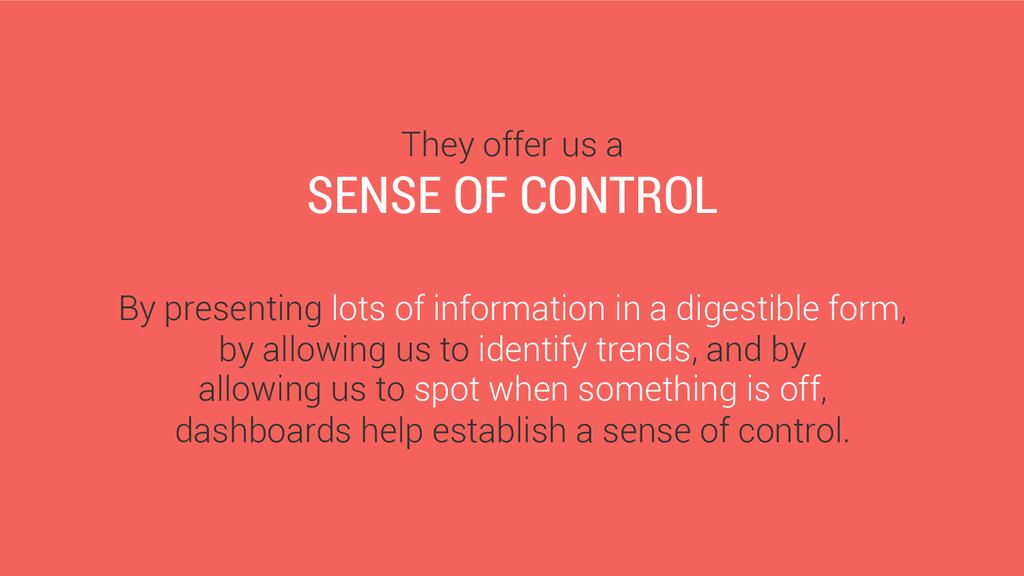
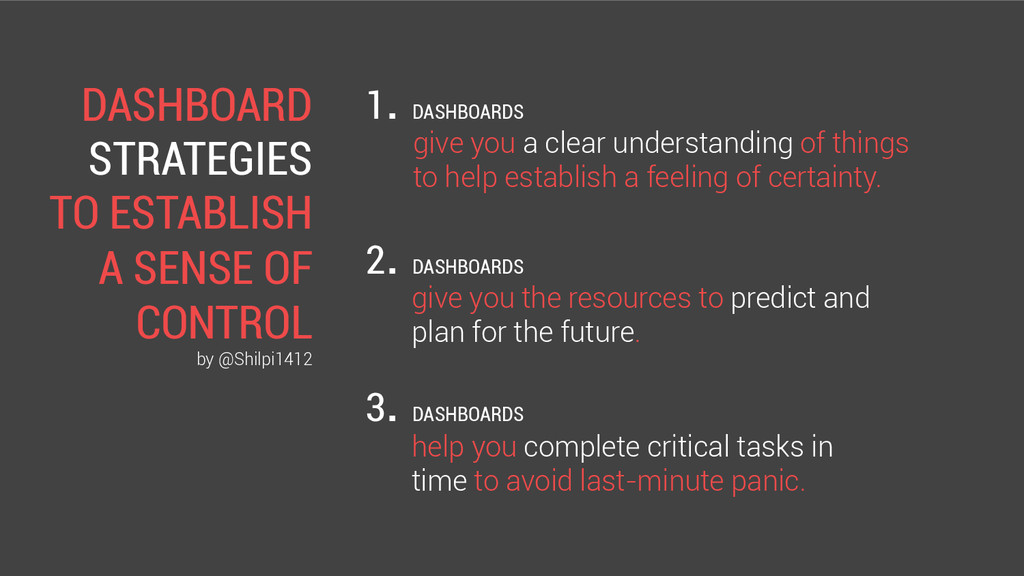
What makes dashboards so appealing to the human mind? We love dashboards because they help us establish a sense of control.

Good dashboard design offers this sense of control in three ways: it gives us a clear understanding of the current situation, the resources to predict and plan for the future, and it helps us complete critical tasks in time.

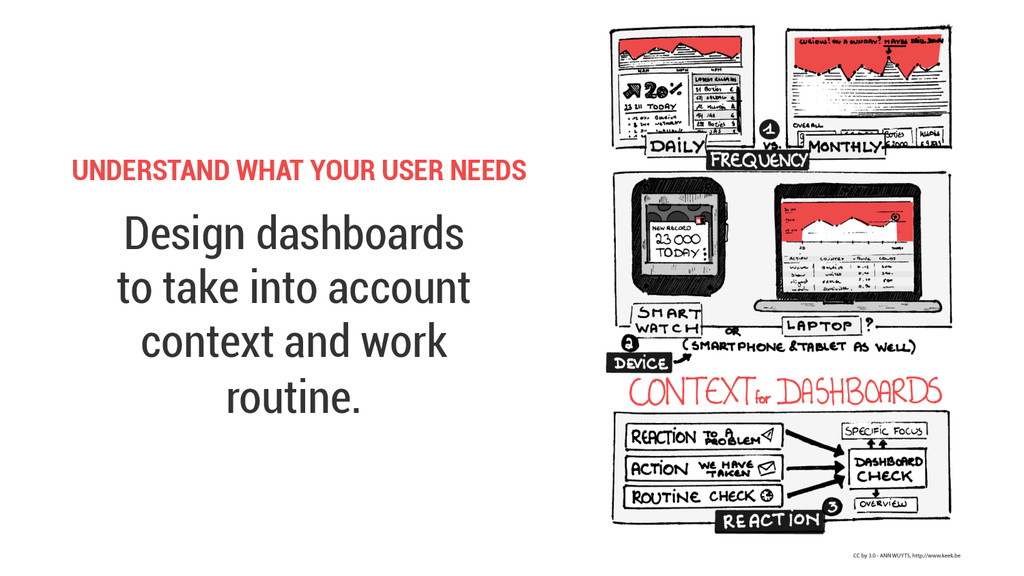
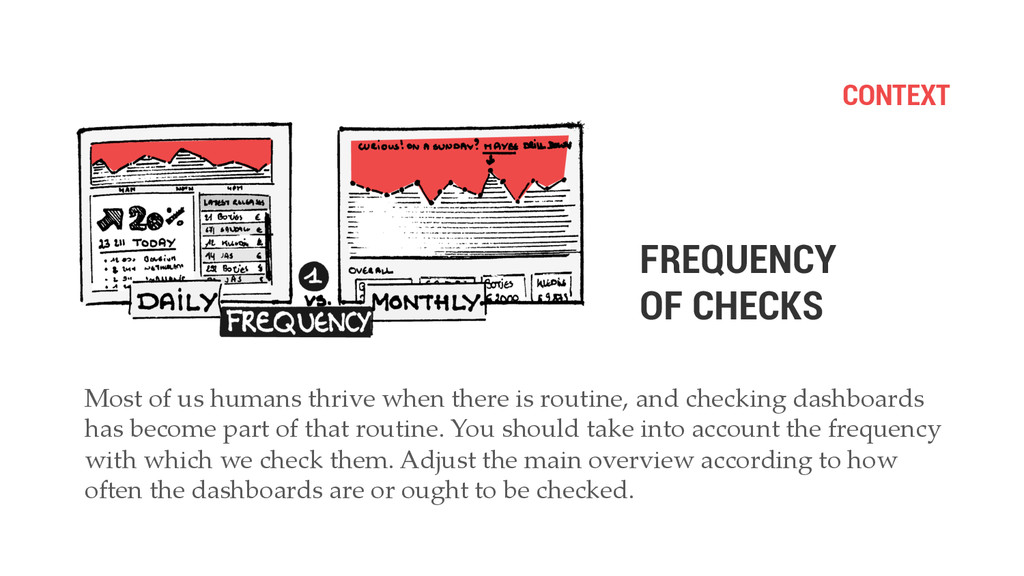
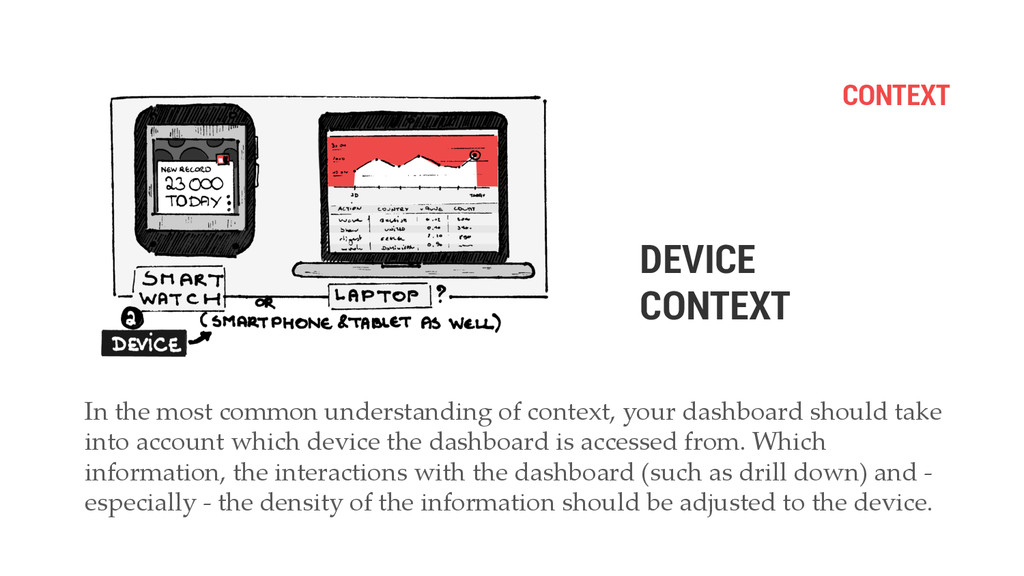
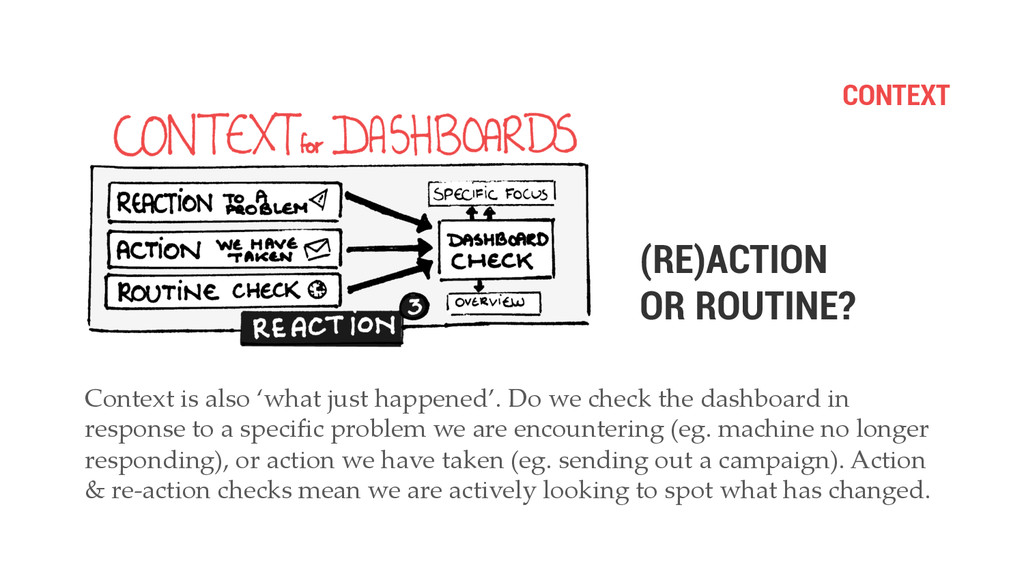
These, and the 'context' and work routine in which a dashboard will get used, are things not to loose sight of when working on dashboard functionality, UI and UX.

( This slideshow is a summary from the article on Dashboards & creating a Sense of Control at http://www.keek.be/2014/designing-dashboards-for-a-sense-of-control/ )

Ann Wuyts

November 20, 2014
Tweet

More Decks by Ann Wuyts

Other Decks in Design

Transcript

  1. They offer us a SENSE OF CONTROL By presenting lots

    of information in a digestible form, by allowing us to identify trends, and by allowing us to spot when something is off, dashboards help establish a sense of control.
  2. Need for Control is an evolutionary thing. CONTROL OF OUR

    ENVIRONMENT BETTER CHANCE AT SURVIVAL If we are in then we stand a (Hence, when feeling not in control, we tend to become stressed.)
  3. give you a clear understanding of things to help establish

    a feeling of certainty. give you the resources to predict and plan for the future. help you complete critical tasks in time to avoid last-minute panic. 3. DASHBOARDS 2. DASHBOARDS 1. DASHBOARDS DASHBOARD STRATEGIES TO ESTABLISH A SENSE OF CONTROL by @Shilpi1412
  4. Dashboards allow us to juggle more information than our brains

    can save, recall, process, compare, connect, .. at a given time.
  5. 1. DASHBOARDS GIVE YOU A CLEAR UNDERSTANDING OF THINGS TO

    HELP ESTABLISH A FEELING OF CERTAINTY
  6. UNDERSTANDING Our  dashboards  should  offer  us  the  same  reassurance  routine

     does.  We  look   at  operational  dashboards  for  confirmation  that  the  situation  is  in  hand.   Dashboards  should  be  designed  in  such  a  way,  that  at  a  glance,  people  can   be  certain  everything  is  normal. DESIGN FOR REASSURANCE
  7. UNDERSTANDING Operational  dashboards  also  have  a  'ʹwatchdog  role'ʹ.  If  something

     is  not   (numbers  are  up  or  down,  an  routine  event  that  normally  happens  but  did   not,  ..)  this  should  be  brought  to  our  aDention  immediately  and  actionably. WATCHDOG ROLE
  8. UNDERSTANDING Actionable  means  a  user  should  be  able  to  get

     further  information  on  the   deviation.  Take  them  directly  to  the  most  detailed  info  on  the  issue  at  hand   available,  so  they  can  understand.  From  there,  give  them  the  opportunity  to   zoom  out,  to  get  to  the  bigger  picture.  Become  a  user'ʹs  research  assistant. RESEARCH ASSISTANT
  9. PREDICT & PLAN •  For  operational  dashboards,  show  the  current

     trends. •  For  analytics  dashboards,  make  it  easy  to  compare  periods  or  events,  and   assist  the  user  in  identifying  paDerns  and  opportunities. •  Show  what  you  know  about  the  future.  We  need  to  plan  against  this   information. Where  there  are  limited  resources  remaining  (time,  budget,    ..)  or   a  goal  to  reach,  make  this  super  clear.
  10. PREDICT & PLAN External  factors,  such  as  the  weather  or

     actions  from  a  competitor  are   something  we  can  not  change,  although  we  might  be  able  to  anticipate  or   respond  to  it.  Internal  factors,  such  as  allocation  of  budget  or  timing,  we  can   adjust.   Whilst  we  need  to  be  aware  of  and  understand  the  external  factors,  build  a   dashboard  geared  towards  taking  action,  highlight  where  we  can  take   control  and  make  a  difference.   “Consider  visually  indicating   where  the  user  can  make  a   difference,  what  he  can  influence.”
  11. AVOID PANIC & CRITICAL TASKS •  Show  what  you  know

     about  the  future •  Highlight  information  that  warrants  action •  Allow  users  to  mark  future  stuff  as  'ʹmanaged'ʹ,  'ʹcovered'ʹ  or  'ʹunder   control'ʹ. Completion  of  outstanding  things  leads  to  a  sense  of  control  as  well  –  we  do   not  have  to  worry  about  them  anymore.  Give  people  room  to  annotate  (or   automatically  annotate,  if  you  have  the  info),  which  of  future  events  still  need   action  and  which  are  covered.
  12. PREDICT & PLAN Even  when  people  are  panicking,  good  design

     can  help  them  still.  They   need  to  find  information  as  quickly  as  possible,  and  consistency  in  your  data   hierarchy  will  make  that  they  instantly  know  where  and  how  to  check,  and   although  possible  they  won'ʹt  feel  in  control  regarding  the  situation,  they   will  at  least  feel  in  control  of  handling  your  dashboard.   For  more  frequently  occurring  "ʺpanic"ʺ  cases  in  your  industry,  you  can  offer   ‘prefab’  solutions  or  advice. “Even  when  people  are   panicking,  there  is  still  room     for  control.”
  13. CONTEXT Most  of  us  humans  thrive  when  there  is  routine,

     and  checking  dashboards   has  become  part  of  that  routine.  You  should  take  into  account  the  frequency   with  which  we  check  them.  Adjust  the  main  overview  according  to  how   often  the  dashboards  are  or  ought  to  be  checked. FREQUENCY OF CHECKS
  14. CONTEXT In  the  most  common  understanding  of  context,  your  dashboard

     should  take   into  account  which  device  the  dashboard  is  accessed  from.  Which   information,  the  interactions  with  the  dashboard  (such  as  drill  down)  and  -­‐‑   especially  -­‐‑  the  density  of  the  information  should  be  adjusted  to  the  device. DEVICE CONTEXT
  15. CONTEXT Context  is  also  ‘what  just  happened’.  Do  we  check

     the  dashboard  in   response  to  a  specific  problem  we  are  encountering  (eg.  machine  no  longer   responding),  or  action  we  have  taken  (eg.  sending  out  a  campaign).  Action   &  re-­‐‑action  checks  mean  we  are  actively  looking  to  spot  what  has  changed. (RE)ACTION OR ROUTINE?
  16. . ( yeey, you’ve made it to the end :-)

    Thanks  for  being  all  a0entive  and  such.  Now,  please  go  forth     and  make  some  kick-­‐‑ass  dashboards.  (Or  tweak  existing  ones  a  li0le  bit.) Have  a  look  at  the  full  article  on  www.keek.be,  if  you  like  to  read  some  more  on  dashboards  &   control.  If  you  have  dashboard-­‐‑design  advice  of  your  own  to  share,  or  constructive  critique   regarding  these  slides,  both  are  welcome  at  @vintfalken  or  [email protected].