What is good data visualisation. How do we apply best practises of data visualisation at scale? How do we make sure that all visualisations produced by your analytics team both look good and is effortless.
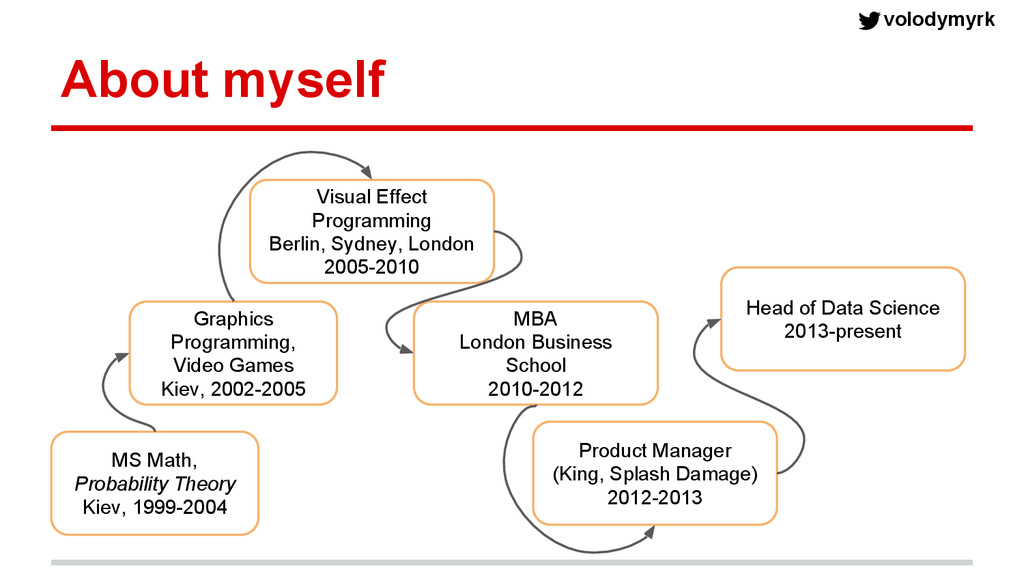
Programming, Video Games Kiev, 2002-2005 Visual Effect Programming Berlin, Sydney, London 2005-2010 MBA London Business School 2010-2012 Product Manager (King, Splash Damage) 2012-2013 Head of Data Science 2013-present
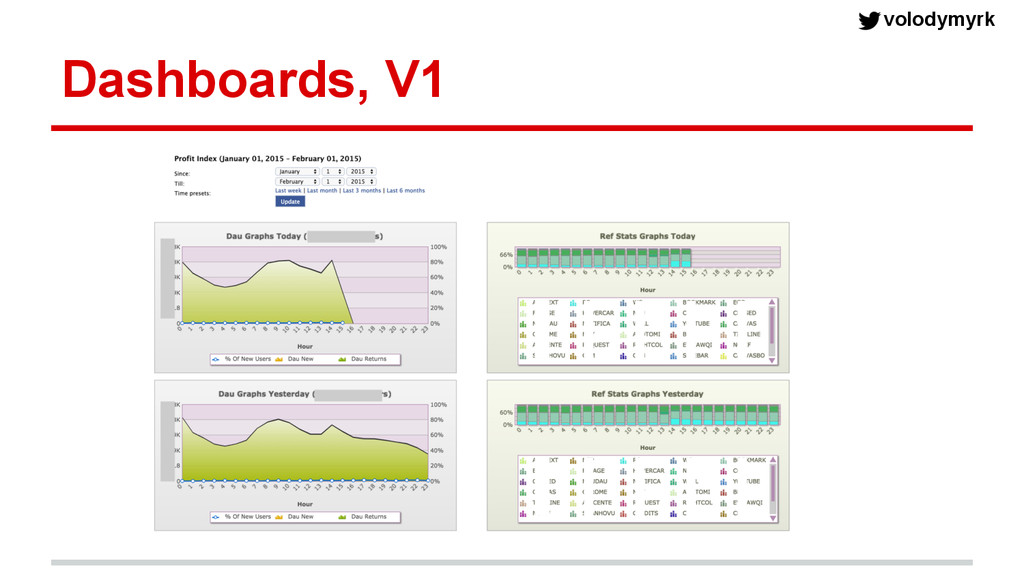
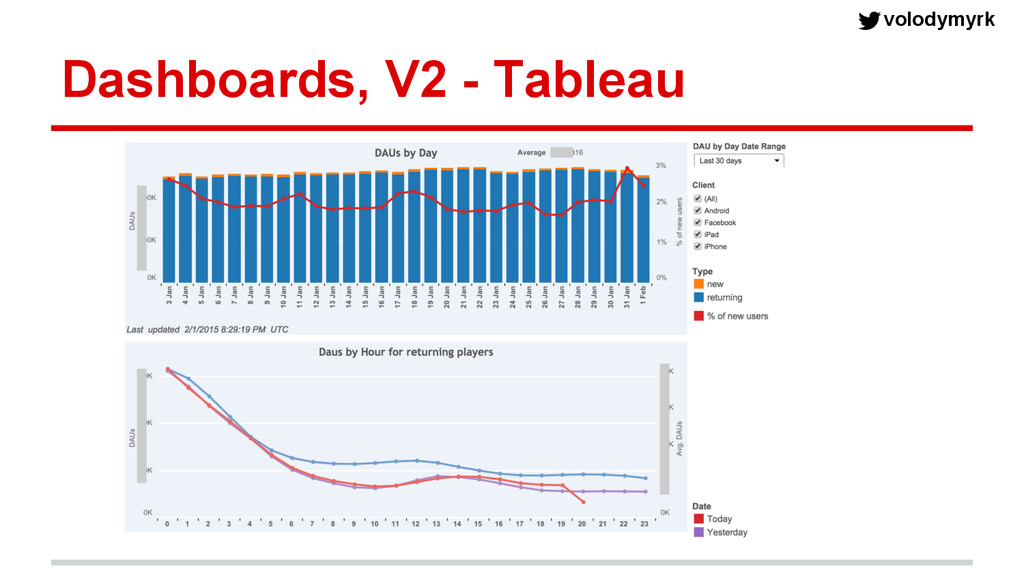
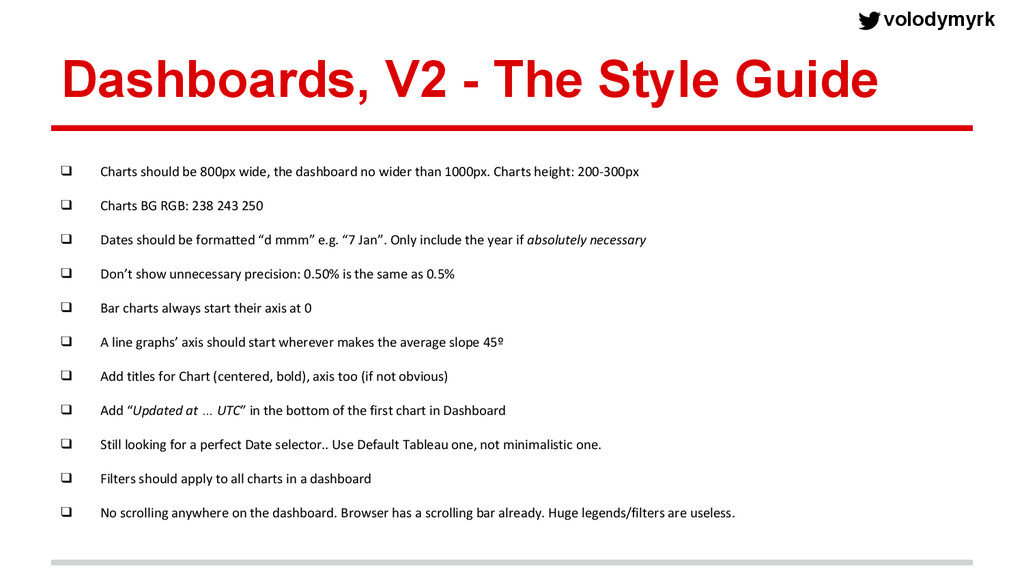
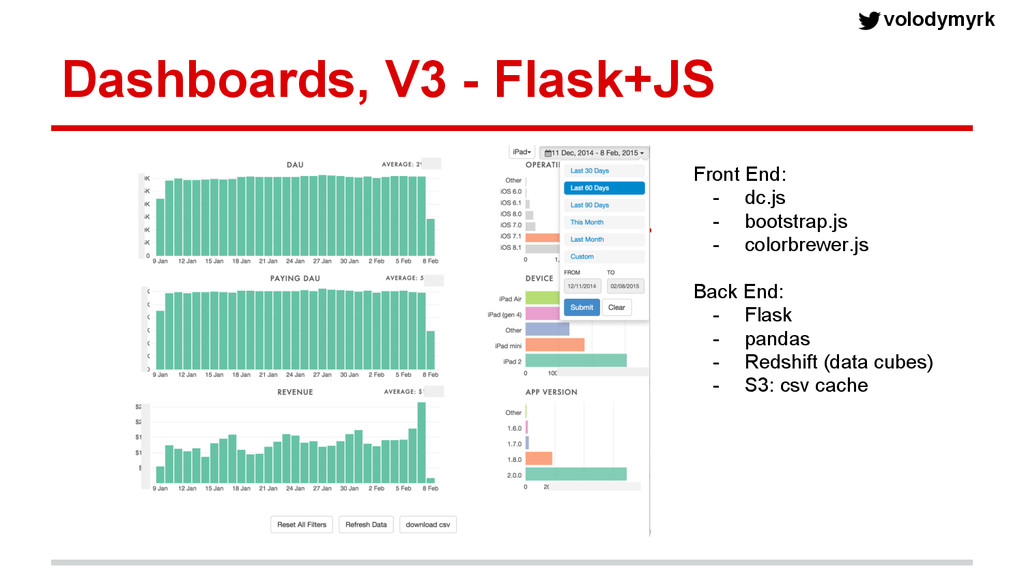
be 800px wide, the dashboard no wider than 1000px. Charts height: 200-300px ❑ Charts BG RGB: 238 243 250 ❑ Dates should be formatted “d mmm” e.g. “7 Jan”. Only include the year if absolutely necessary ❑ Don’t show unnecessary precision: 0.50% is the same as 0.5% ❑ Bar charts always start their axis at 0 ❑ A line graphs’ axis should start wherever makes the average slope 45º ❑ Add titles for Chart (centered, bold), axis too (if not obvious) ❑ Add “Updated at … UTC” in the bottom of the first chart in Dashboard ❑ Still looking for a perfect Date selector.. Use Default Tableau one, not minimalistic one. ❑ Filters should apply to all charts in a dashboard ❑ No scrolling anywhere on the dashboard. Browser has a scrolling bar already. Huge legends/filters are useless.
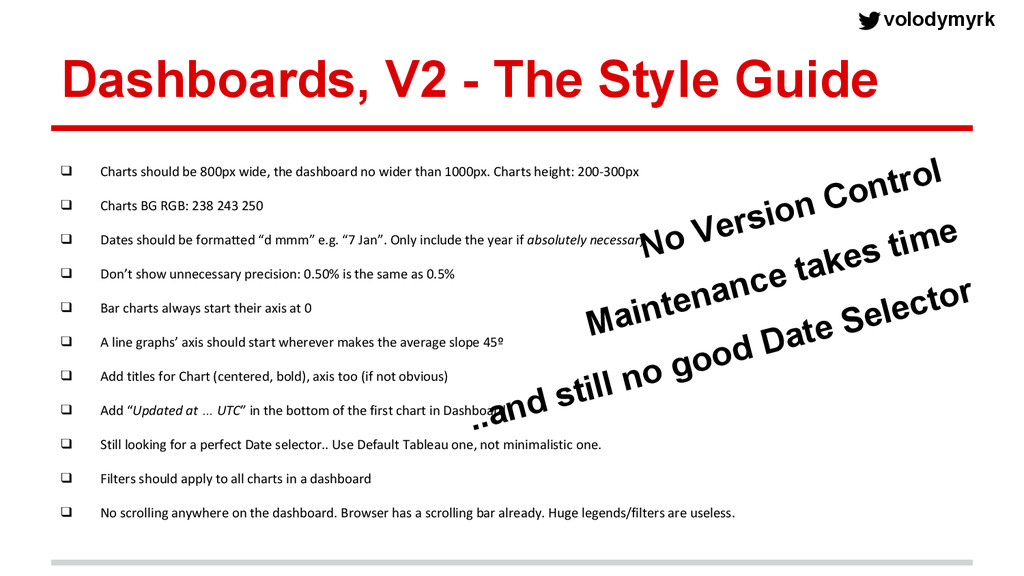
wider than 1000px. Charts height: 200-300px ❑ Charts BG RGB: 238 243 250 ❑ Dates should be formatted “d mmm” e.g. “7 Jan”. Only include the year if absolutely necessary ❑ Don’t show unnecessary precision: 0.50% is the same as 0.5% ❑ Bar charts always start their axis at 0 ❑ A line graphs’ axis should start wherever makes the average slope 45º ❑ Add titles for Chart (centered, bold), axis too (if not obvious) ❑ Add “Updated at … UTC” in the bottom of the first chart in Dashboard ❑ Still looking for a perfect Date selector.. Use Default Tableau one, not minimalistic one. ❑ Filters should apply to all charts in a dashboard ❑ No scrolling anywhere on the dashboard. Browser has a scrolling bar already. Huge legends/filters are useless. Dashboards, V2 - The Style Guide No Version Control Maintenance takes time ..and still no good Date Selector
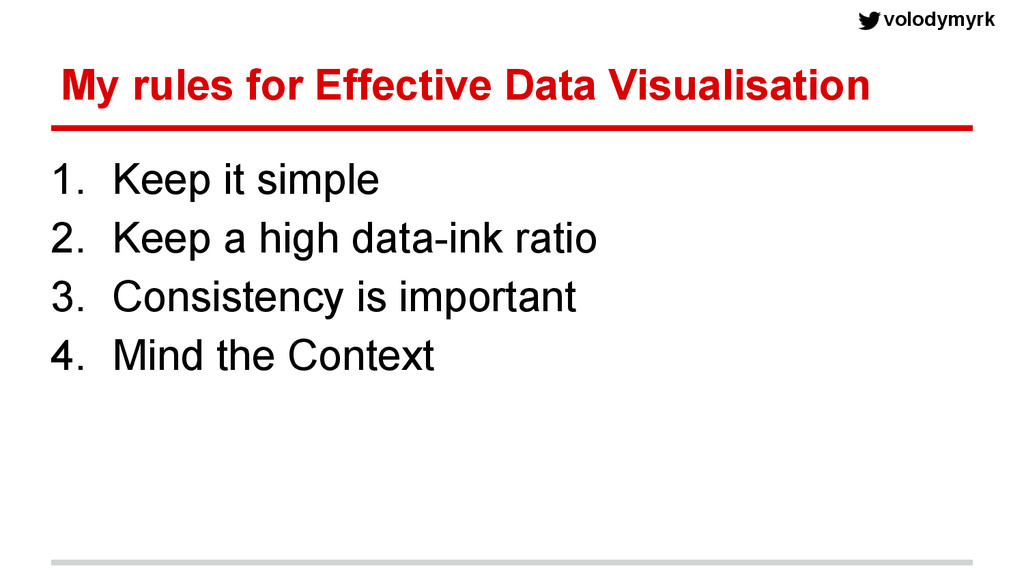
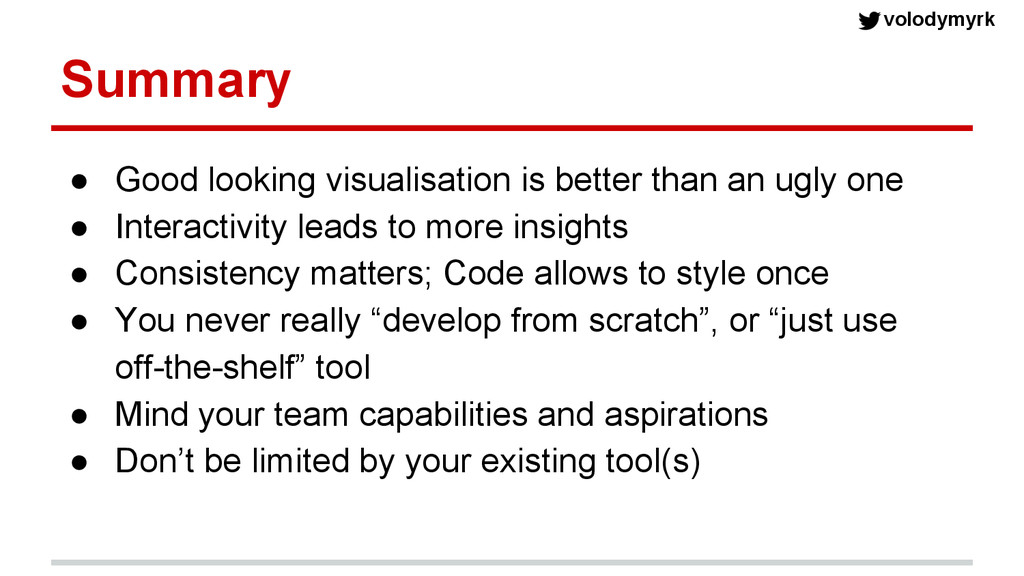
ugly one • Interactivity leads to more insights • Consistency matters; Code allows to style once • You never really “develop from scratch”, or “just use off-the-shelf” tool • Mind your team capabilities and aspirations • Don’t be limited by your existing tool(s)