Manager at King • MBA at London Business School • Visual Effect developer (Avatar, Batman, ...) • MSc in Probability (Kiev Uni, Ukraine) A quick bio Now 2004
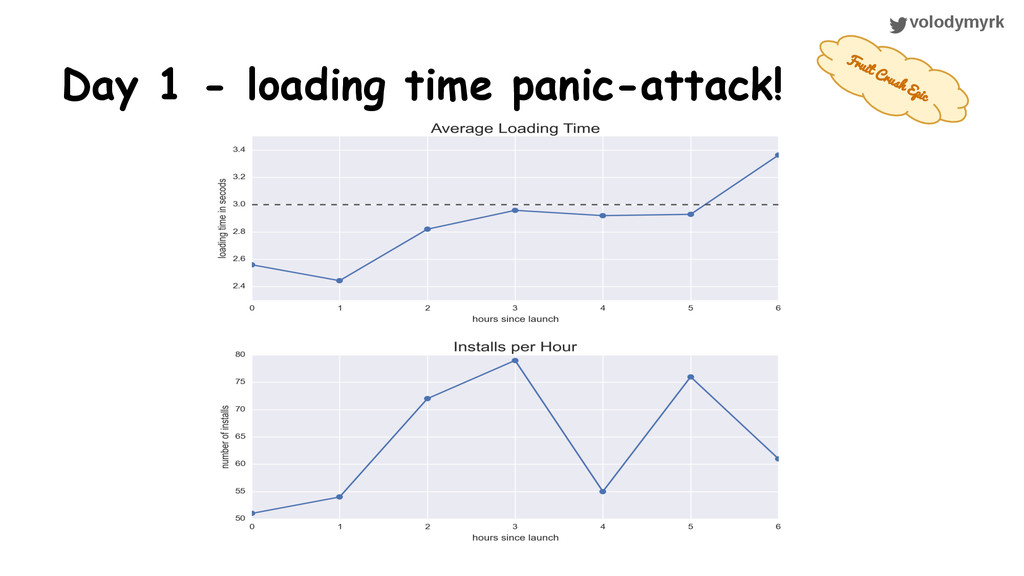
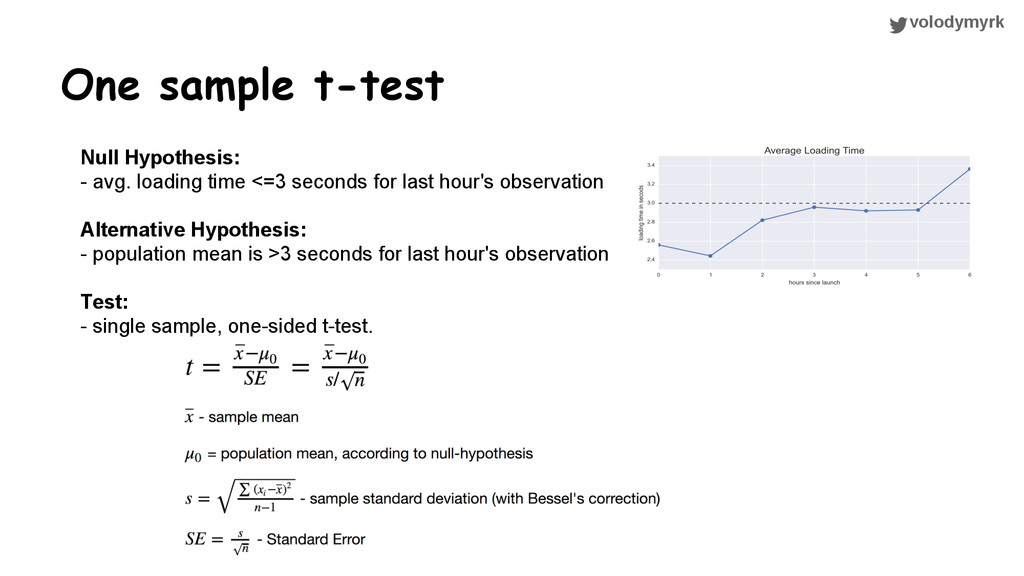
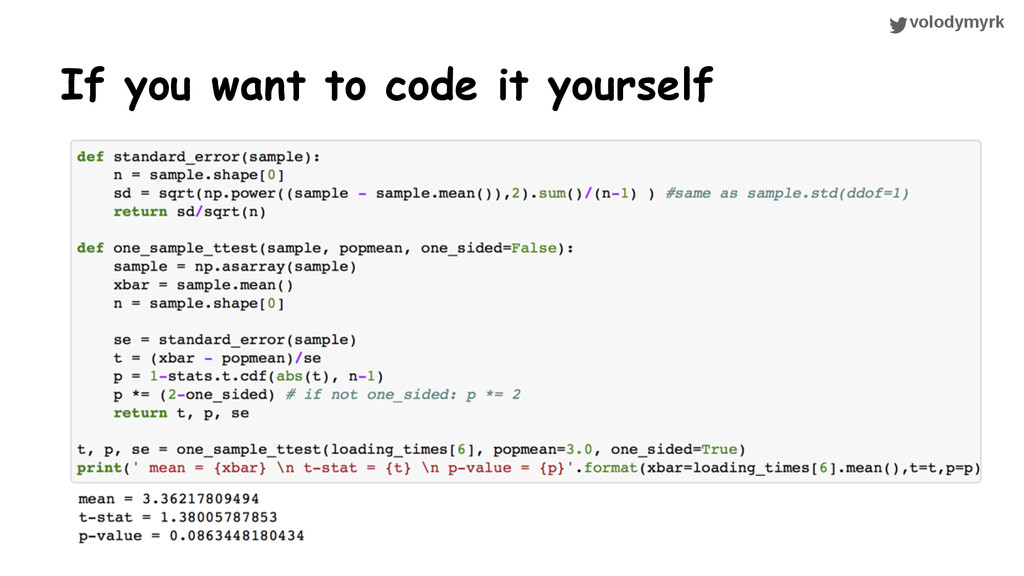
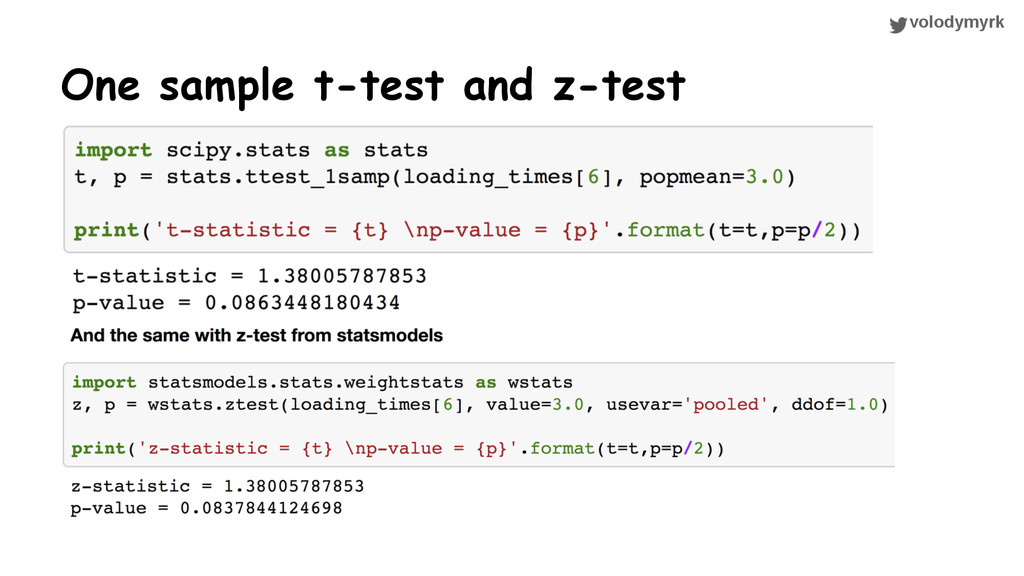
<=3 seconds for last hour's observation Alternative Hypothesis: - population mean is >3 seconds for last hour's observation Test: - single sample, one-sided t-test.
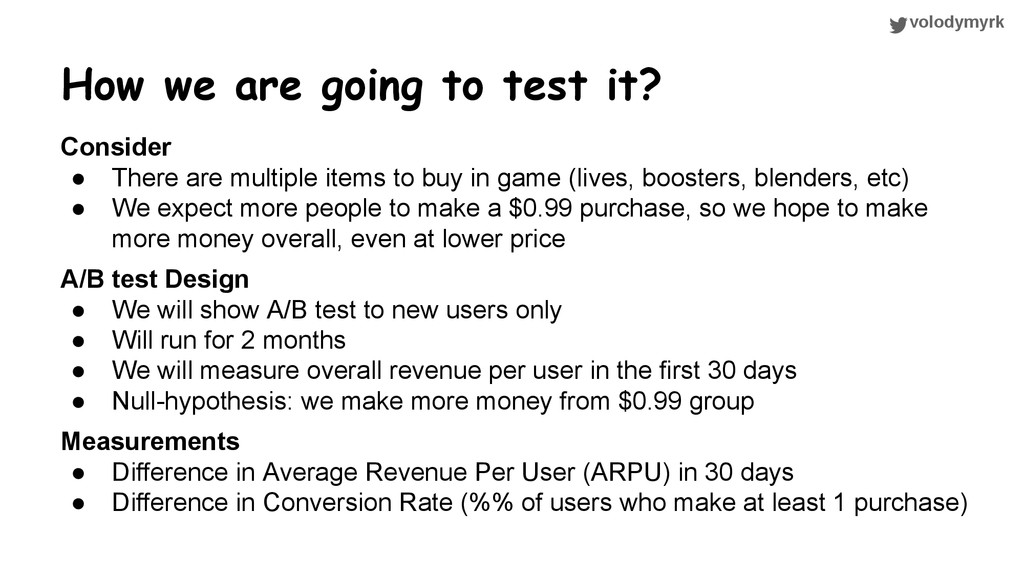
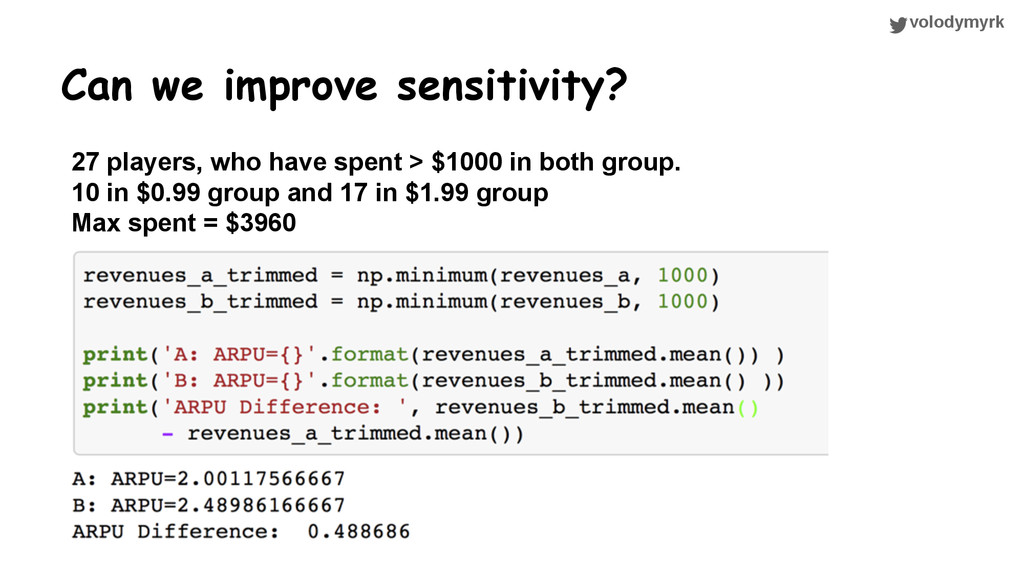
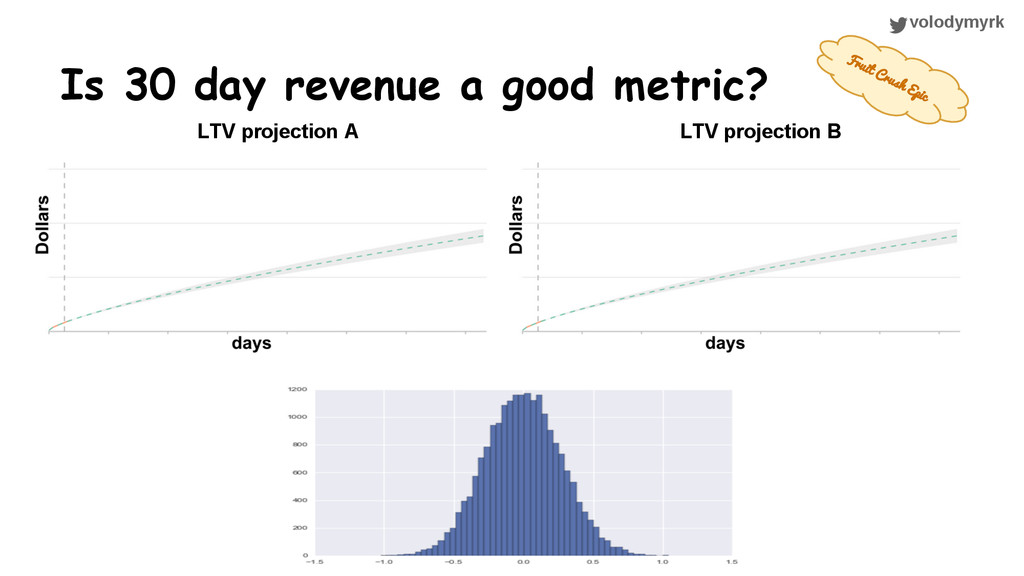
There are multiple items to buy in game (lives, boosters, blenders, etc) • We expect more people to make a $0.99 purchase, so we hope to make more money overall, even at lower price A/B test Design • We will show A/B test to new users only • Will run for 2 months • We will measure overall revenue per user in the first 30 days • Null-hypothesis: we make more money from $0.99 group Measurements • Difference in Average Revenue Per User (ARPU) in 30 days • Difference in Conversion Rate (%% of users who make at least 1 purchase)
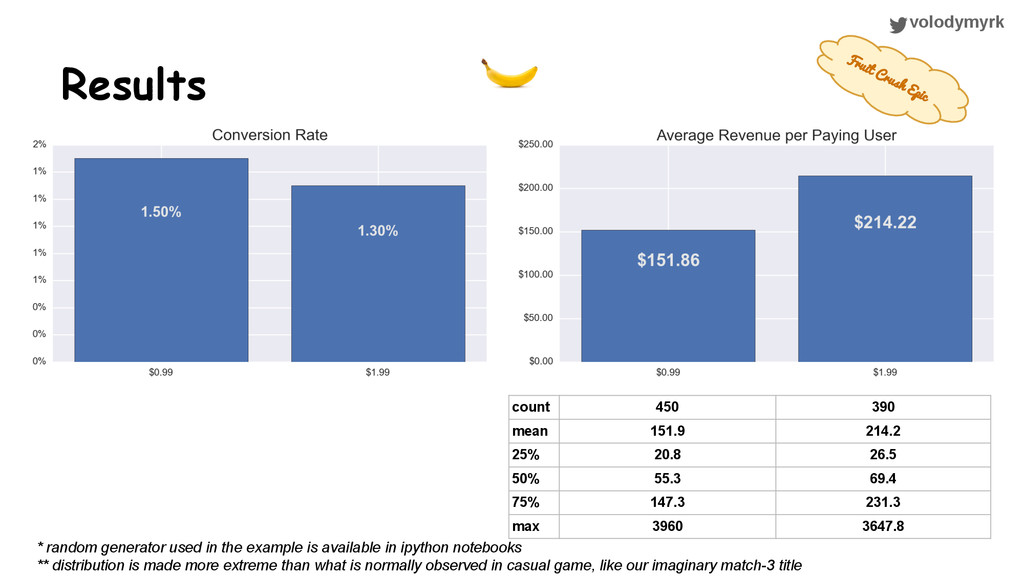
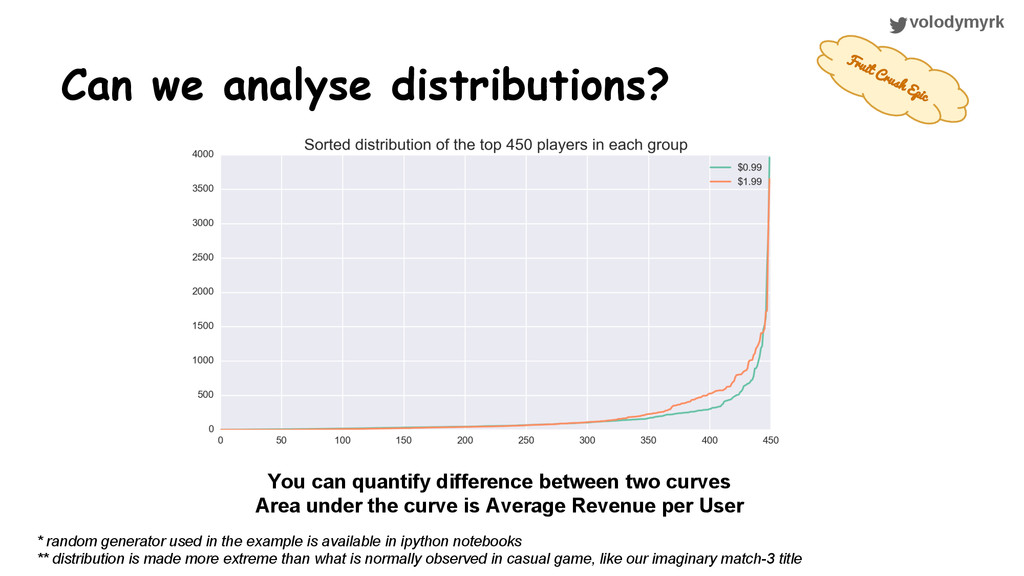
26.5 50% 55.3 69.4 75% 147.3 231.3 max 3960 3647.8 Fruit Crush Epic * random generator used in the example is available in ipython notebooks ** distribution is made more extreme than what is normally observed in casual game, like our imaginary match-3 title
two curves Area under the curve is Average Revenue per User Fruit Crush Epic * random generator used in the example is available in ipython notebooks ** distribution is made more extreme than what is normally observed in casual game, like our imaginary match-3 title
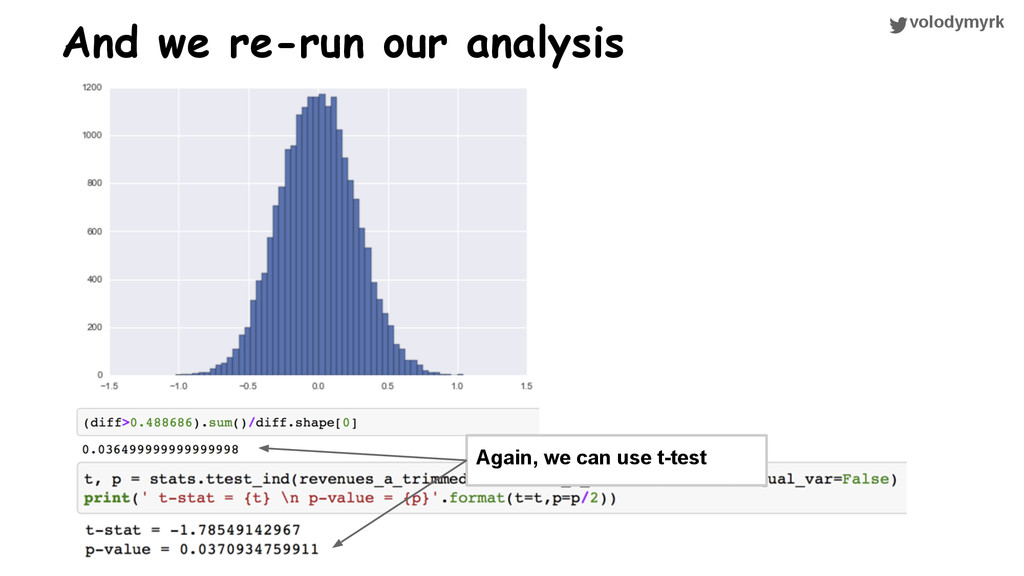
any Data Scientist must know • t-tests are robust to be useful even with skewed data sets • Bayesian and MCMC is cool, but don’t use MCMC for trivial cases • It is hard to detect the difference in heavily-skewed cases IPython Notebooks for this tutorial are available at: http://nbviewer.ipython.org/github/VolodymyrK/stats-testing-in-python