Upgrade to Pro — share decks privately, control downloads, hide ads and more …

JS Fest 2019: Post-Mortem Debugging in Node.js

JS Fest 2019: Post-Mortem Debugging in Node.js

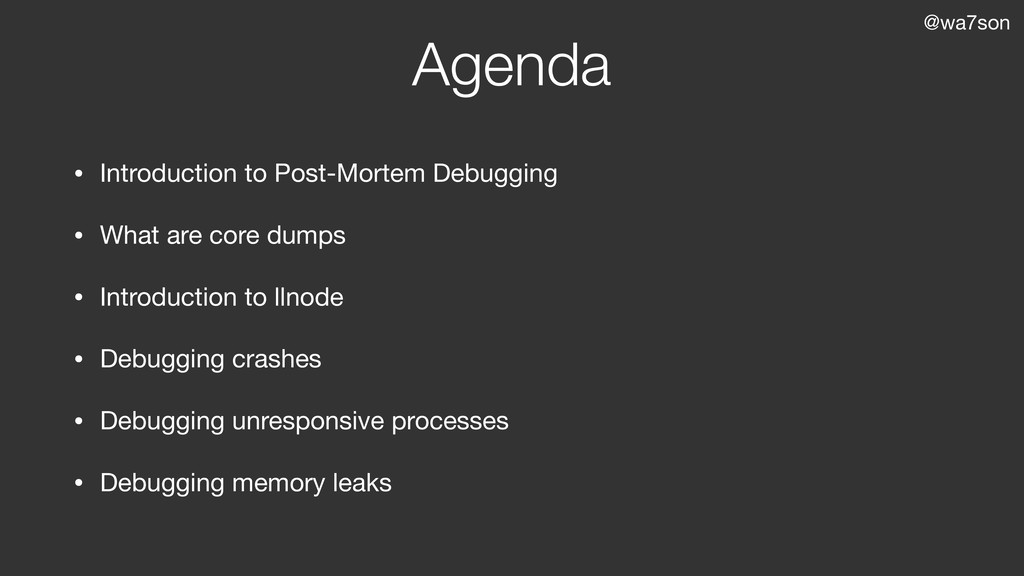
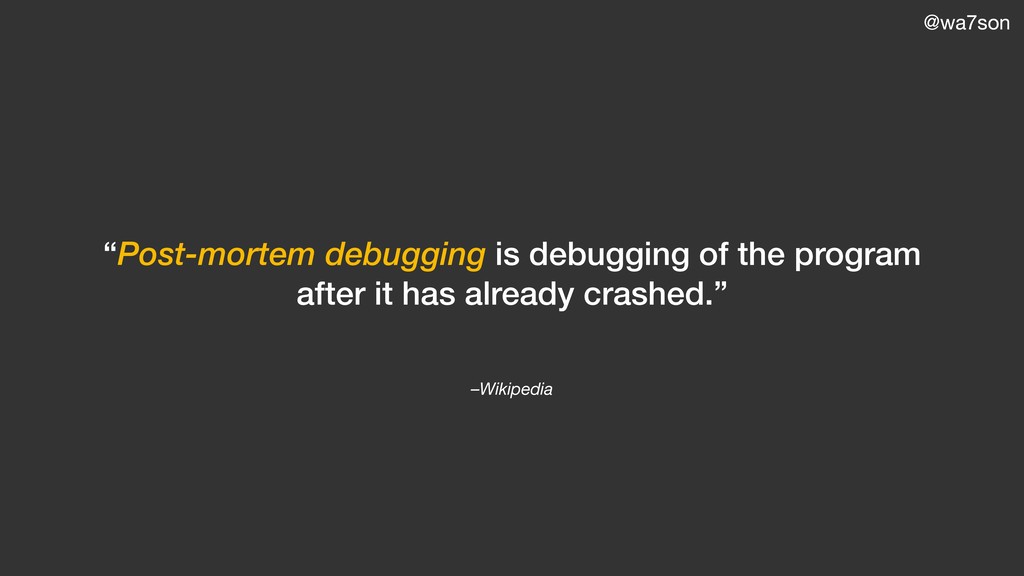
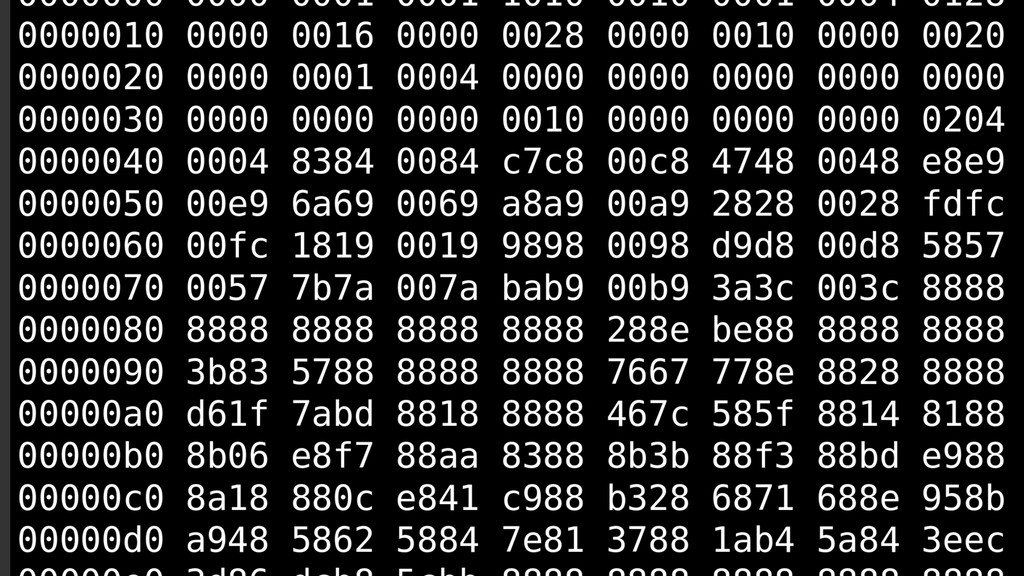
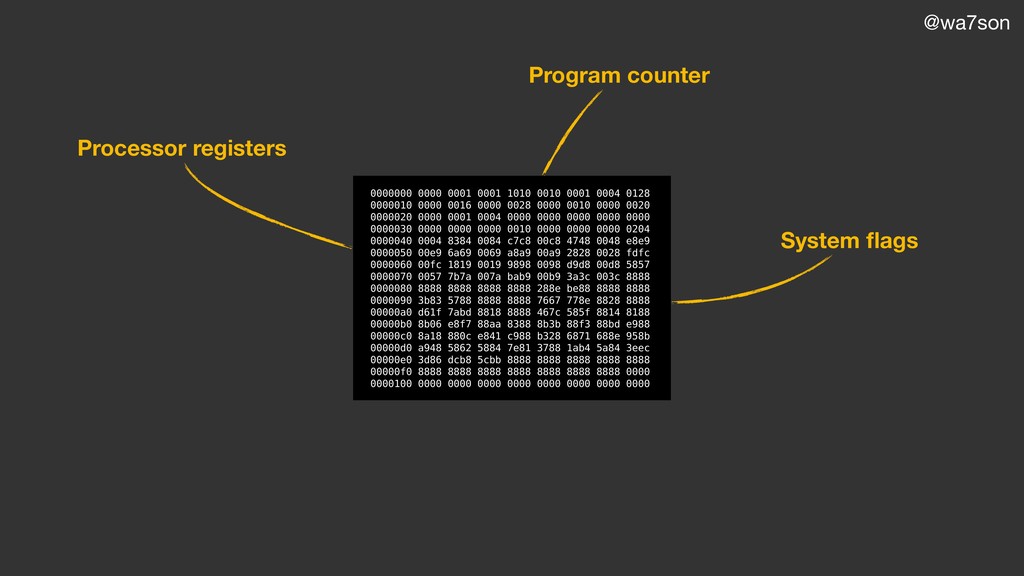
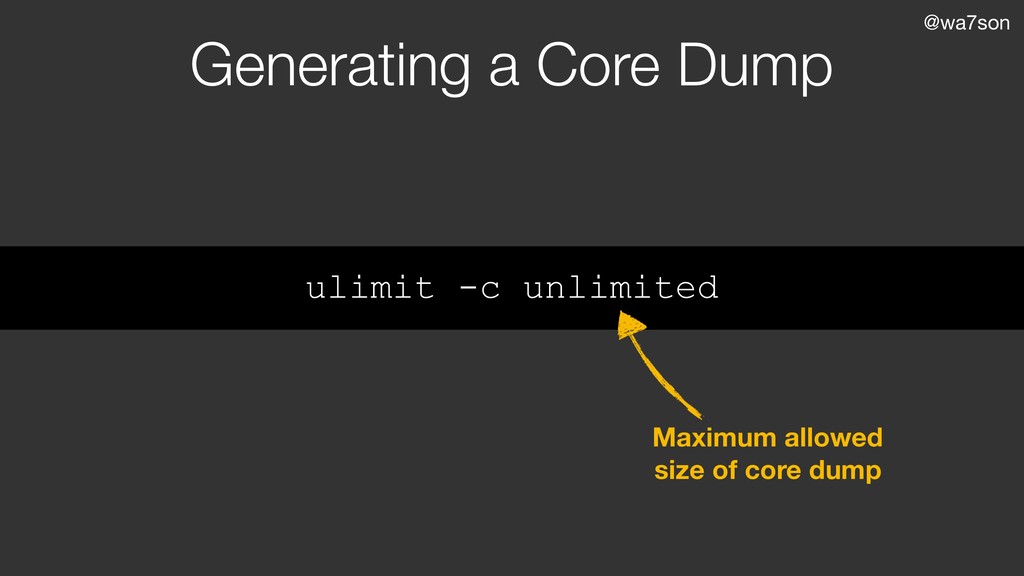
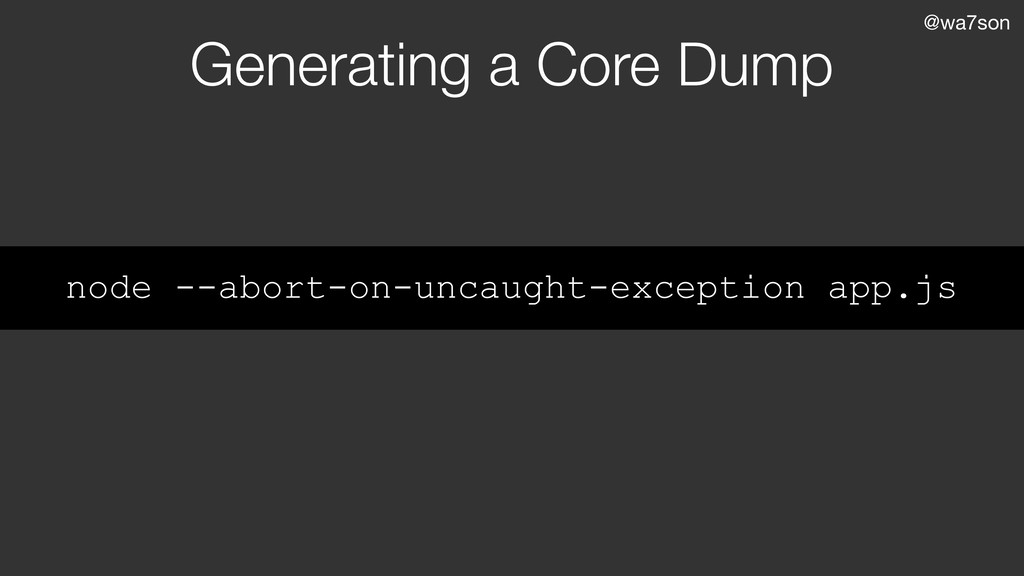
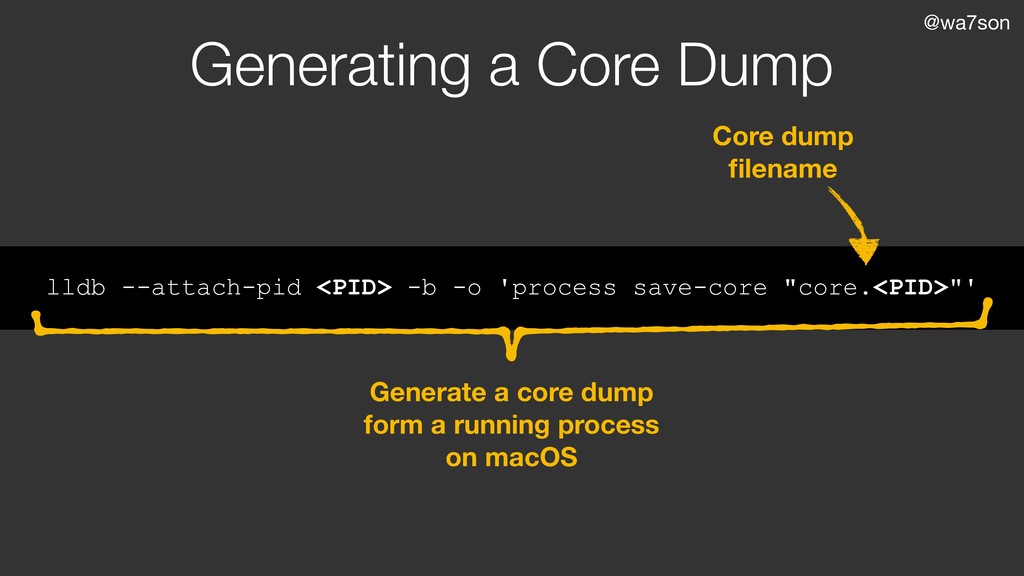
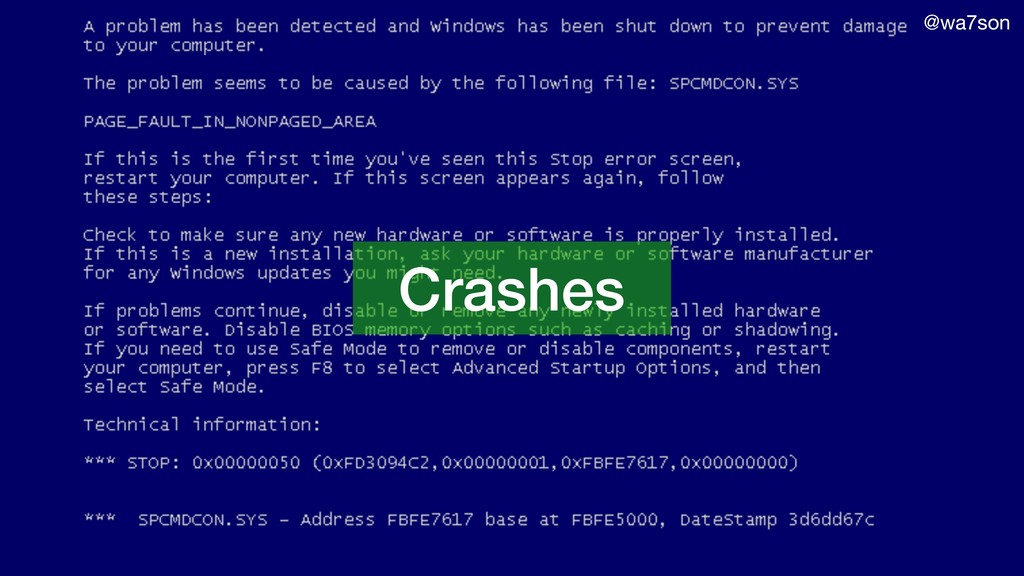
Post-Mortem debugging is a really powerful technique that allows you, through the use of several tools, to take a memory dump when an issue occurs in your application and later analyze it offline.

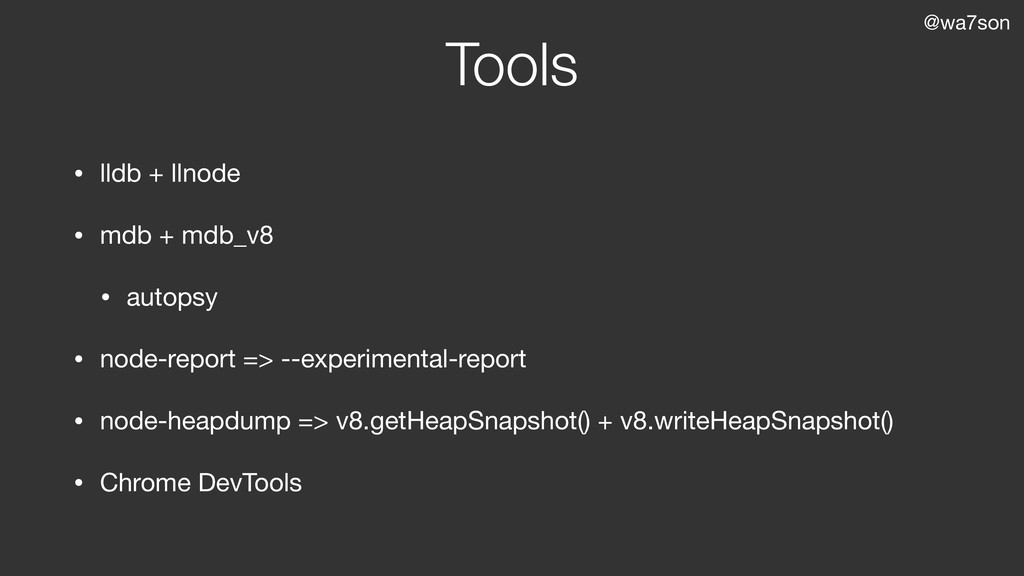
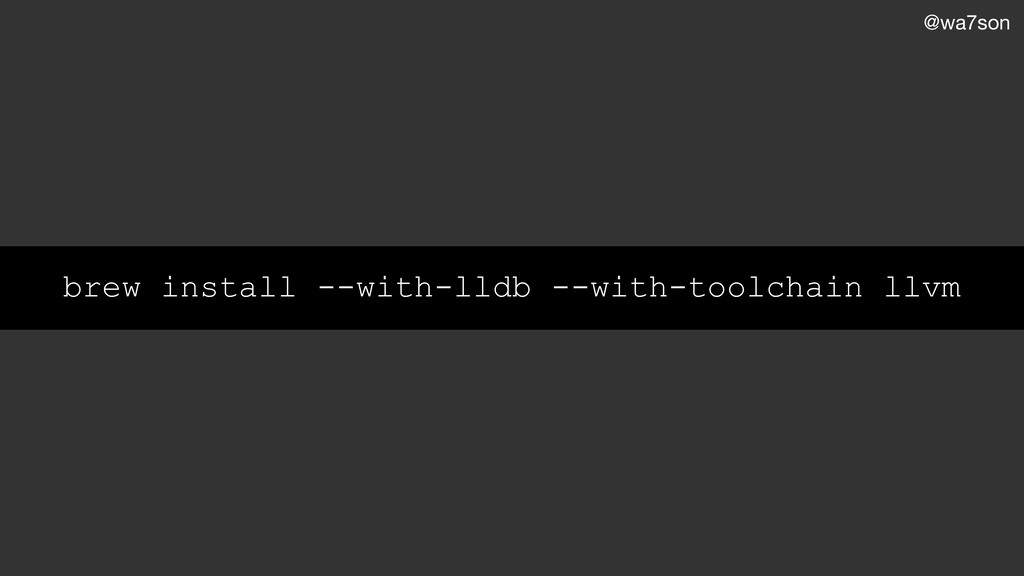
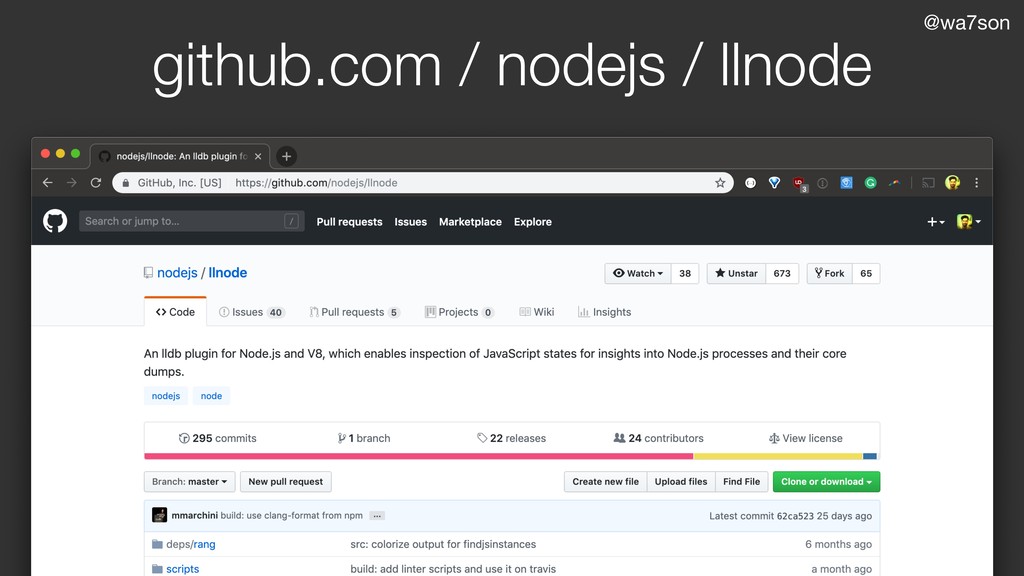
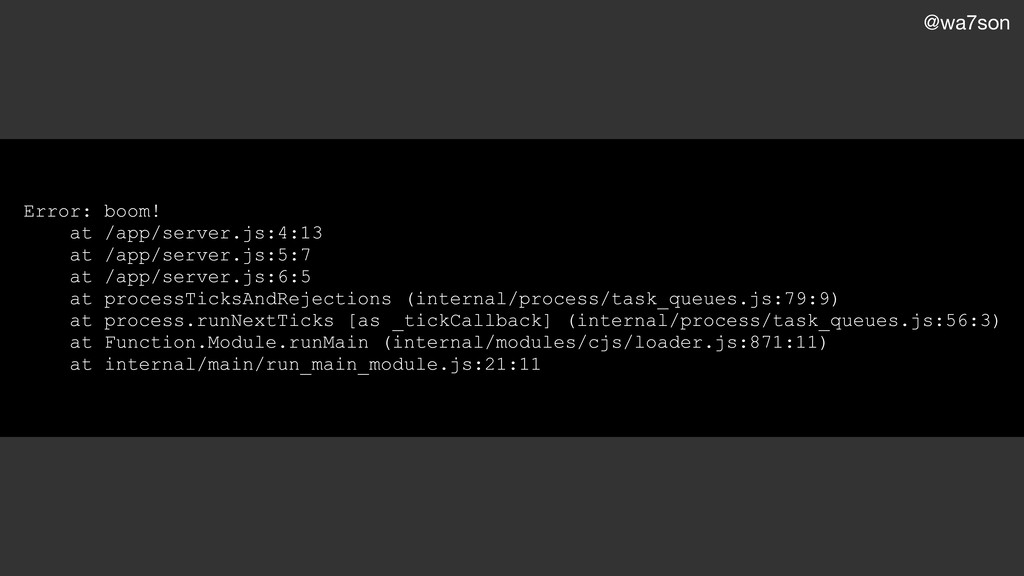
The talk will primarily focus on llnode and how you can use this tool to better understand why a Node.js process is behaving odd or is crashing.

Thomas Watson

April 05, 2019
Tweet

More Decks by Thomas Watson

Other Decks in Programming

Transcript

  1. @wa7son Who am I? • Thomas Watson • Open Source

    developer at github.com/watson • Principal Software Engineer at Elastic • Node.js Core Member • Tweets as @wa7son
  2. @wa7son Agenda • Introduction to Post-Mortem Debugging • What are

    core dumps • Introduction to llnode • Debugging crashes • Debugging unresponsive processes • Debugging memory leaks
  3. @wa7son Tools • lldb + llnode • mdb + mdb_v8

    • autopsy • node-report => --experimental-report • node-heapdump => v8.getHeapSnapshot() + v8.writeHeapSnapshot() • Chrome DevTools
  4. @wa7son Core Dump Formats a.out Older versions of Unix ELF

    Modern Linux, System V, Solaris, and BSD systems Mach-O macOS, etc
  5. @wa7son Generating a Core Dump gcore <pid> Generate a core

    dump form a running process on Linux ~/core.<pid>
  6. @wa7son Generating a Core Dump lldb --attach-pid <PID> -b -o

    'process save-core "core.<PID>"' Core dump filename Generate a core dump form a running process on macOS
  7. @wa7son Error: boom! at /app/server.js:4:13 at /app/server.js:5:7 at /app/server.js:6:5 at

    processTicksAndRejections (internal/process/task_queues.js:79:9) at process.runNextTicks [as _tickCallback] (internal/process/task_queues.js:56:3) at Function.Module.runMain (internal/modules/cjs/loader.js:871:11) at internal/main/run_main_module.js:21:11
  8. @wa7son Recap 1/2 Production Server • gcore <pid> • lldb

    --attach-pid <PID> -b -o 'process save-core "core.<PID>"'
  9. @wa7son Recap 2/2 Dev machine • llnode node -c core

    llnode • v8 help Get help • v8 bt Get stack trace at crash • frame select 3 Select stack frame #3 • v8 source list Show source code at selected stack frame • v8 inspect <addr> Inspect object at address
  10. @wa7son (llnode) v8 findjsobjects Instances Total Size Name ---------- ----------

    ---- 1 24 AssertionError 1 24 AsyncResource 1 24 Control 1 24 FastBuffer 1 24 Loader 1 24 ModuleJob 1 24 ModuleMap 1 24 Performance 1 24 PerformanceObserver 1 24 SafeMap 1 24 SafePromise 1 24 SafeSet 1 24 SocketListReceive
  11. @wa7son 12 384 TCP 12 2688 WritableState 15 1360 (ArrayBufferView)

    74 4736 NativeModule 5715 1234440 IncomingMessage 5744 781184 ServerResponse 5747 1103424 ReadableState 5748 275880 BufferList 45980 2942680 TickObject 69344 2219008 (Array) 235515 9420584 Visit 293720 15437744 Object 615411 3750984 (String) ---------- ---------- 1283140 37182200
  12. @wa7son (llnode) v8 findjsinstances -d Visit 0x0000176d04402201:<Object: Visit properties {

    .visit_id=<Smi: 82704>, .headers=0x0000176d7d99f1c9:<Object: Object>}> 0x0000176d04402229:<Object: Visit properties { .visit_id=<Smi: 82705>, .headers=0x0000176d7d99f191:<Object: Object>}> 0x0000176d04402251:<Object: Visit properties { .visit_id=<Smi: 82706>, .headers=0x0000176d7d99f159:<Object: Object>}> 0x0000176d04402279:<Object: Visit properties { .visit_id=<Smi: 82707>, .headers=0x0000176d7d99f121:<Object: Object>}> 0x0000176d044022a1:<Object: Visit properties { .visit_id=<Smi: 82708>, .headers=0x0000176d7d99f0e9:<Object: Object>}>
  13. @wa7son 0x0000176d044022c9:<Object: Visit properties { .visit_id=<Smi: 82709>, .headers=0x0000176d7d99f0b1:<Object: Object>}> //

    A thousand miles later... 0x0000176dffba62d9:<Object: Visit properties { .visit_id=<Smi: 156026>, .headers=0x0000176dffbef559:<Object: Object>}> 0x0000176dffba6301:<Object: Visit properties { .visit_id=<Smi: 156027>, .headers=0x0000176dffbef8a9:<Object: Object>}> 0x0000176dffba6329:<Object: Visit properties { .visit_id=<Smi: 156028>, .headers=0x0000176dffb82481:<Object: Object>}>
  14. @wa7son (llnode) v8 inspect 0x0000176d689cec29 0x0000176d689cec29:<Map own_descriptors=2 in_object_size=2 instance_size=40 descriptors=0x0000176d7f284569:<FixedArray,

    len=8 contents={ [0]=<Smi: 2>, [1]=<Smi: 0>, [2]=0x0000176dd8566a11:<String: "visit_id">, [3]=<Smi: 320>, [4]=<Smi: 1>, [5]=0x0000176dd8566a31:<String: "headers">, [6]=<Smi: 1050112>, [7]=0x0000176d117509f9:<unknown>}>>
  15. @wa7son Can this be improved? • Convert a core dump

    to a heap snapshot • Allow user to trigger a gc + heap snapshot from outside the process
  16. @wa7son Writing heap snapshots process.on('SIGUSR2', () => { const {

    writeHeapSnapshot } = require('v8') if (global.gc) { global.gc() } console.log('Heap snapshot written:’, writeHeapSnapshot()) }) node --expose-gc app.js Returns name of file written kill -SIGUSR2 <pid> (For now, works only on Node.js 11.13.0+)
  17. @wa7son Recap Dev machine • llnode node -c core llnode

    • v8 help Get help • v8 findjsobjects -d List all objects sorted by count • v8 inspect <addr> Inspect object at address • v8 findrefs <addr> Find all references to object at address
  18. @wa7son const llnode = require(‘llnode').fromCoredump( process.argv[3], process.argv[2] ) const process

    = llnode.getProcessObject() console.log(`Process ${process.pid}: ${process.state}`) process.threads.forEach(thread => { console.log(`Thread ${thread.threadId}`) thread.frames.forEach((frame, index) => { console.log(`#${index}: ${frame.function}`) }) })
  19. @wa7son Working Areas • Tracing • Profiling • Heap and

    Memory Analysis • Step Debugging • Post-Mortem Debugging
  20. @wa7son Current Initiatives • Diagnostic Channel • Async Hooks •

    Async Context • Support tiers • CPU Profiling • Trace Events • Performance Profiles • Time-travel debugging • Continuation Local Storage (CLS)