Upgrade to Pro — share decks privately, control downloads, hide ads and more …

Measuring the reliability of diagnostic mastery classifications at multiple levels of reporting

Jake Thompson
April 15, 2018
160

Measuring the reliability of diagnostic mastery classifications at multiple levels of reporting

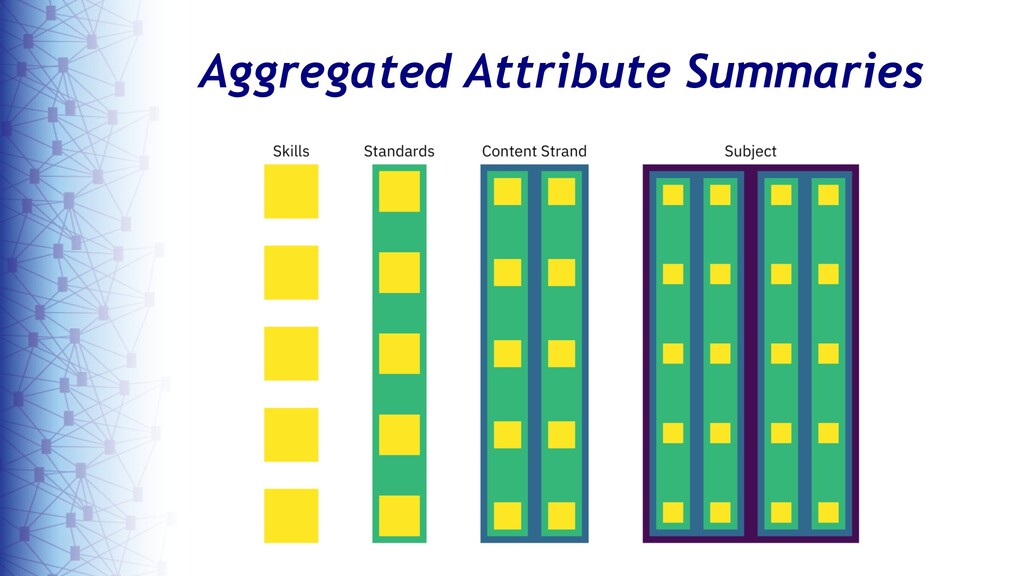
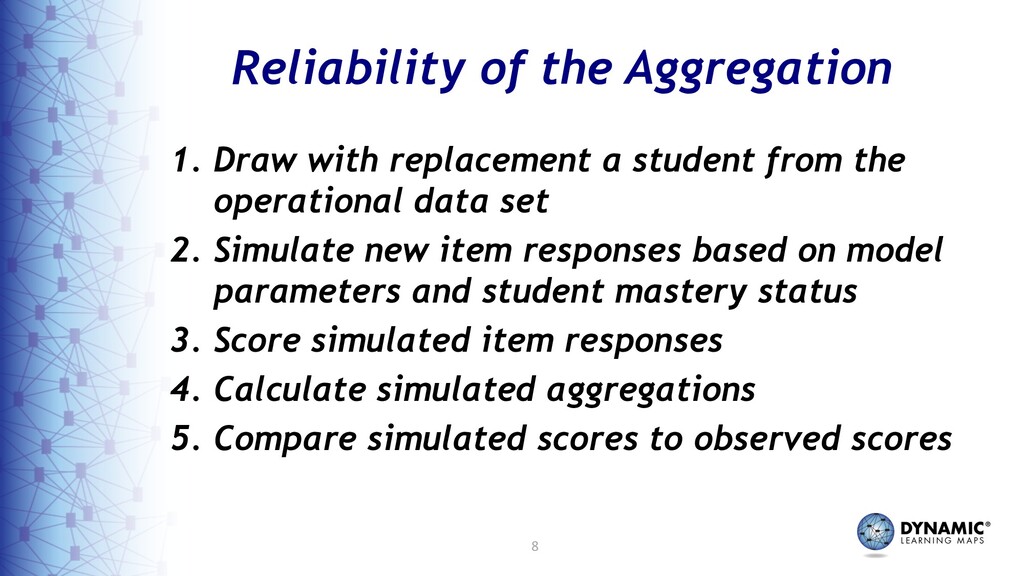
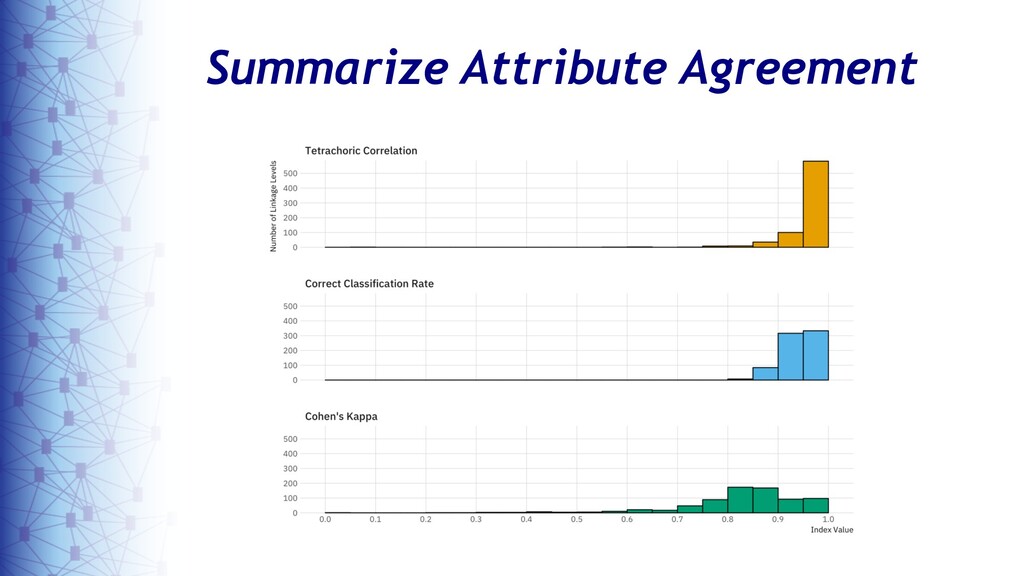
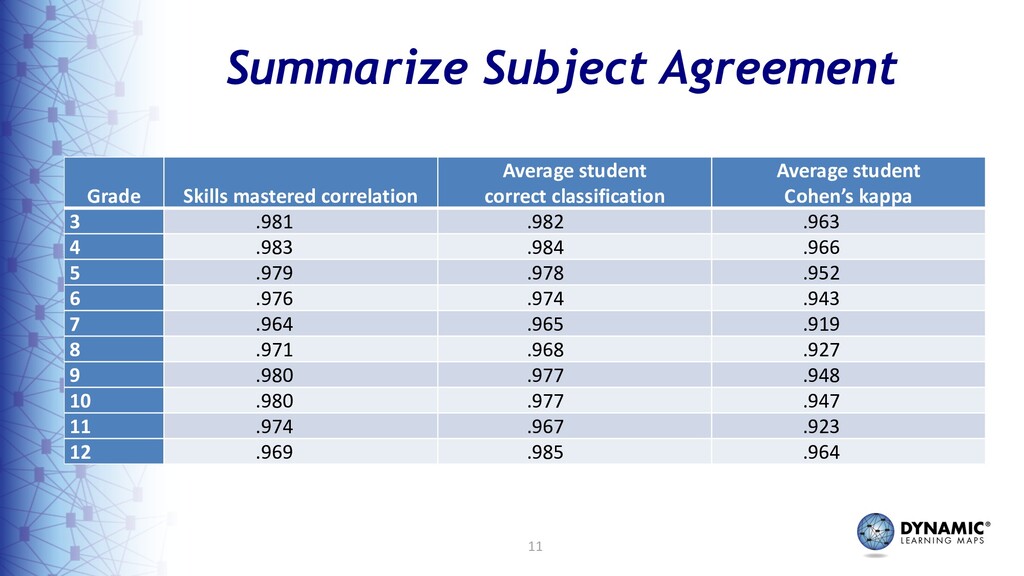
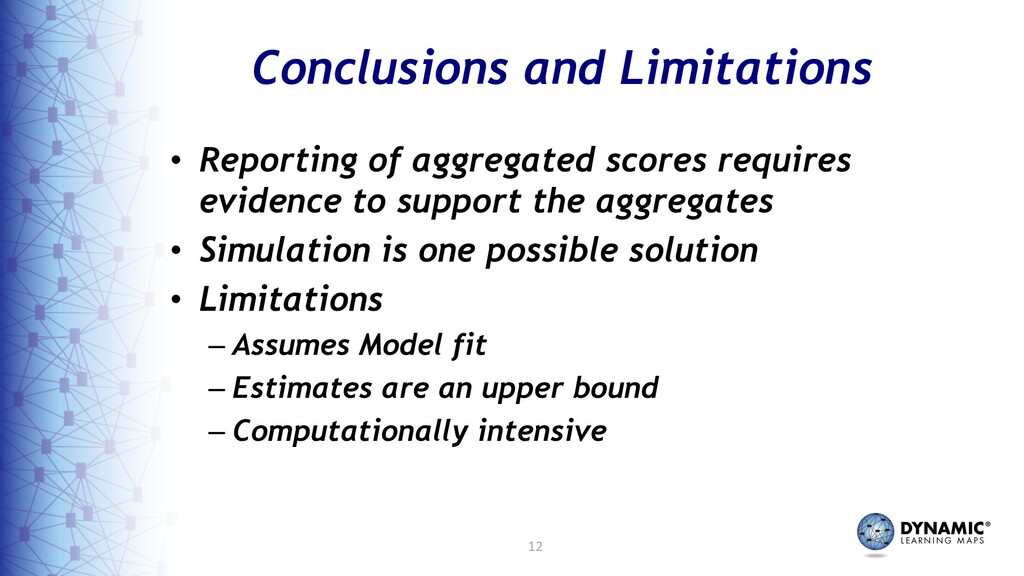
As the use of diagnostic assessment systems transitions from research applications to large-scale assessments for accountability purposes, reliability methods that provide evidence at each level of reporting must are needed. The purpose of this paper is to summarize one simulation-based method for estimating and reporting reliability for an operational, large-scale, diagnostic assessment system. This assessment system reports the results and associated reliability evidence at the individual skill level for each academic content standard and broader content strands. The system also summarizes results for the overall subject using achievement levels, which are often included in state accountability metrics. Results are summarized as measures of association between true and estimated mastery status for each level of reporting.

Jake Thompson

April 15, 2018
Tweet

Transcript

  1. Measuring the Reliability of Diagnostic Mastery Classifications at Multiple Levels

    of Reporting Jake Thompson, Amy Clark, & Brooke Nash ATLAS, University of Kansas
  2. 3 Diagnostic Classification Models • Latent trait models that assume

    a categorical latent trait • Multivariate • Probability of a correct response determined by the examinees’ attribute profiles and a Q- matrix • Scores are based on an examinee’s probability of mastery on the defined attributes
  3. 4 Reliability in DCMs • Traditional methods are inadequate •

    Templin & Bradshaw (2013) – Use mastery probabilities to create a 2x2 contingency table for re-test mastery – Aggregate over all examinees – Reliability estimate is the tetrachoric correlation of aggregated contingency table • Provides a reliability estimate for each attribute
  4. 6 Using DCMs in a Learning Map Setting • Thousands

    of possible nodes in the map structure • On any given blueprint examinees test on 50-100 attributes • Fine grained inferences, but can be overwhelming
  5. 8 Reliability of the Aggregation 1. Draw with replacement a

    student from the operational data set 2. Simulate new item responses based on model parameters and student mastery status 3. Score simulated item responses 4. Calculate simulated aggregations 5. Compare simulated scores to observed scores
  6. 10 Summarize Content Standard Agreement Index range Metric <.60 .60–.64

    .65–.69 .70–.74 .75–.79 .80–.84 .85–.89 .90–.94 .95–1.00 Polychoric correlation 0 0 0 0 1 14 32 81 20 Correct classification rate 0 0 0 4 16 58 57 13 0 Cohen’s kappa 0 0 1 3 8 20 59 52 5
  7. 11 Summarize Subject Agreement Grade Skills mastered correlation Average student

    correct classification Average student Cohen’s kappa 3 .981 .982 .963 4 .983 .984 .966 5 .979 .978 .952 6 .976 .974 .943 7 .964 .965 .919 8 .971 .968 .927 9 .980 .977 .948 10 .980 .977 .947 11 .974 .967 .923 12 .969 .985 .964
  8. 12 Conclusions and Limitations • Reporting of aggregated scores requires

    evidence to support the aggregates • Simulation is one possible solution • Limitations – Assumes Model fit – Estimates are an upper bound – Computationally intensive