Upgrade to Pro — share decks privately, control downloads, hide ads and more …

Using Diagnostic Models to Evaluate Student Learning Hierarchies in a Large-Scale Assessment

Jake Thompson
September 07, 2023

Using Diagnostic Models to Evaluate Student Learning Hierarchies in a Large-Scale Assessment

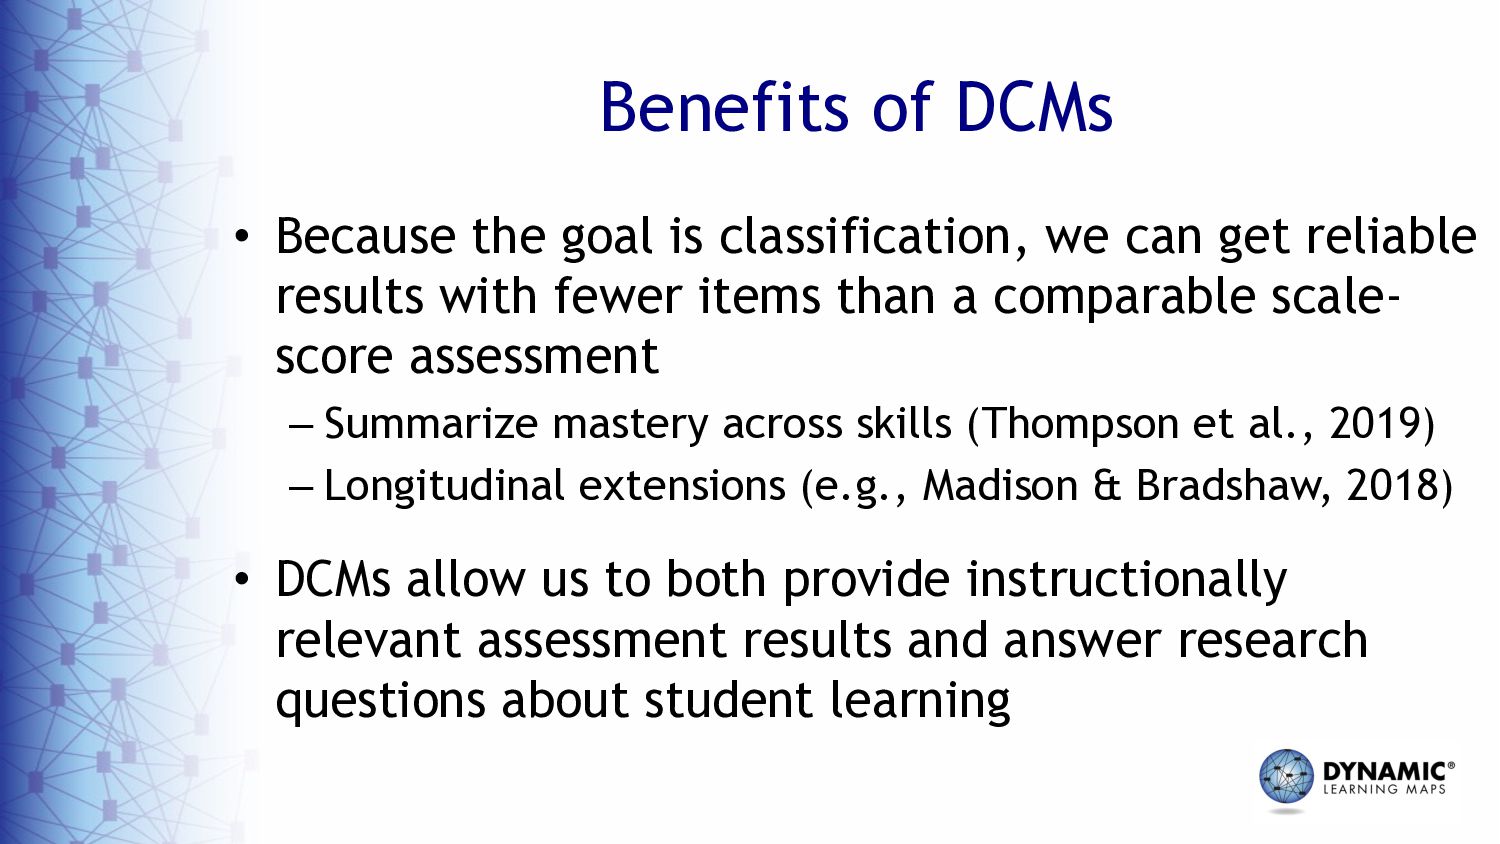
In recent years, the focus of large-scale assessments has begun to shift from summative evaluations of student achievement to more actionable and fine-grained information about student proficiency of skills within cognitive learning models. This change in emphasis not only has benefits for teachers, students, and parents, but also offers opportunities for researchers to better understand student learning and skill acquisition. To meet these challenges and opportunities, we need innovative psychometric models that we can use for reporting valid results and understanding student cognition.

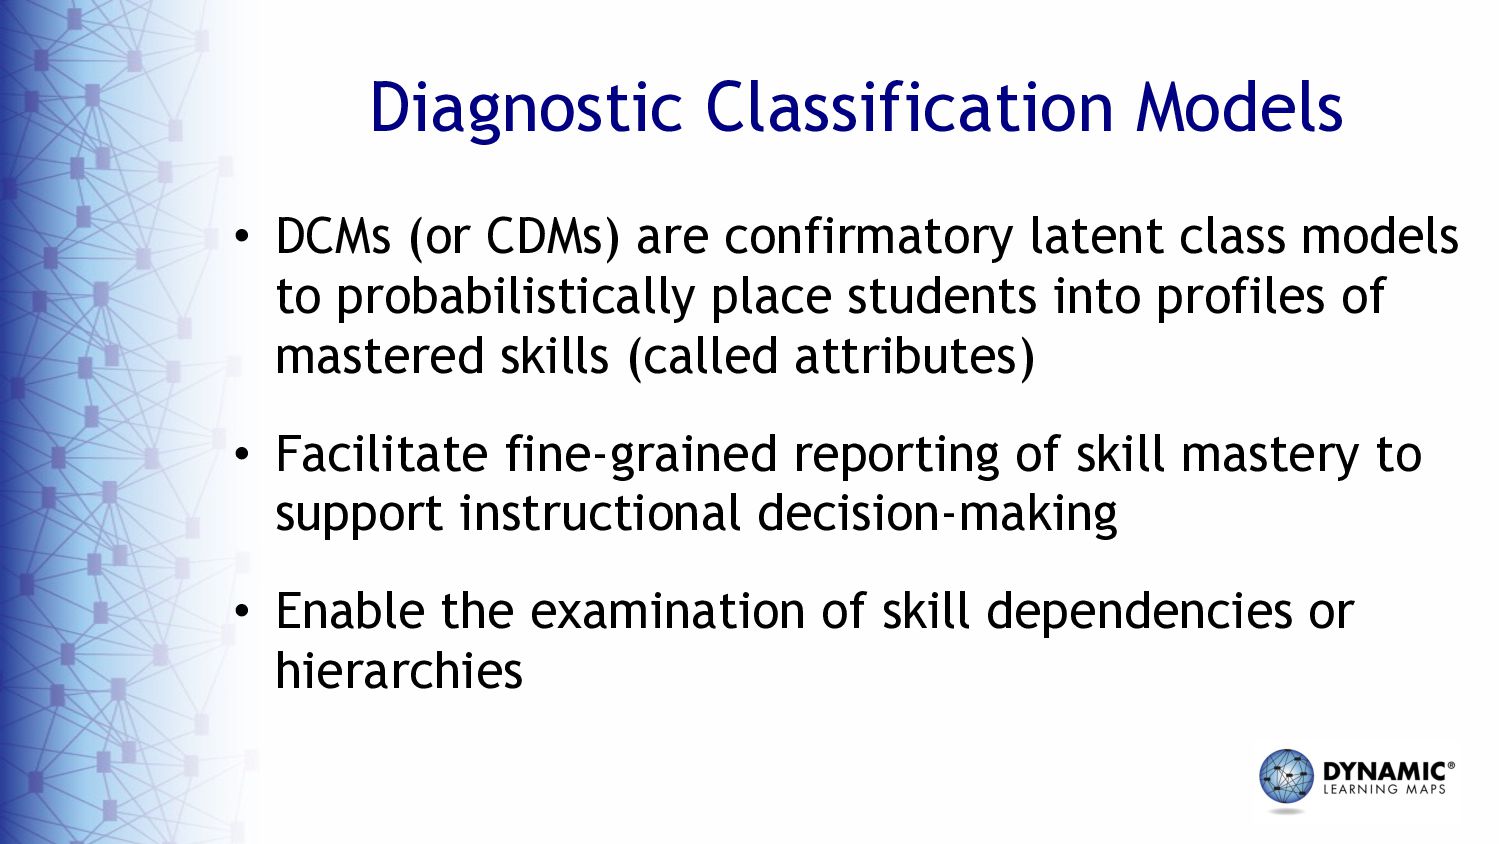
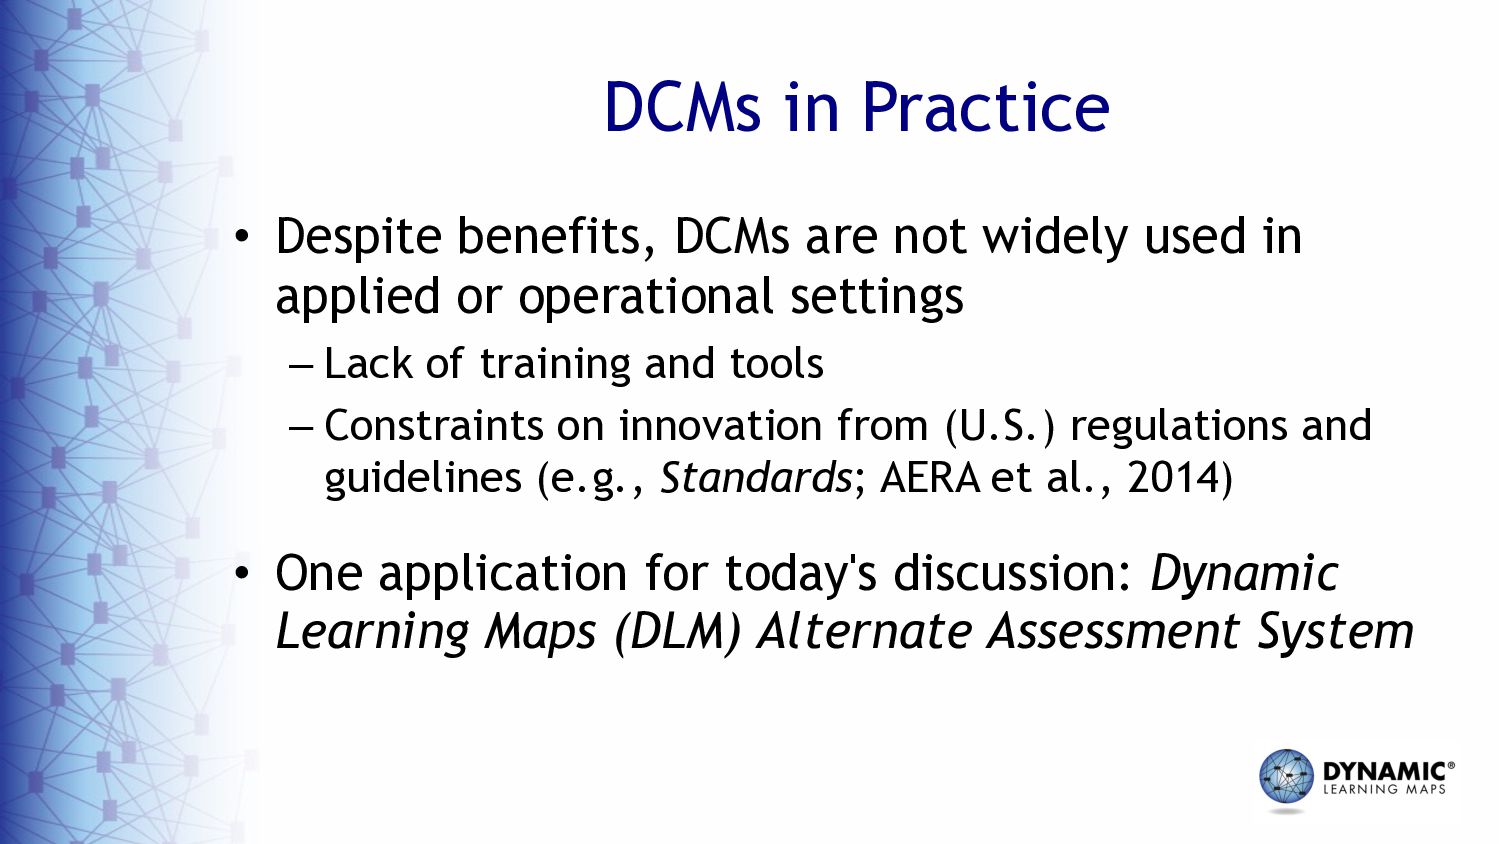
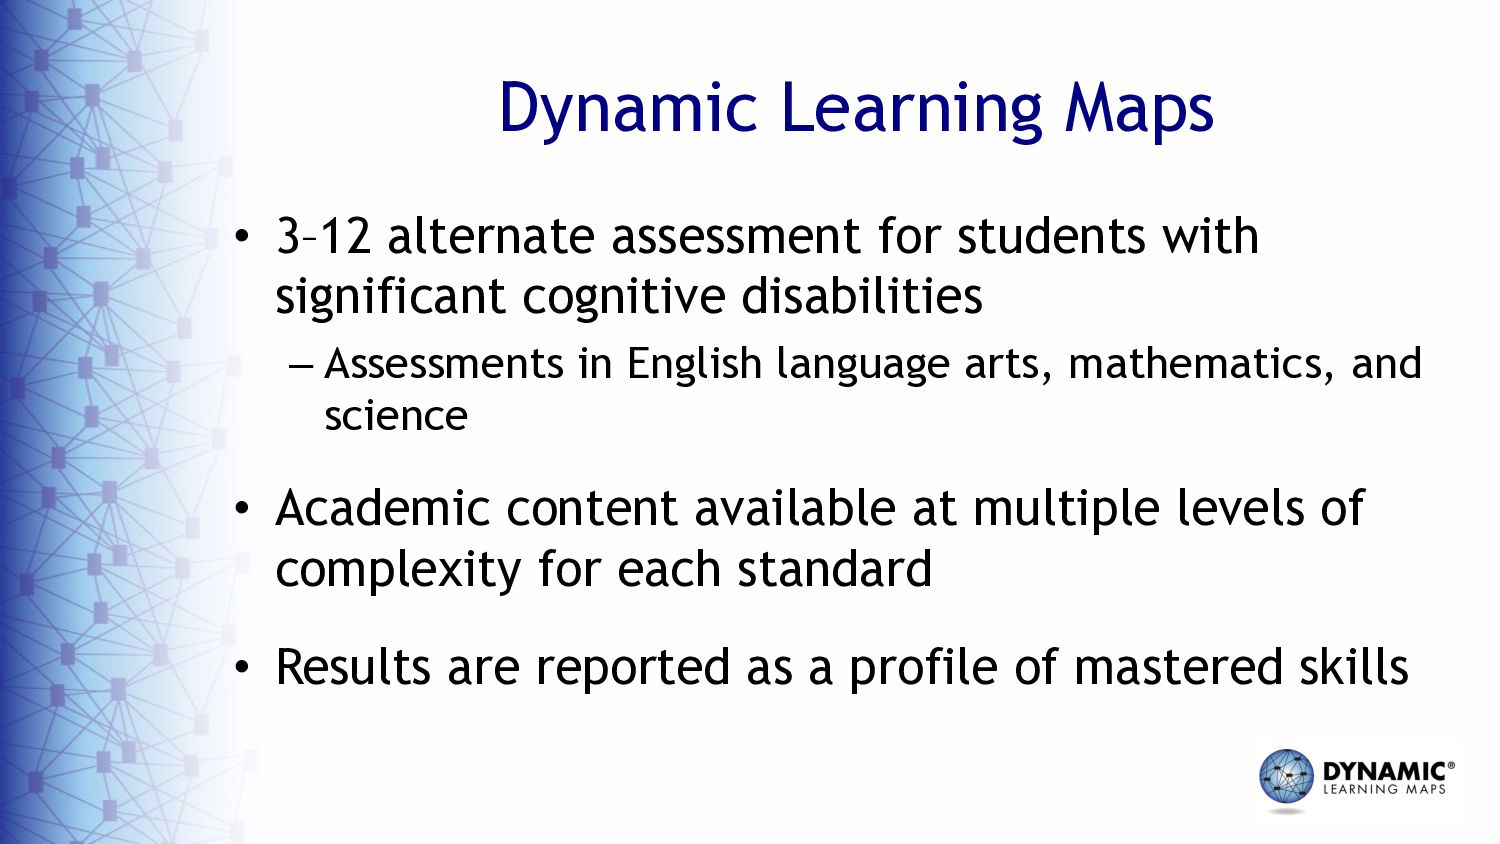
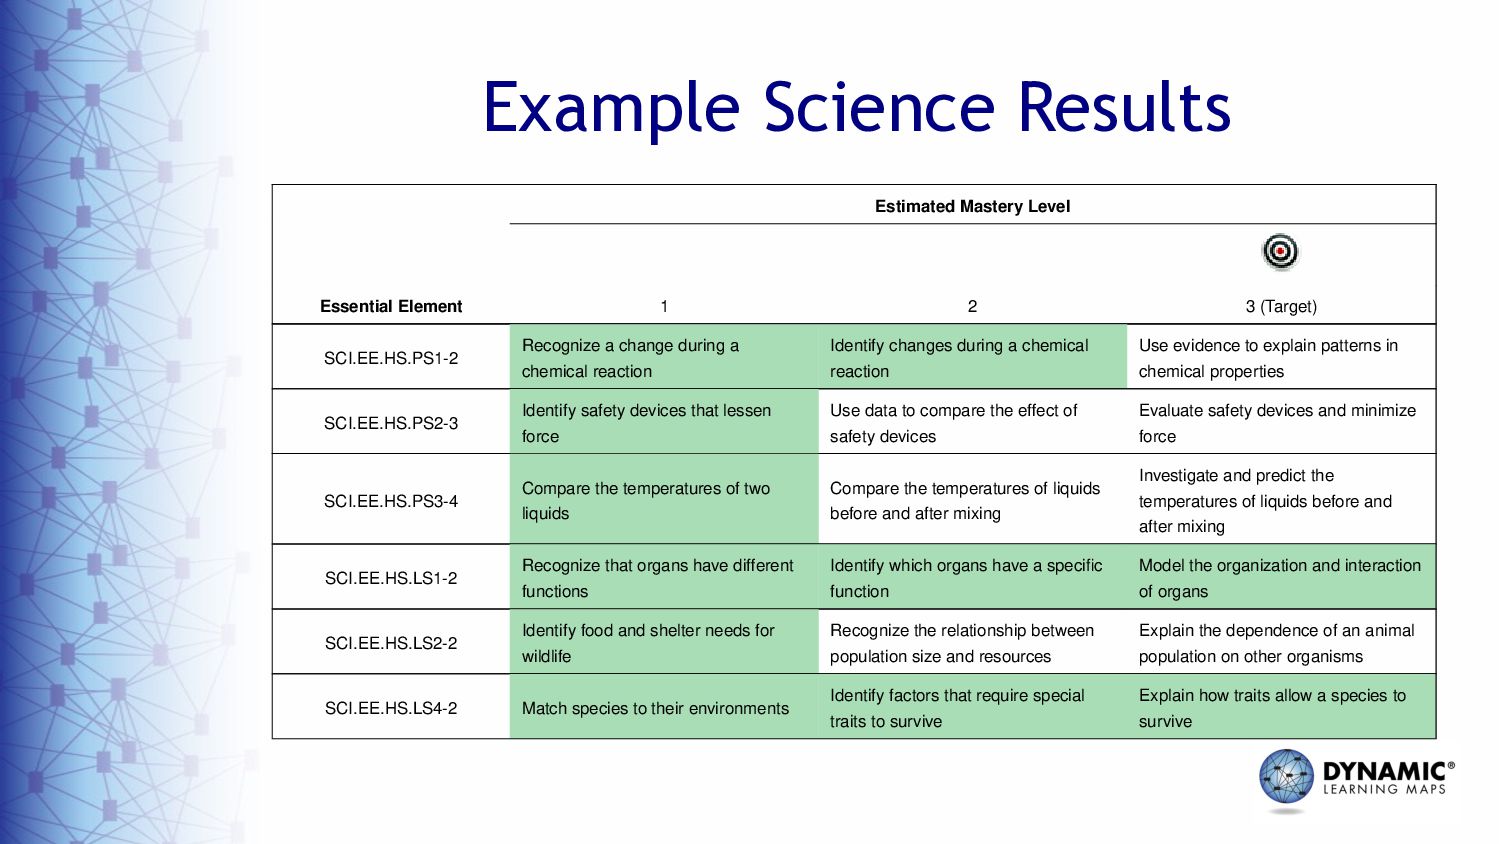
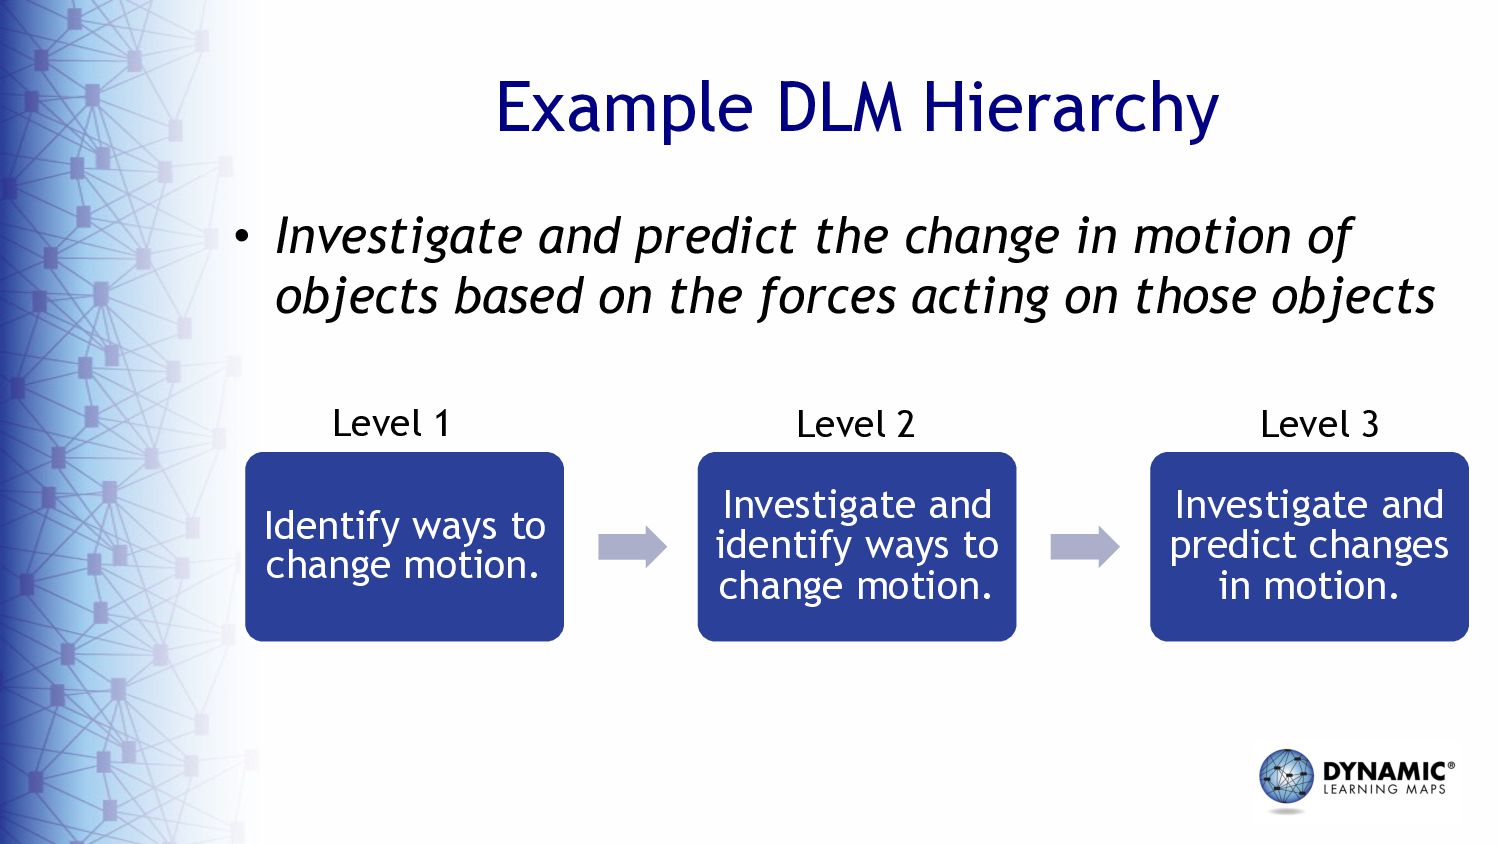
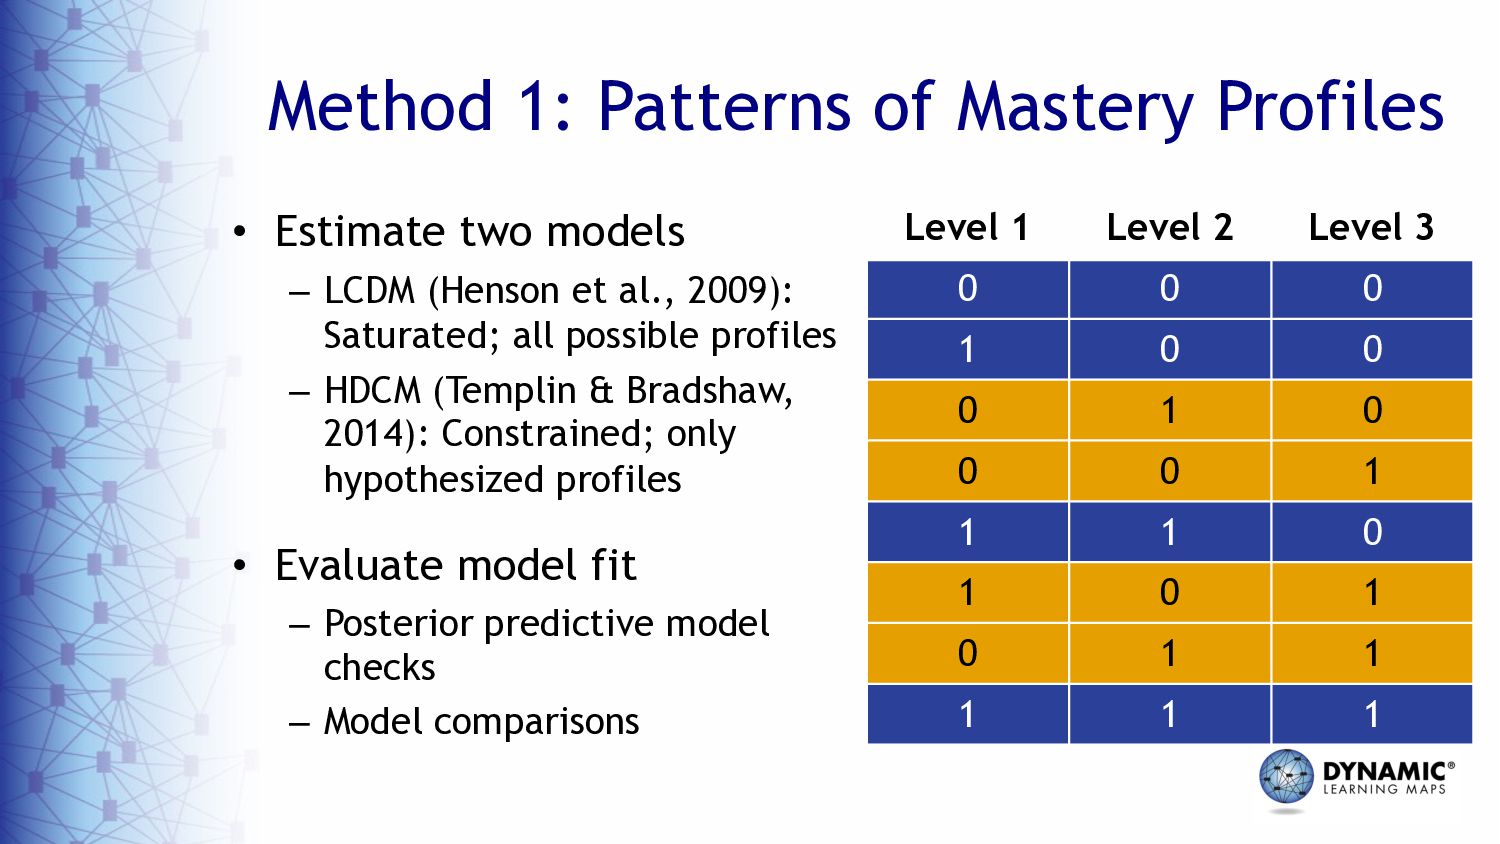
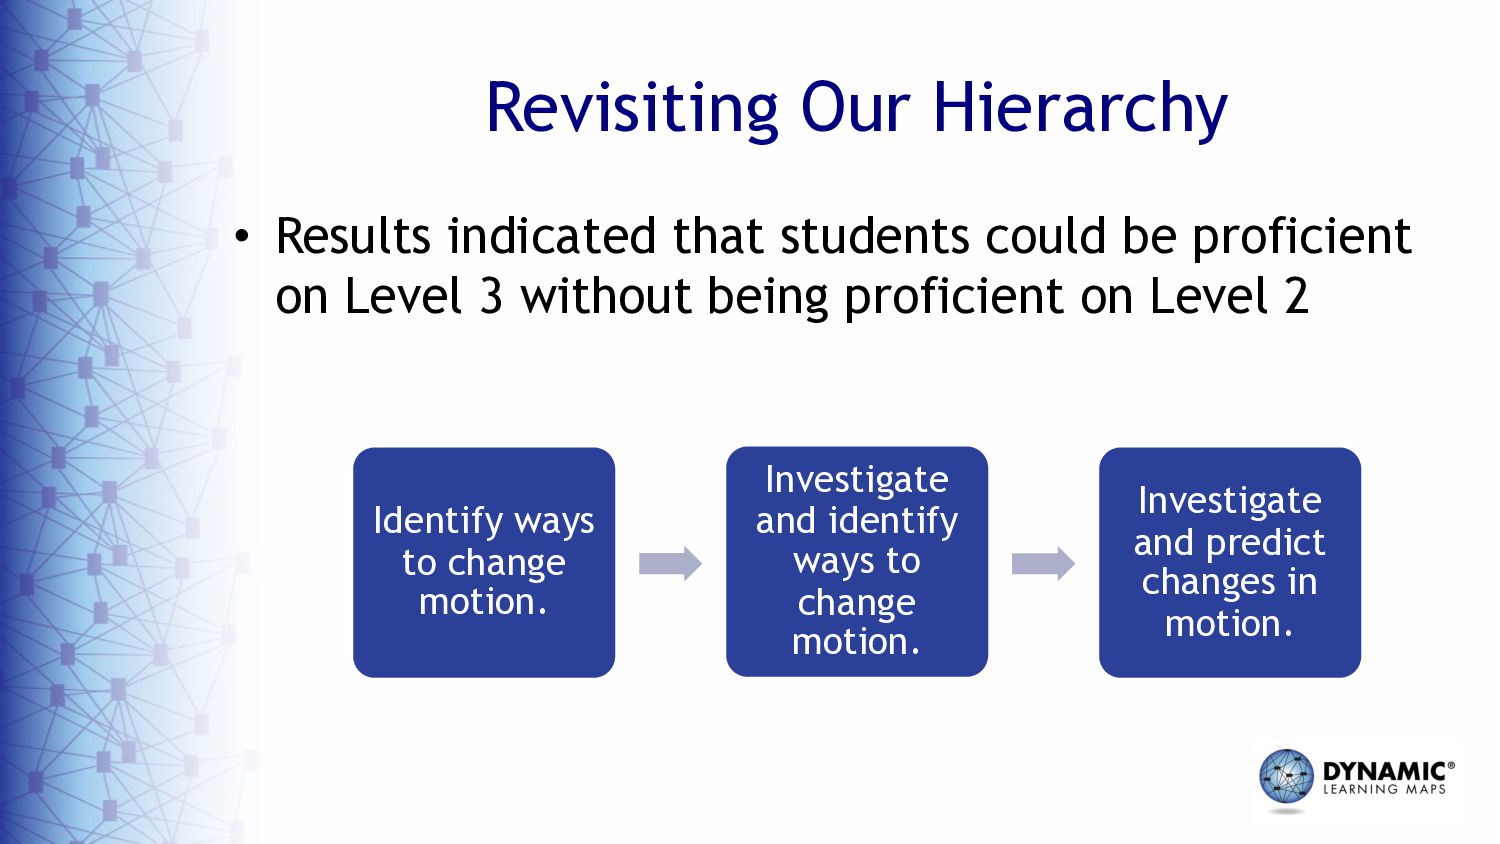
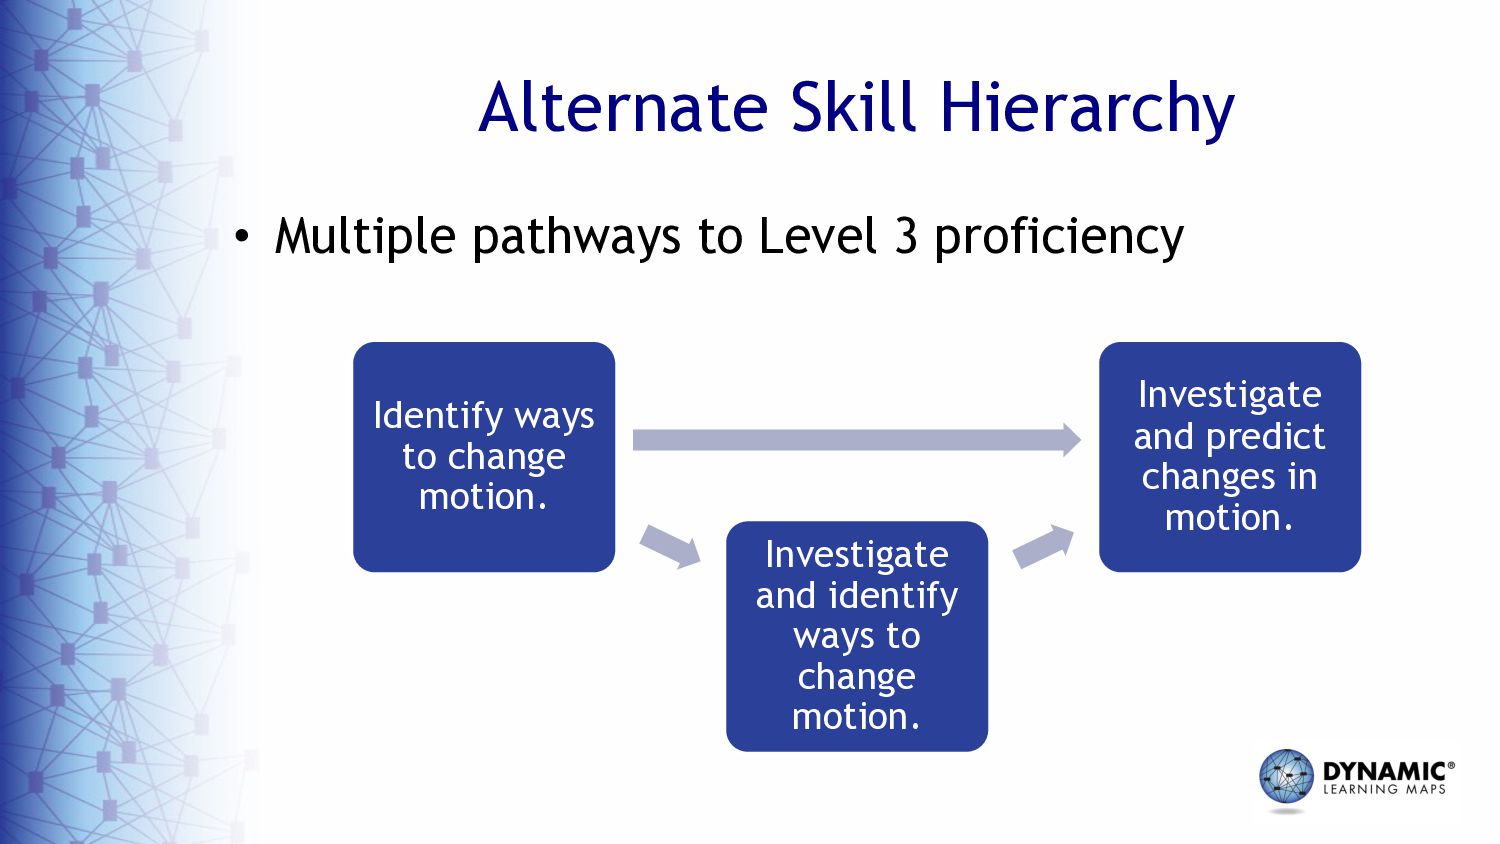
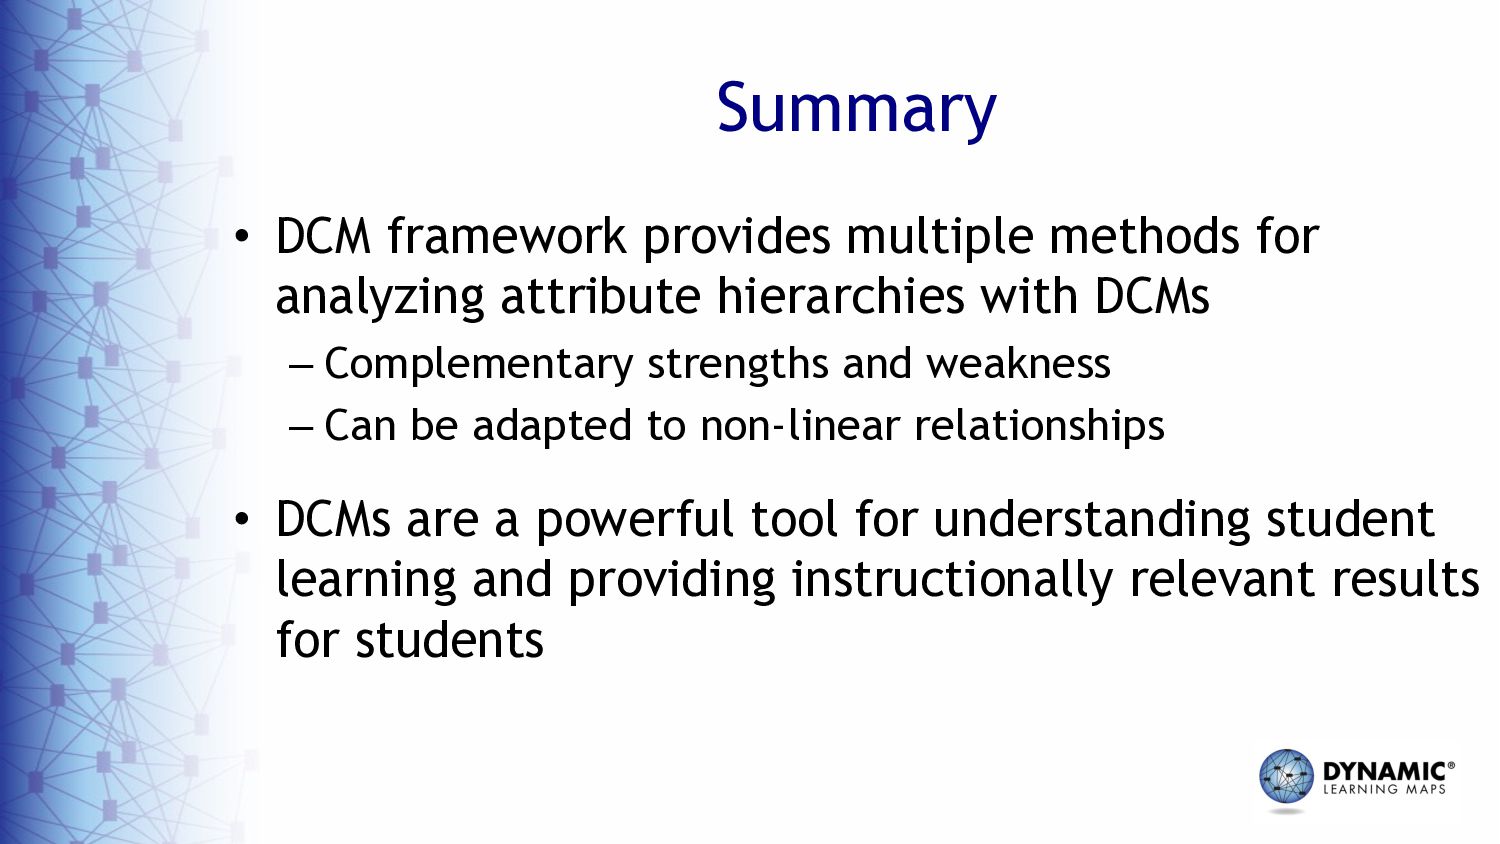
In this presentation, we describe a framework for using diagnostic classification models (DCMs; also called cognitive diagnostic models) within an operational assessment program to measure student proficiency and evaluate hierarchies in skill acquisition. The diagnostic framework for evaluating hierarchies includes multiple methods and applications of DCMs, each providing complementary information for evaluating the theoretically implied skill hierarchy and for identifying potential causes of violations to the hierarchy. We then illustrate the diagnostic framework in practice using data from a large-scale operational assessment, the Dynamic Learning Maps® (DLM®) Alternate Assessment System. Results for DLM assessments are calculated using DCMs to provide instructionally informative results within the proposed cognitive learning model structure. Thus, DCMs are used for both scoring and evaluating skill hierarchies within the DLM assessments.

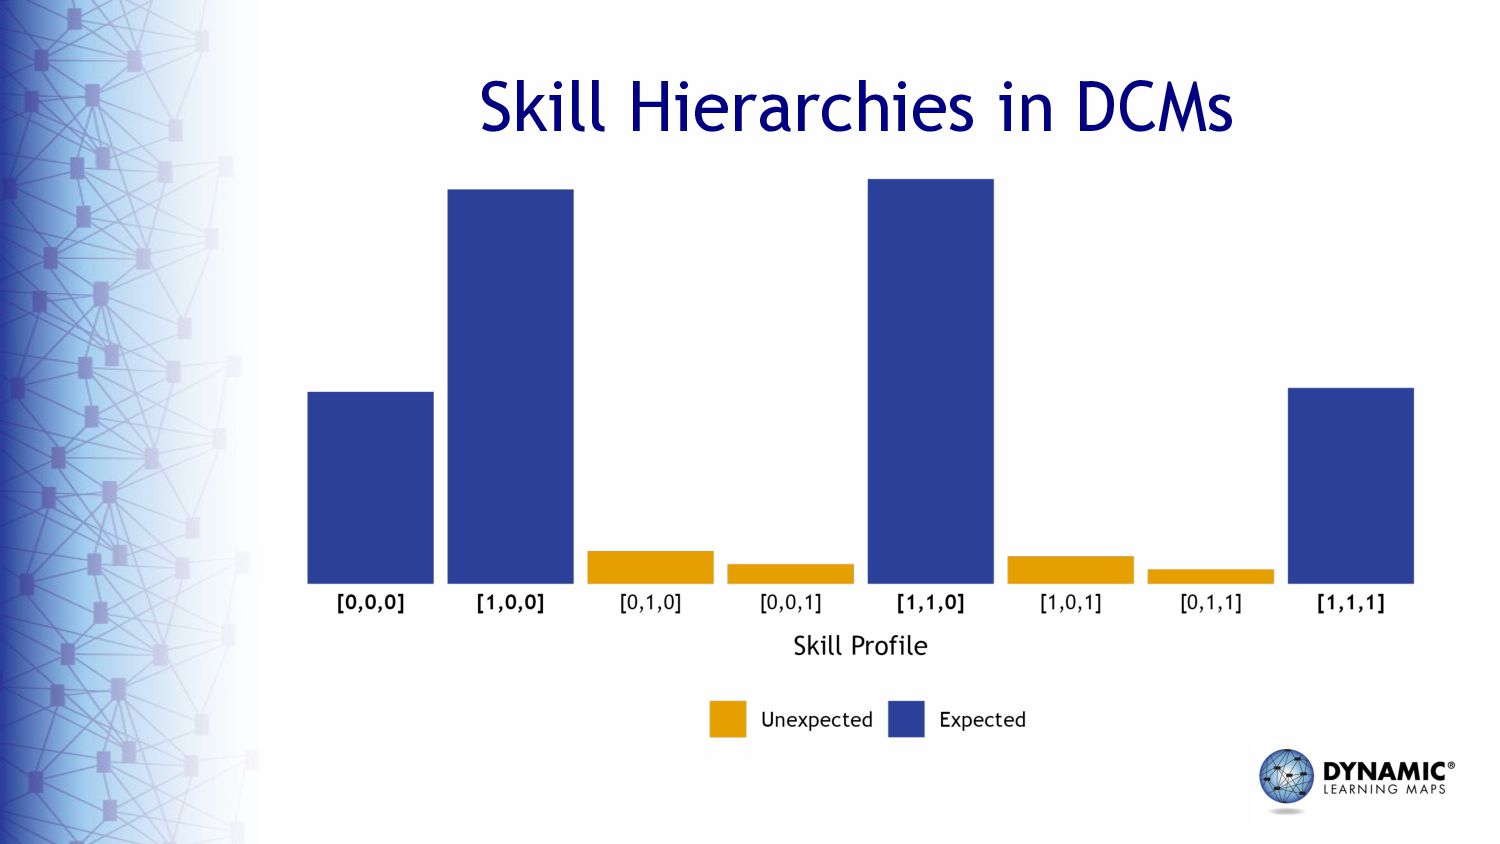
The findings demonstrate we can use DCMs for providing actionable assessment results and evaluating skill hierarchies to better understand student learning. Using the proposed DCM framework, we show that DLM skills largely conform to the hierarchy implied by the assessment design. Finally, we discuss how we can use findings to inform revisions to skill hierarchies and future avenues of research.

Jake Thompson

September 07, 2023
Tweet

More Decks by Jake Thompson

Other Decks in Education

Transcript

  1. Using Diagnostic Models to Evaluate Student Learning Hierarchies in a

    Large- Scale Assessment W. Jake Thompson, Brooke Nash, & Jeffrey C. Hoover Accessible Teaching, Learning, and Assessment Systems (ATLAS) University of Kansas
  2. Diagnostic Classification Models • DCMs (or CDMs) are confirmatory latent

    class models to probabilistically place students into profiles of mastered skills (called attributes) • Facilitate fine-grained reporting of skill mastery to support instructional decision-making • Enable the examination of skill dependencies or hierarchies
  3. Benefits of DCMs • Because the goal is classification, we

    can get reliable results with fewer items than a comparable scale- score assessment – Summarize mastery across skills (Thompson et al., 2019) – Longitudinal extensions (e.g., Madison & Bradshaw, 2018) • DCMs allow us to both provide instructionally relevant assessment results and answer research questions about student learning
  4. DCMs in Practice • Despite benefits, DCMs are not widely

    used in applied or operational settings – Lack of training and tools – Constraints on innovation from (U.S.) regulations and guidelines (e.g., Standards; AERA et al., 2014) • One application for today's discussion: Dynamic Learning Maps (DLM) Alternate Assessment System
  5. Dynamic Learning Maps • 3–12 alternate assessment for students with

    significant cognitive disabilities – Assessments in English language arts, mathematics, and science • Academic content available at multiple levels of complexity for each standard • Results are reported as a profile of mastered skills
  6. Example Science Results Student’s performance in high school science Essential

    Elements is summarized below. This information is based on all of the D tests Student took during Spring 2023. Student was assessed on 9 out of 9 Essential Elements and 3 out of 3 Domains expecte high school science. Demonstrating mastery of a Level during the assessment assumes mastery of all prior Levels in the Essential Element. This ta describes what skills your child demonstrated in the assessment and how those skills compare to grade level expectations. Estimated Mastery Level Essential Element 1 2 3 (Target) SCI.EE.HS.PS1-2 Recognize a change during a chemical reaction Identify changes during a chemical reaction Use evidence to explain patterns in chemical properties SCI.EE.HS.PS2-3 Identify safety devices that lessen force Use data to compare the e ect of safety devices Evaluate safety devices and minimize force SCI.EE.HS.PS3-4 Compare the temperatures of two liquids Compare the temperatures of liquids before and after mixing Investigate and predict the temperatures of liquids before and after mixing SCI.EE.HS.LS1-2 Recognize that organs have di erent functions Identify which organs have a specific function Model the organization and interaction of organs SCI.EE.HS.LS2-2 Identify food and shelter needs for wildlife Recognize the relationship between population size and resources Explain the dependence of an animal population on other organisms SCI.EE.HS.LS4-2 Match species to their environments Identify factors that require special traits to survive Explain how traits allow a species to survive Levels mastered this year No evidence of mastery on this Essential Element Essential Element not tested
  7. Example DLM Hierarchy • Investigate and predict the change in

    motion of objects based on the forces acting on those objects Identify ways to change motion. Investigate and identify ways to change motion. Investigate and predict changes in motion. Level 1 Level 2 Level 3
  8. Evaluating Skill Hierarchies With DCMs • Thompson & Nash (2022):

    A diagnostic framework for the empirical evaluation of learning maps • Three methods for evaluating skill hierarchies using DCMs • Descriptions and examples using Dynamic Learning Maps
  9. Method 1: Patterns of Mastery Profiles • Estimate two models

    – LCDM (Henson et al., 2009): Saturated; all possible profiles – HDCM (Templin & Bradshaw, 2014): Constrained; only hypothesized profiles • Evaluate model fit – Posterior predictive model checks – Model comparisons Level 1 Level 2 Level 3 0 0 0 1 0 0 0 1 0 0 0 1 1 1 0 1 0 1 0 1 1 1 1 1
  10. Method 1: Flagging Criteria • Model fit evaluated using posterior

    predictive checks of the raw score distribution (Thompson, 2019) • Sufficient fit for the HDCM (constrained model) indicates support for the hierarchy • Flags when the LCDM shows sufficient model fit and the HDCM does not – Indicates the unexpected classes are needed to fully represent the data
  11. Method 1: Limitations • The number of profiles in the

    saturated model (LCDM) increases exponentially with the number of attributes • Need students in all profiles to get reliable parameter estimates • Extremely small classes can cause estimation problems (Templin & Bradshaw, 2014)
  12. Method 2: Patterns of Attribute Mastery • Estimate each skill

    as a separate 1-attribute DCM • Make mastery determinations for each assessed skills • Look for unexpected patterns in attribute mastery Student Level 1 Level 2 Level 3 1 1 1 — 2 1 0 0 3 — 1 1 4 1 0 1 5 0 0 0 6 1 — — … … … …
  13. Method 2: Flagging Criteria • Multiple flagging methods – Total

    number of students with unexpected pattern across assessed attributes – Total number of reversals for a specific pair of attributes • Actual thresholds for flagging depend on characteristics of the assessment – Simulation studies to determine an expected number of reversals
  14. Method 2: Example Output Overall, 10% of students had an

    unexpected pattern (Threshold: 14%) 30% of students testing on Levels 2 and 3 had an unexpected pattern (Threshold: 24%)
  15. Method 2: Limitations • No direct test of relationships between

    attributes • Number of models to estimate increases with the number of attributes • Additional analyses needed to set reasonable thresholds for flagging unexpected patterns
  16. Method 3: Patterns of Attribute Difficulty • Group students into

    cohorts • Measure attribute difficulty using average p-values of items for each cohort • Within each cohort, p- values should decrease at higher hierarchy levels
  17. Method 3: Flagging Criteria • Calculate Cohen’s h effect size

    for the difference in p-values – Subtract lower level from higher level (e.g., Level 3 − Level 2) – Difference should be negative (i.e., Level 3 should have a lower p-value) • Flag instances where Cohen’s h ≥ 0.2 – Moderate or larger effect in unexpected direction
  18. Method 3: Limitations • Not a DCM-based model – p-values

    as a proxy for attribute difficulty • No direct test of attribute relationships • Potential violations of the hierarchy must be inferred from patterns of flags across student cohorts
  19. Revisiting Our Hierarchy • Results indicated that students could be

    proficient on Level 3 without being proficient on Level 2 Identify ways to change motion. Investigate and identify ways to change motion. Investigate and predict changes in motion.
  20. Alternate Skill Hierarchy • Multiple pathways to Level 3 proficiency

    Identify ways to change motion. Investigate and identify ways to change motion. Investigate and predict changes in motion.
  21. Summary • DCM framework provides multiple methods for analyzing attribute

    hierarchies with DCMs – Complementary strengths and weakness – Can be adapted to non-linear relationships • DCMs are a powerful tool for understanding student learning and providing instructionally relevant results for students
  22. 26 American Educational Research Association (AERA), American Psychological Association, &

    National Council on Measurement in Education. (2014). Standards for educational and psychological testing. American Educational Research Association. https://www.testingstandards.net/open-access-files.html Henson, R. A., Templin, J. L., & Willse, J. T. (2009). Defining a family of cognitive diagnosis models using log-linear models with latent variables. Psychometrika, 74(2), 191–210. https://doi.org/10.1007/s11336-008-9089-5 Madison, M. J., & Bradshaw, L. P. (2018). Assessing growth in a diagnostic classification model framework. Psychometrika, 83(4), 963-990. https://doi.org/10.1007/s11336-018-9638-5 Templin, J., & Bradshaw, L. (2014). Hierarchical diagnostic classification models: A family of models for estimating and testing attribute hierarchies. Psychometrika, 79(2), 317–339. https://doi.org/10.1007/s11336-013-9362-0 Thompson, W. J. (2019). Bayesian psychometrics for diagnostic assessments: A proof of concept (Research Report No. 19-01). University of Kansas; Accessible Teaching, Learning, and Assessment Systems. https://doi.org/10.35542/osf.io/jzqs8 Thompson, W. J., Clark, A. K., & Nash, B. (2019). Measuring the reliability of diagnostic mastery classifications at multiple levels of reporting. Applied Measurement in Education, 32(4), 298–309. https://doi.org/10.1080/08957347.2019.1660345 [Preprint] Thompson, W. J. & Nash, B. (2022). A diagnostic framework for the empirical evaluation of learning maps. Frontiers in Education, 6, 714736. https://doi.org/10.3389/feduc.2021.714736 References