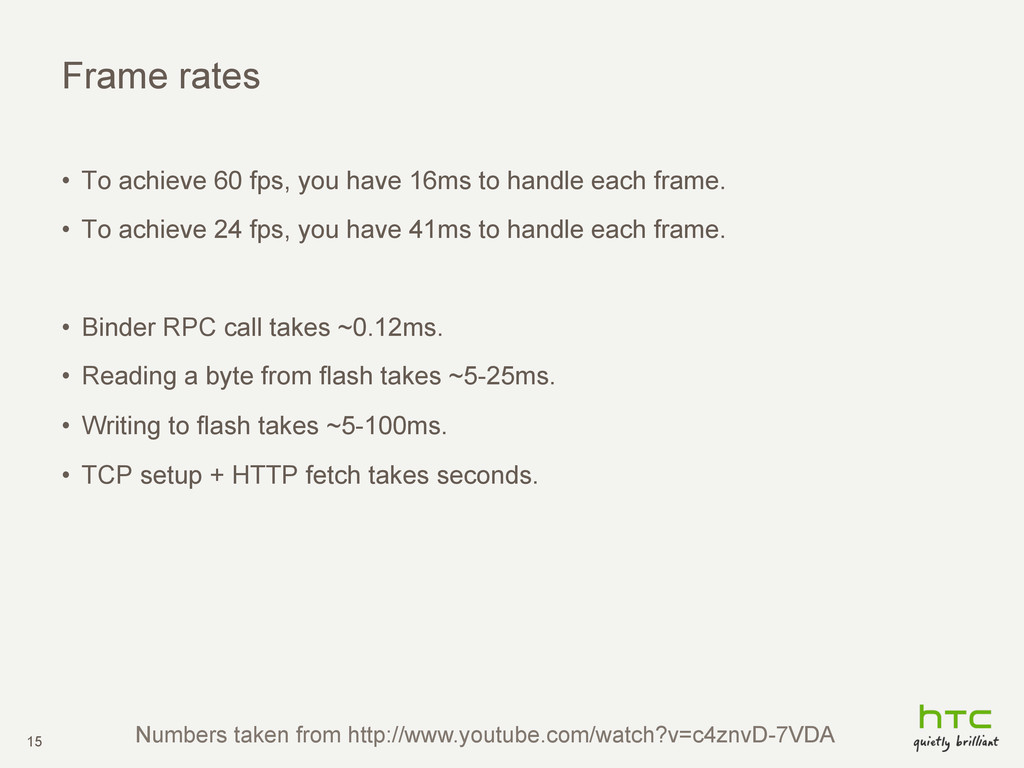
16ms to handle each frame. • To achieve 24 fps, you have 41ms to handle each frame. • Binder RPC call takes ~0.12ms. • Reading a byte from flash takes ~5-25ms. • Writing to flash takes ~5-100ms. • TCP setup + HTTP fetch takes seconds. Numbers taken from http://www.youtube.com/watch?v=c4znvD-7VDA
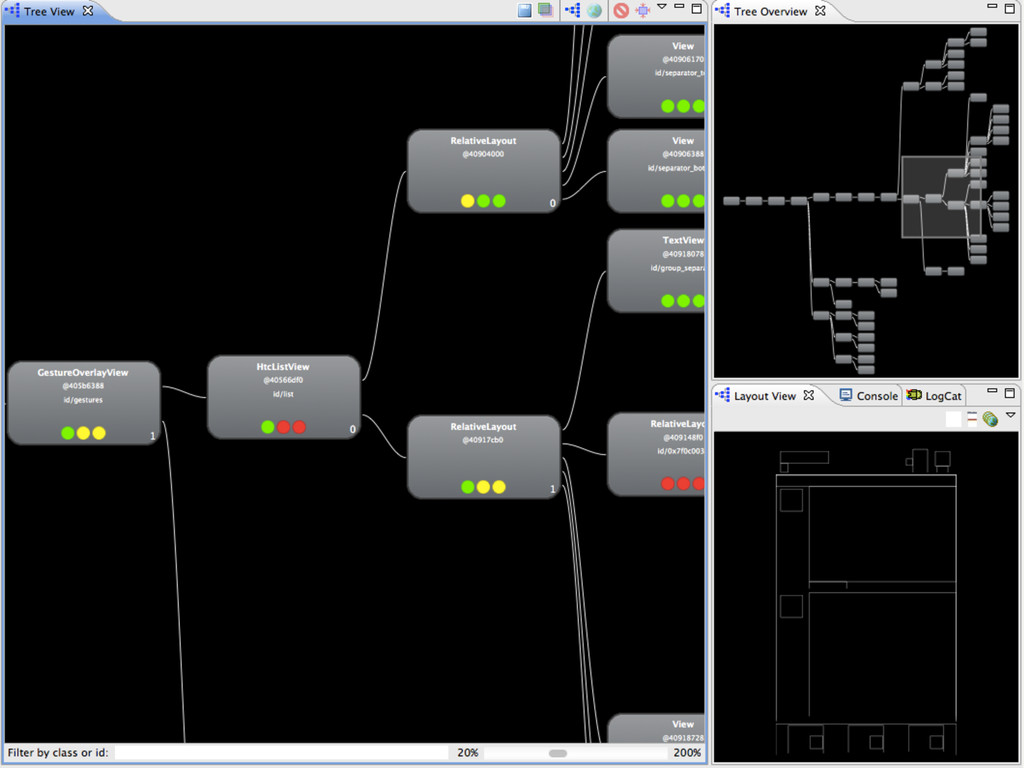
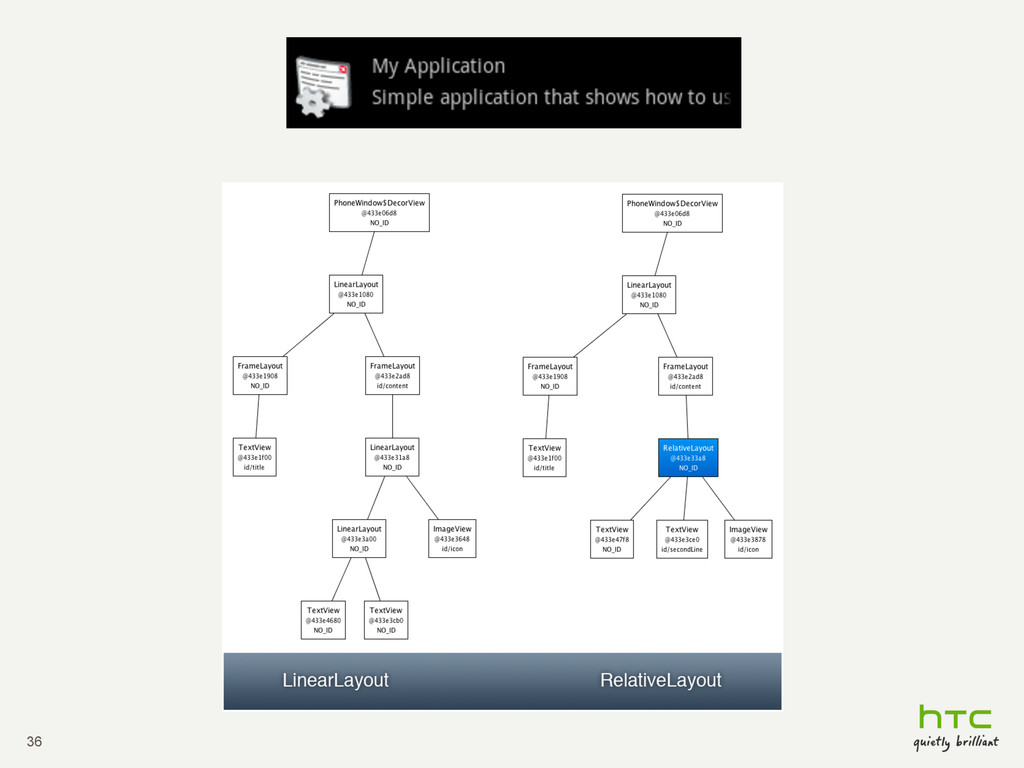
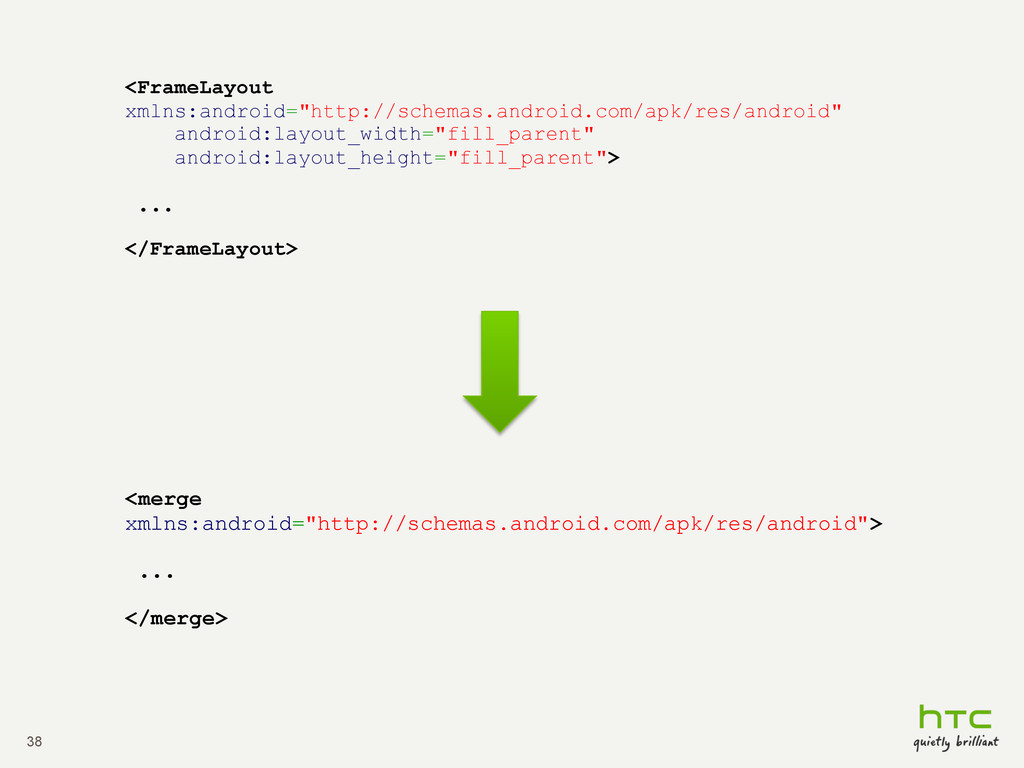
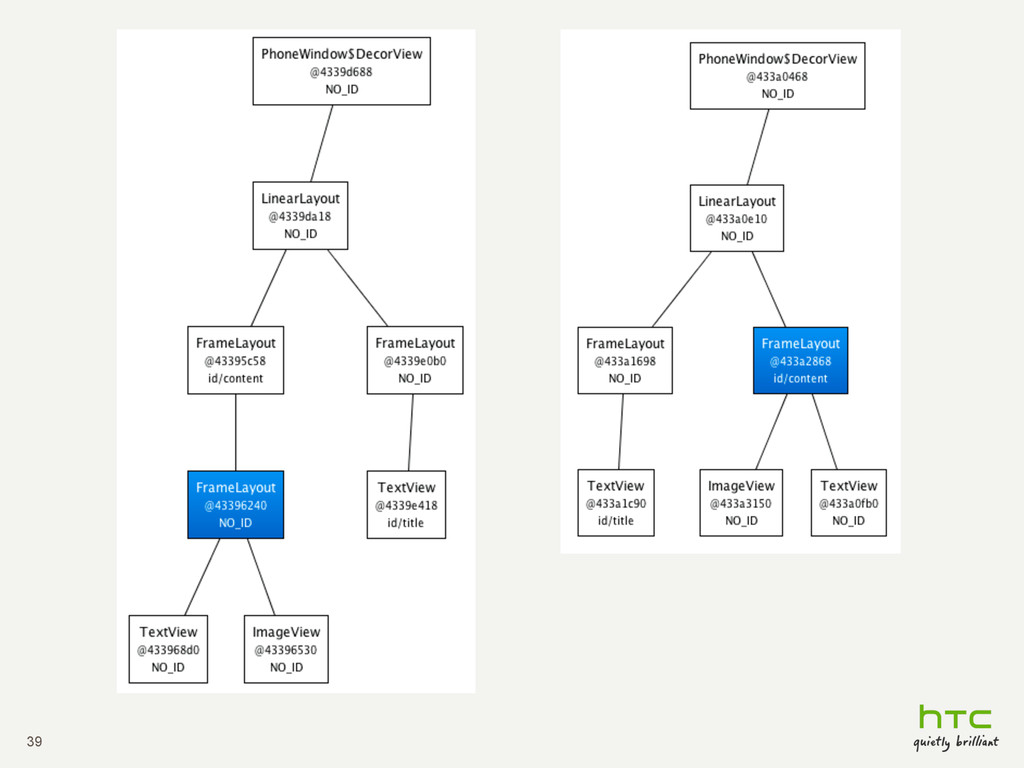
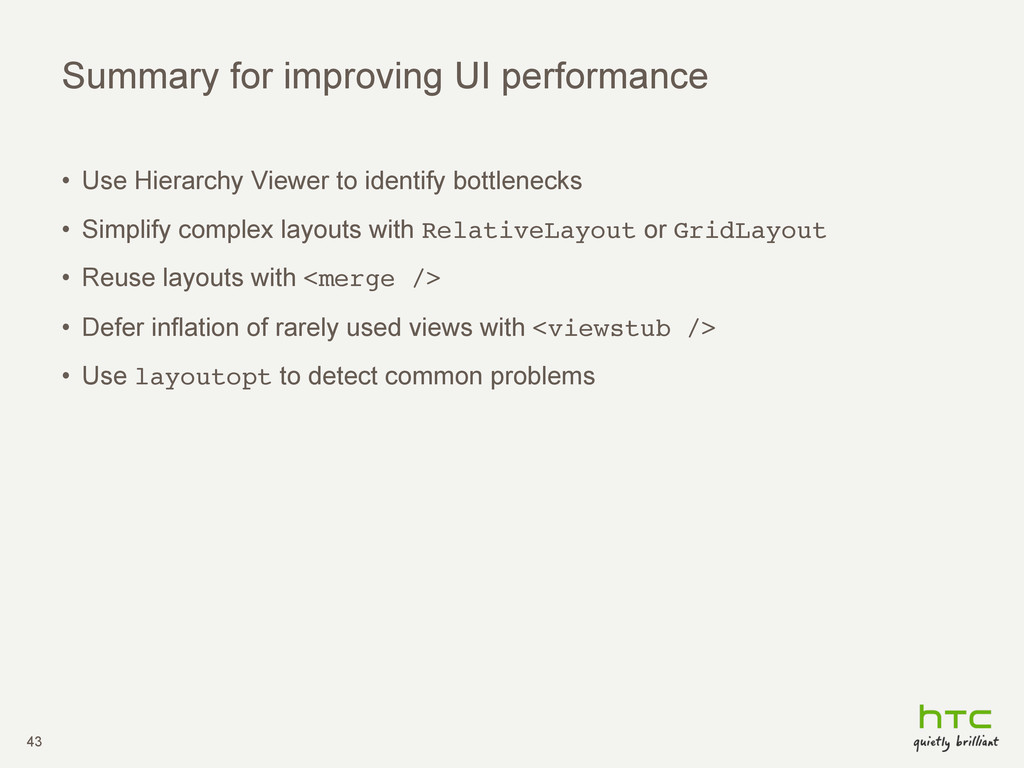
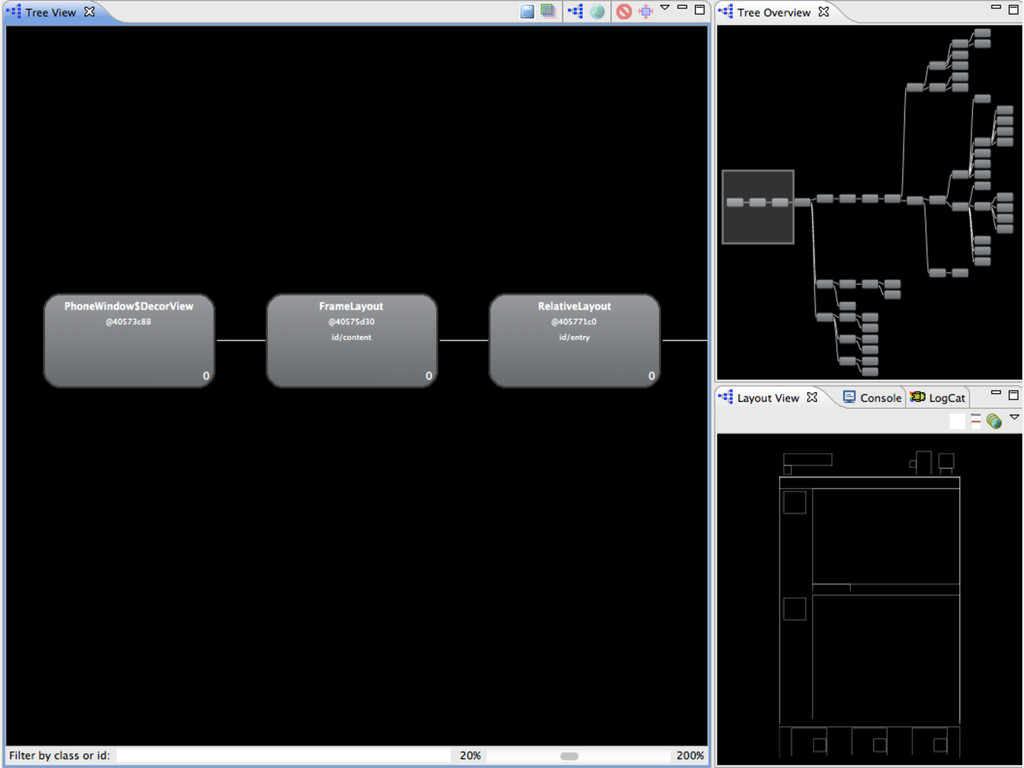
to identify bottlenecks • Simplify complex layouts with RelativeLayout or GridLayout! • Reuse layouts with <merge />! • Defer inflation of rarely used views with <viewstub />! • Use layoutopt to detect common problems
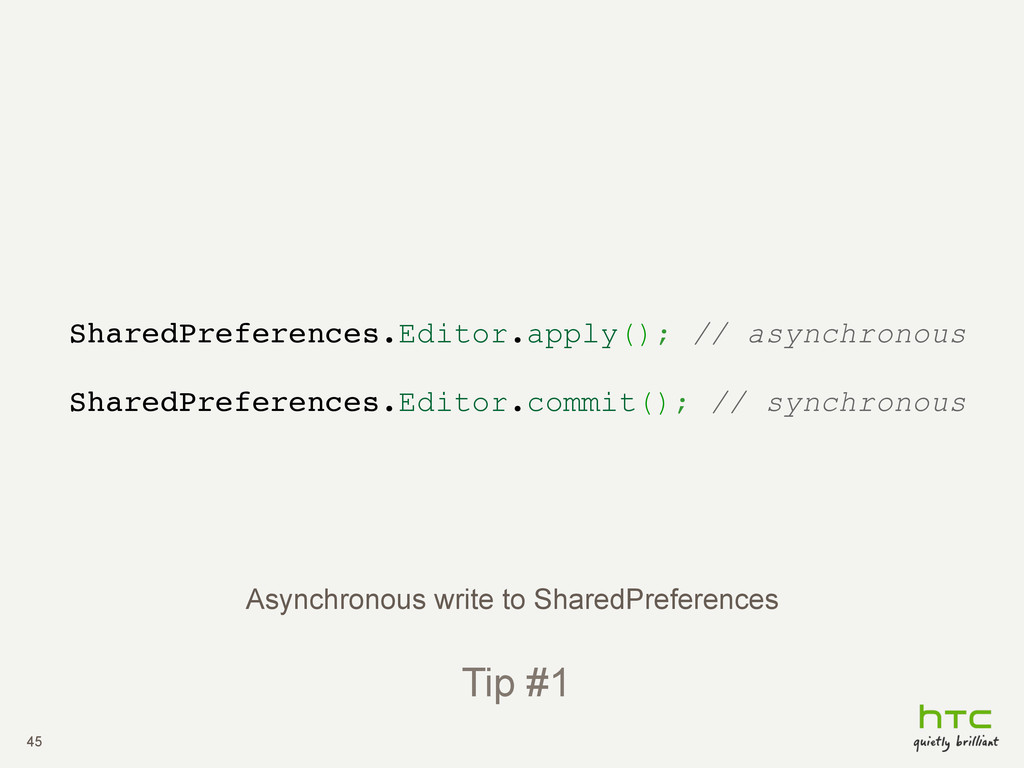
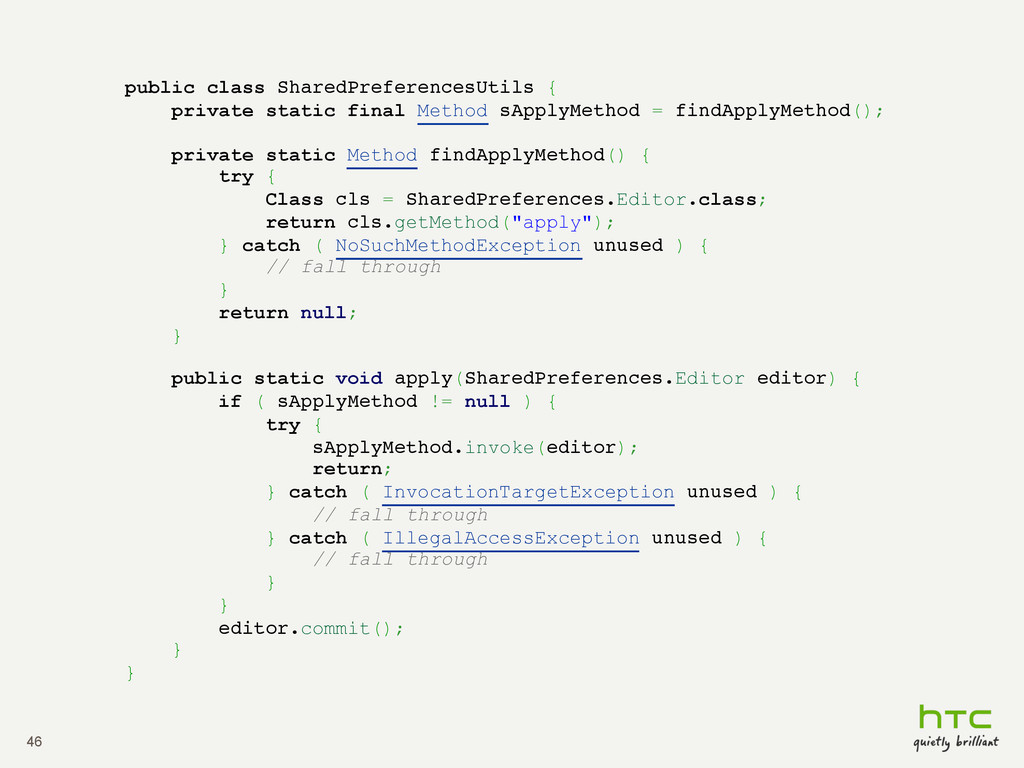
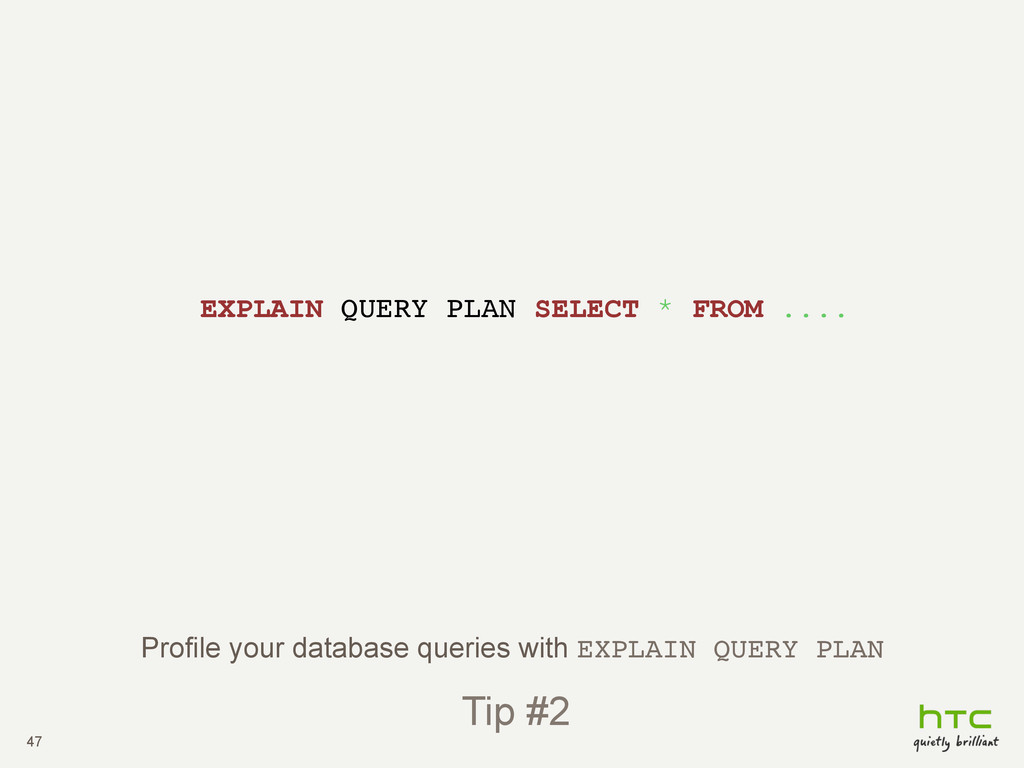
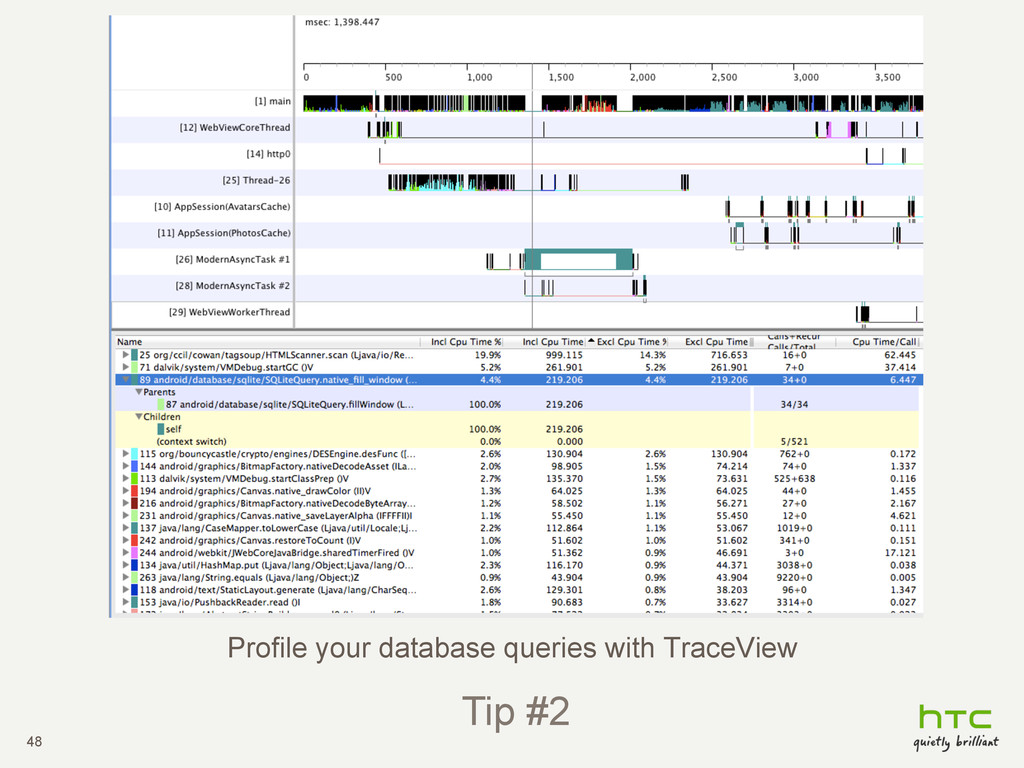
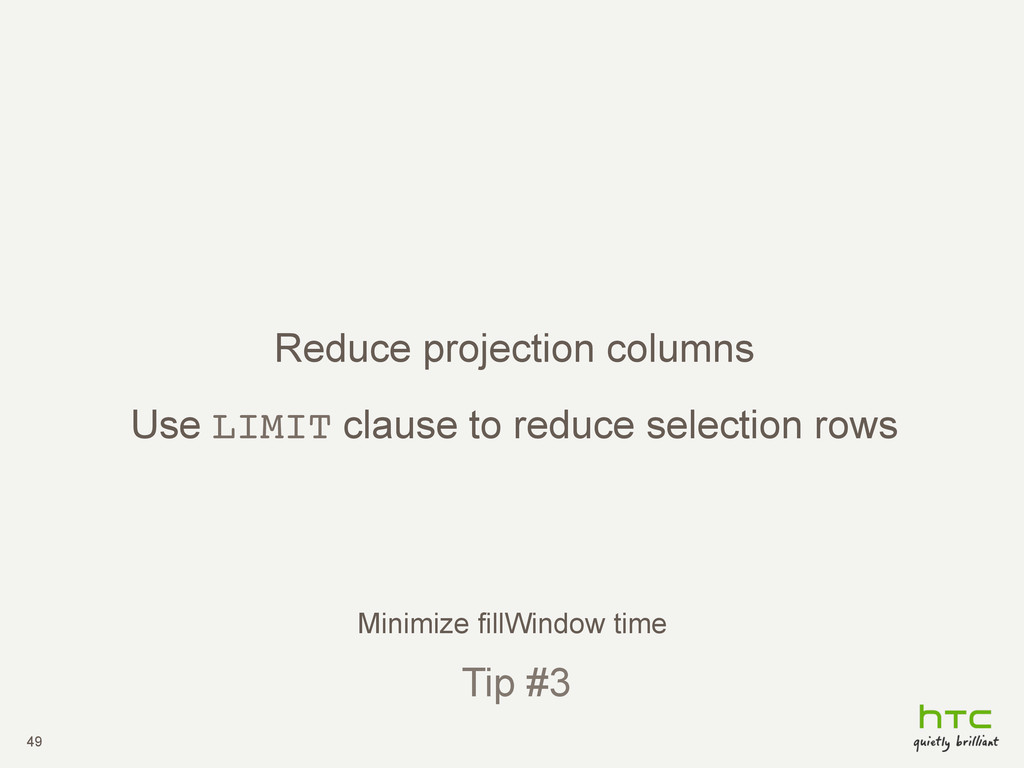
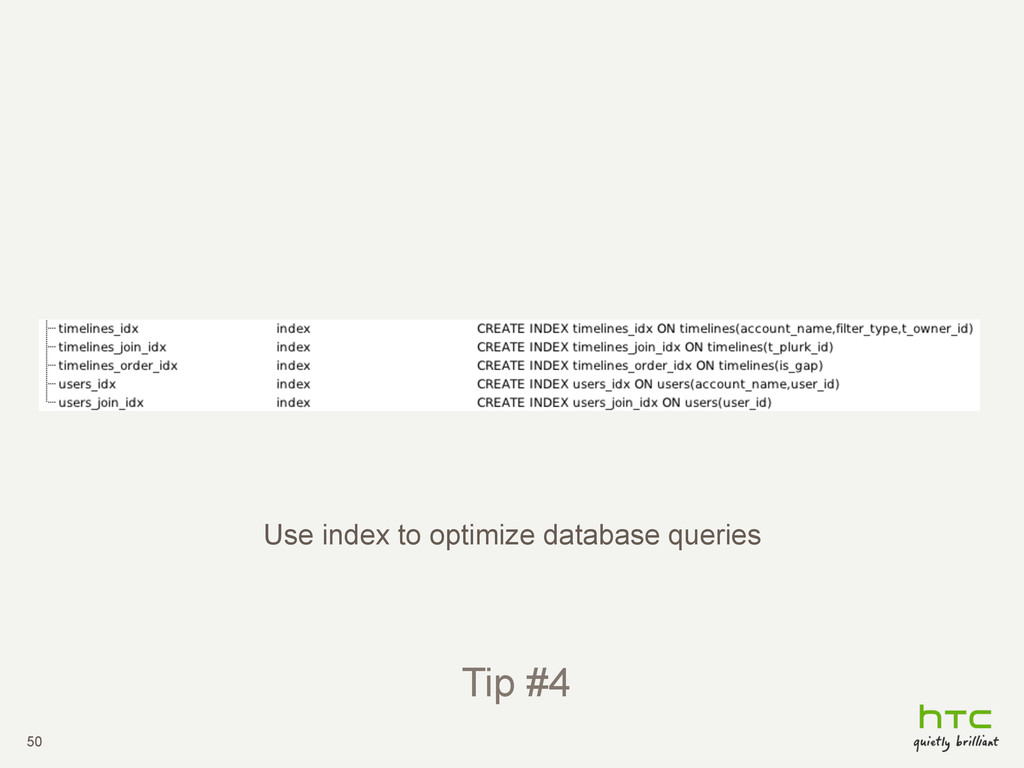
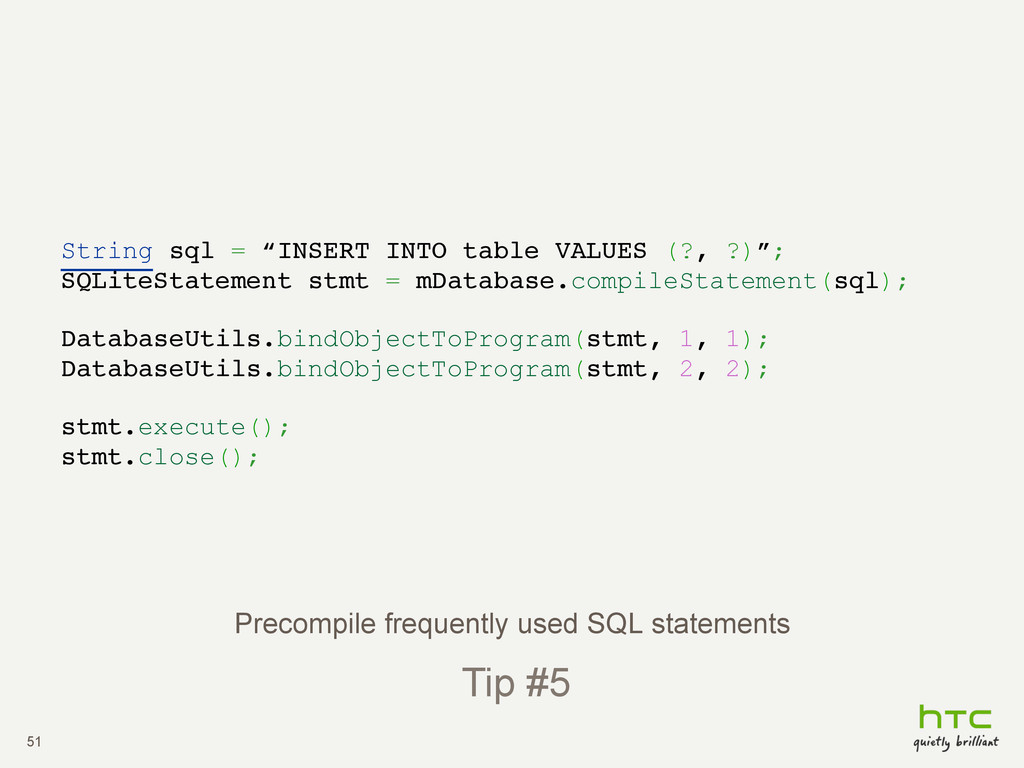
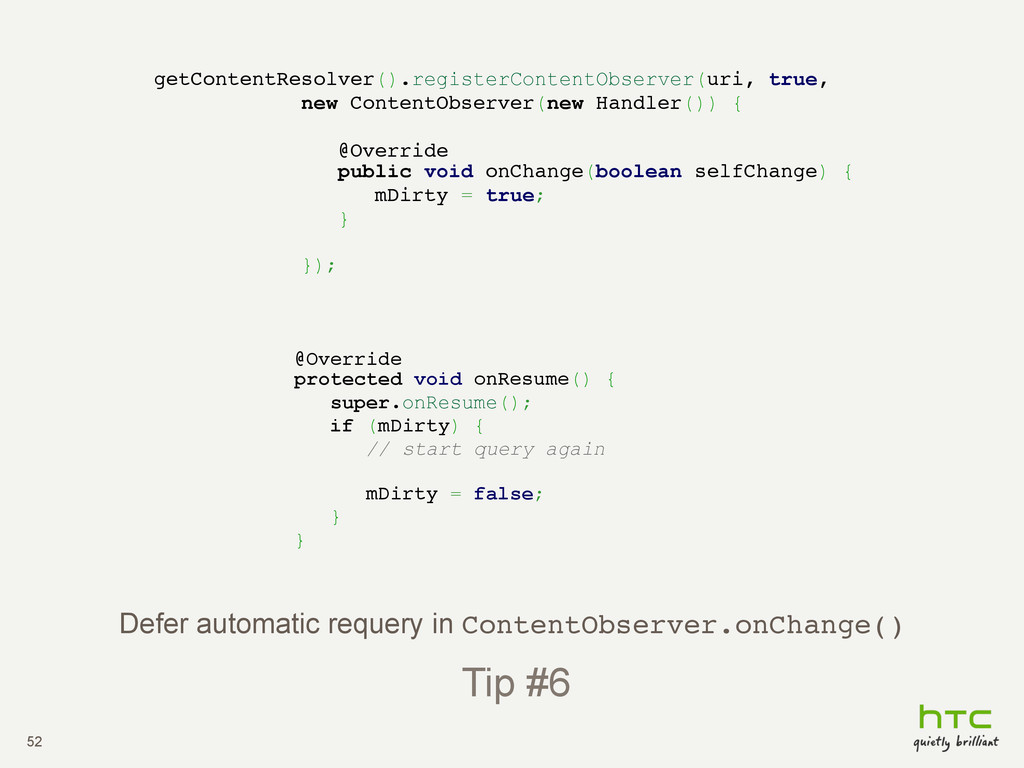
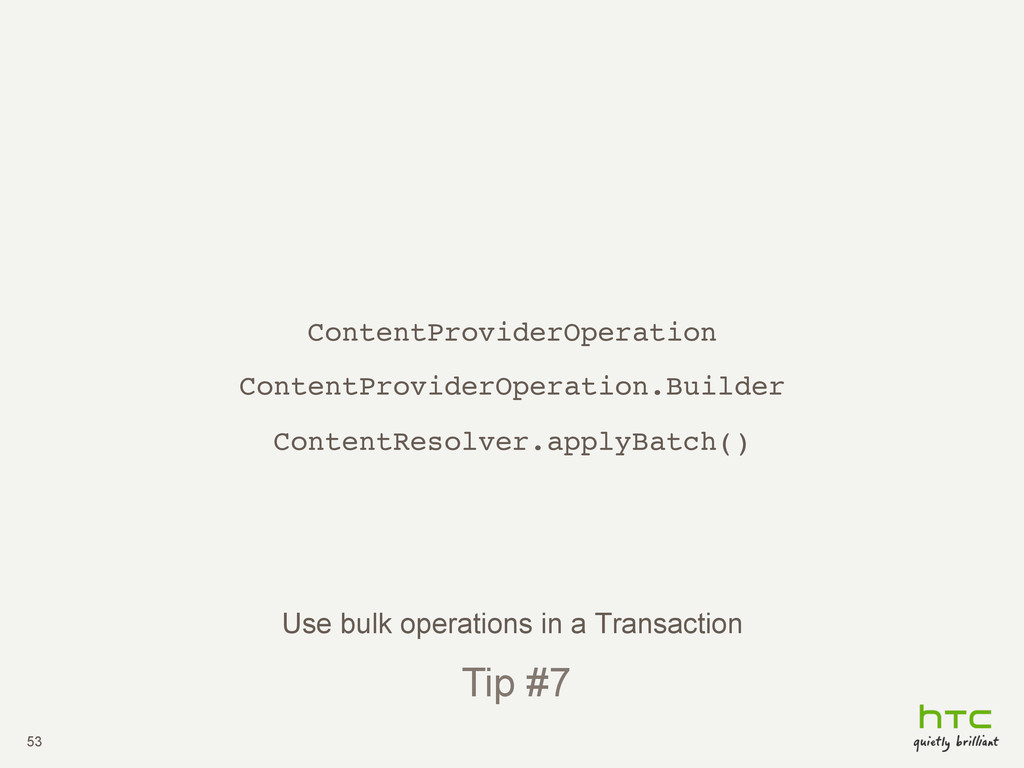
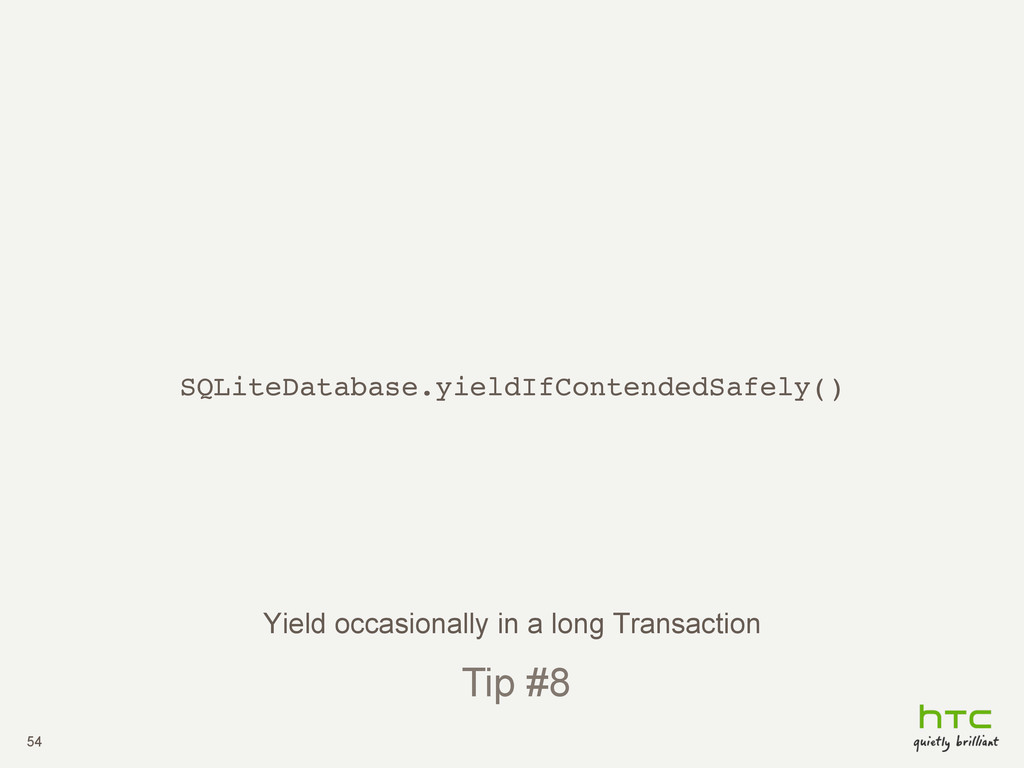
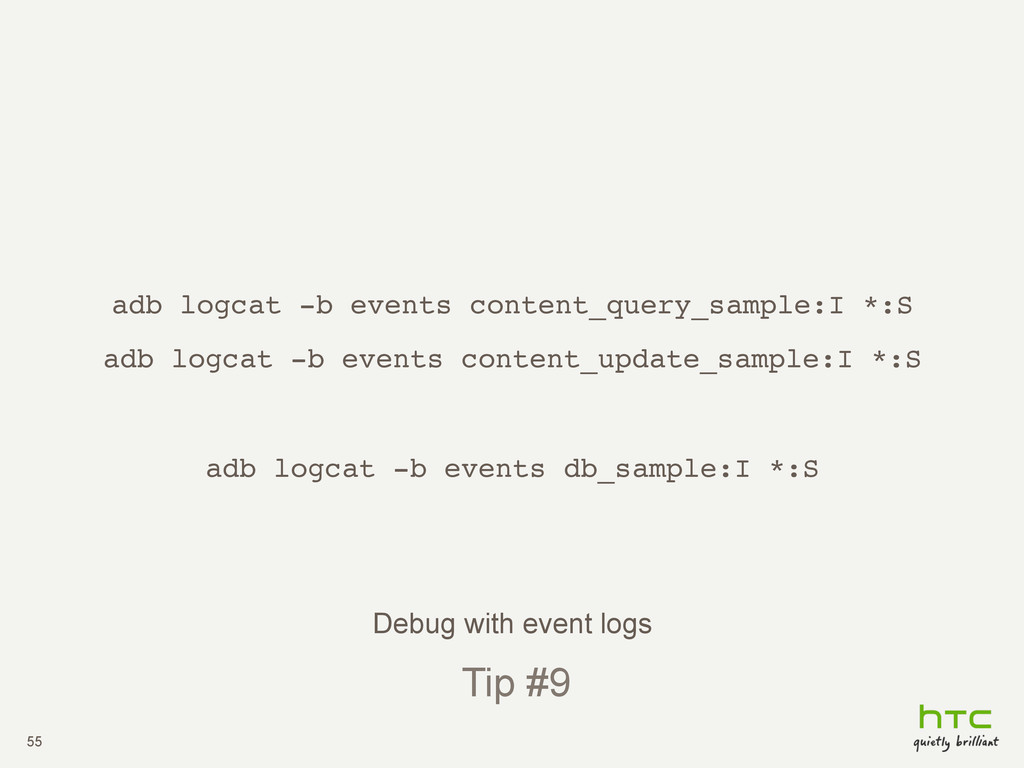
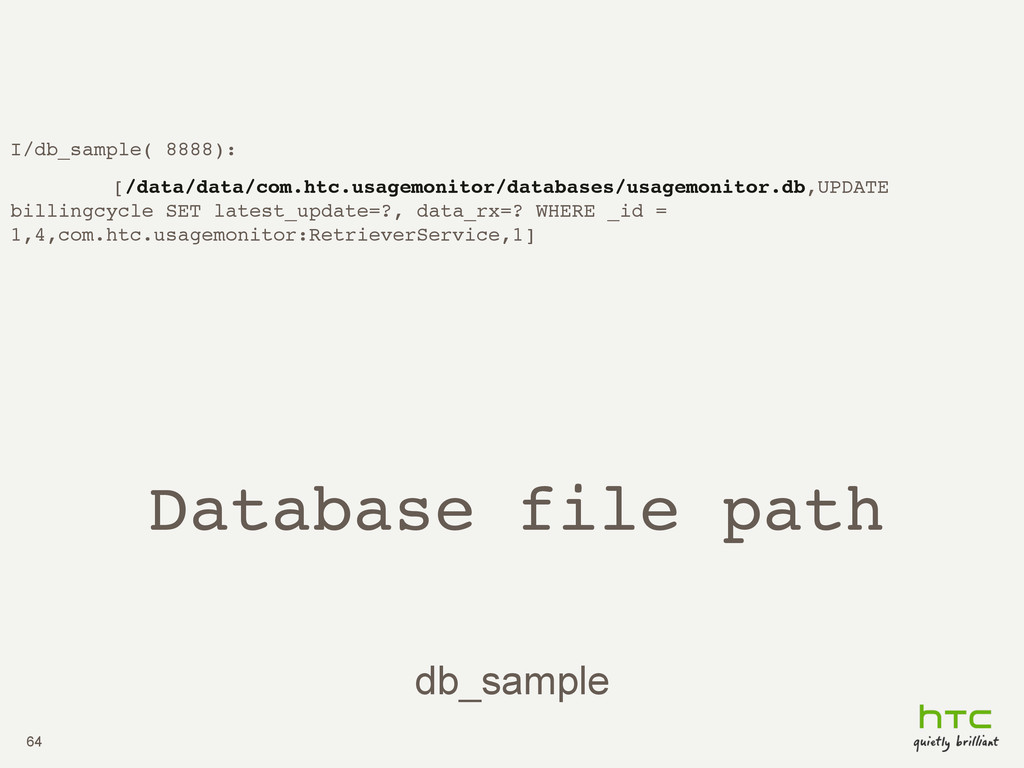
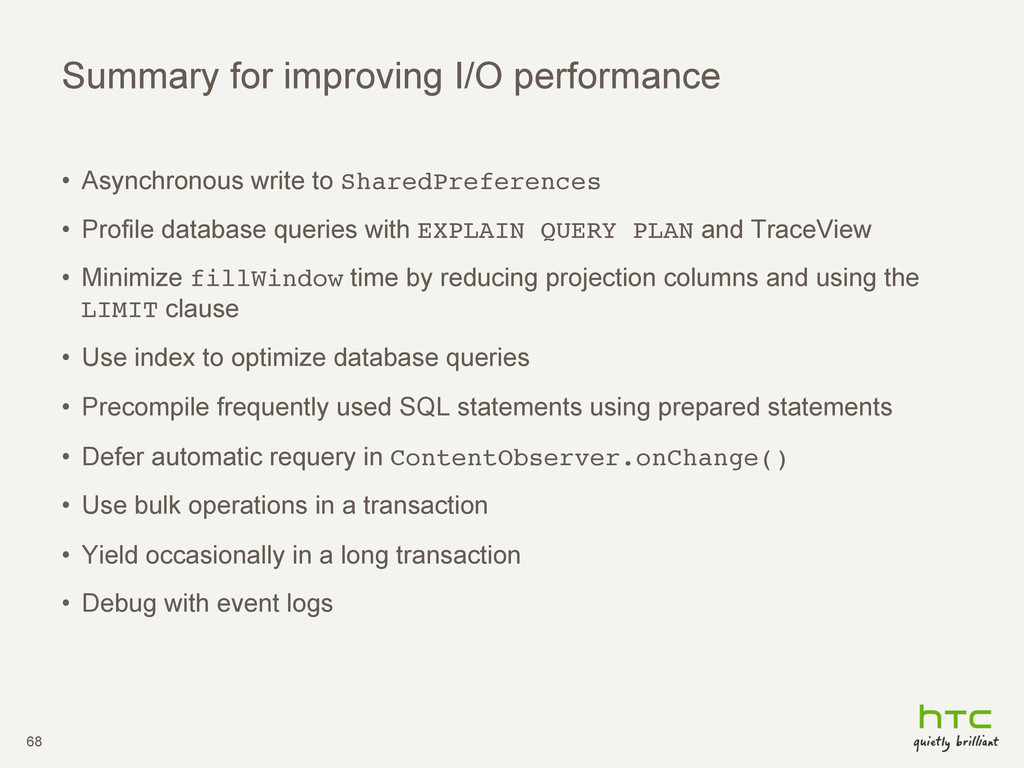
SharedPreferences! • Profile database queries with EXPLAIN QUERY PLAN and TraceView • Minimize fillWindow time by reducing projection columns and using the LIMIT clause • Use index to optimize database queries • Precompile frequently used SQL statements using prepared statements • Defer automatic requery in ContentObserver.onChange()! • Use bulk operations in a transaction • Yield occasionally in a long transaction • Debug with event logs
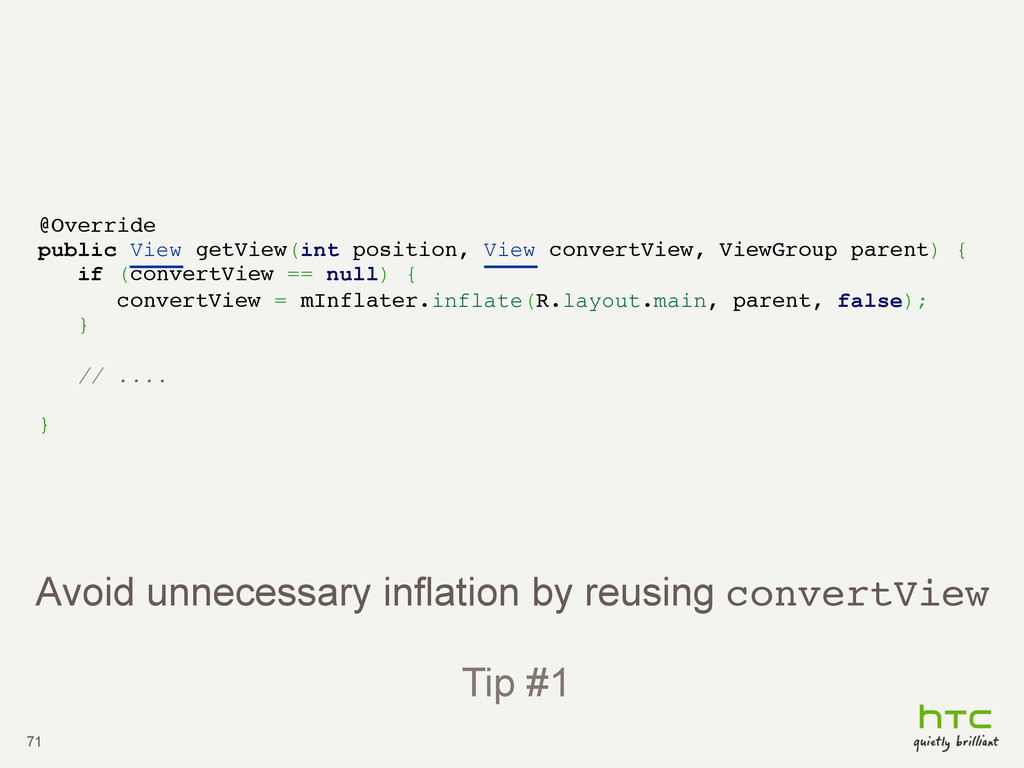
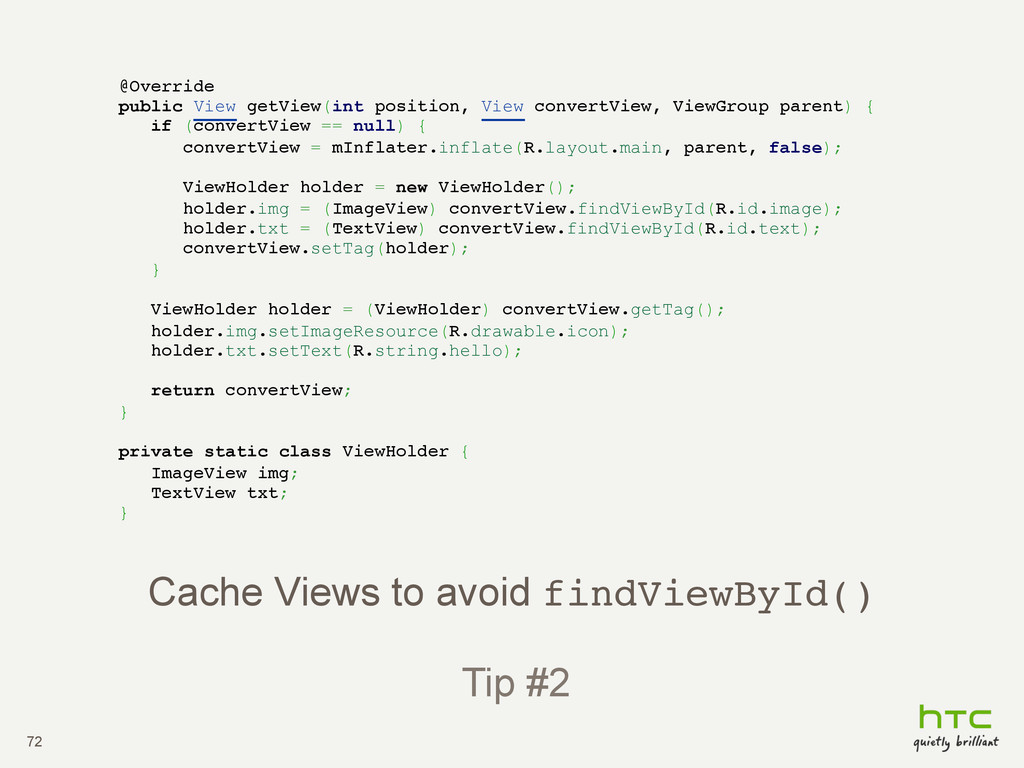
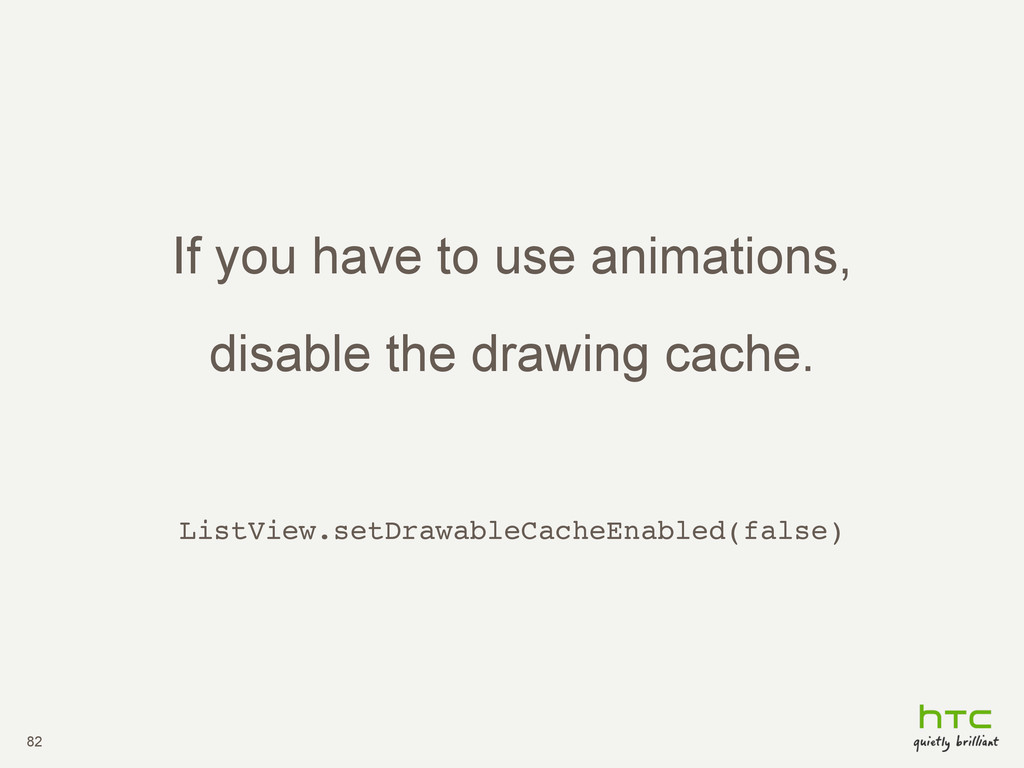
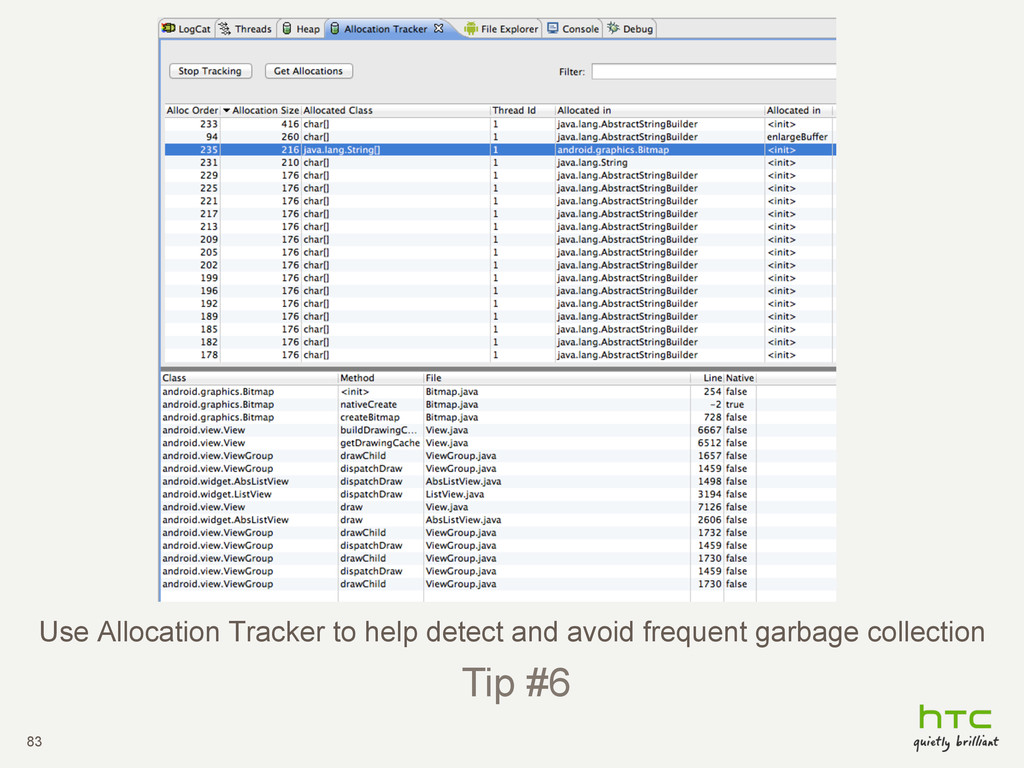
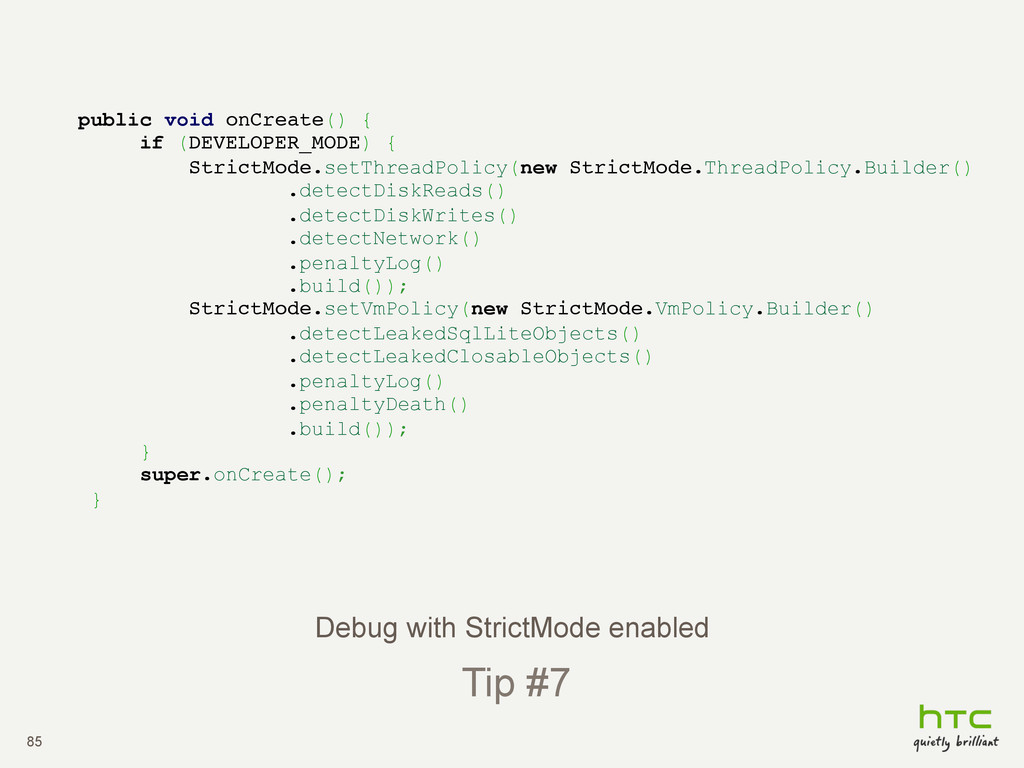
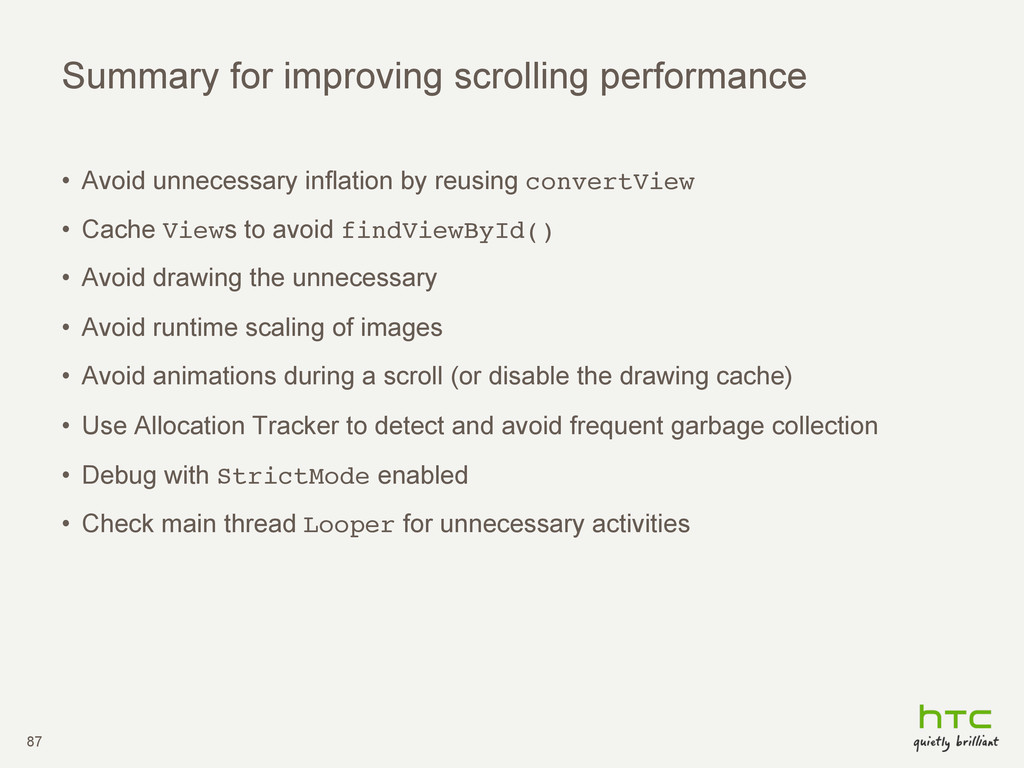
by reusing convertView! • Cache Views to avoid findViewById()! • Avoid drawing the unnecessary • Avoid runtime scaling of images • Avoid animations during a scroll (or disable the drawing cache) • Use Allocation Tracker to detect and avoid frequent garbage collection • Debug with StrictMode enabled • Check main thread Looper for unnecessary activities!
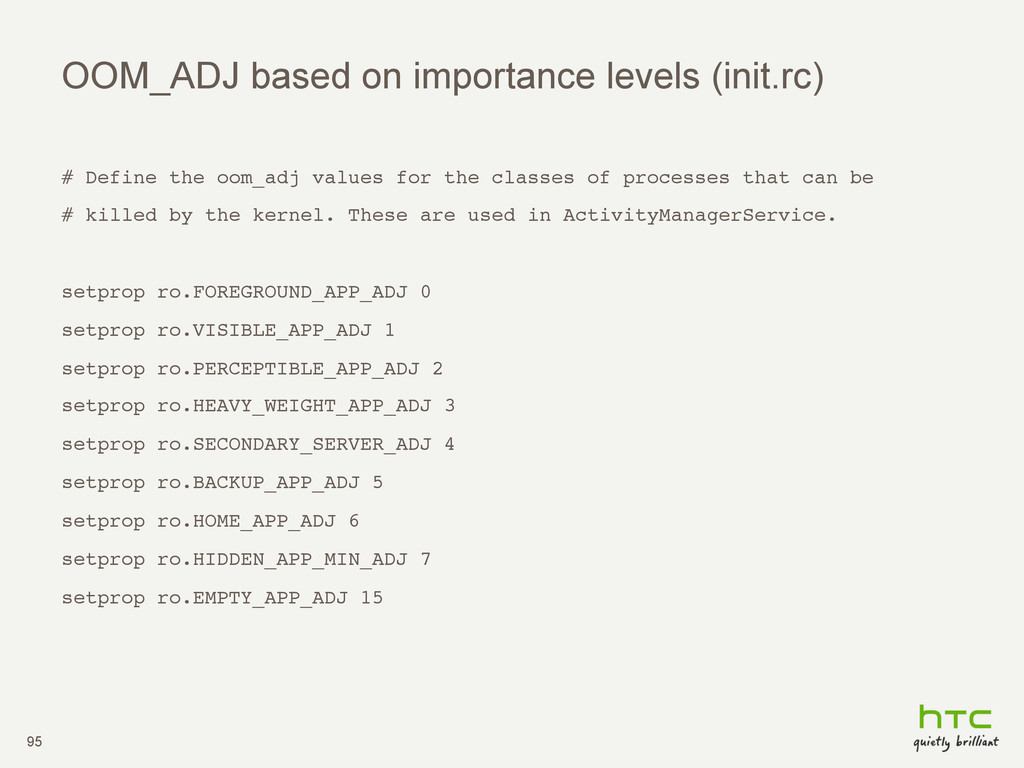
values for the classes of processes that can be ! # killed by the kernel. These are used in ActivityManagerService. ! ! setprop ro.FOREGROUND_APP_ADJ 0 ! setprop ro.VISIBLE_APP_ADJ 1 ! setprop ro.PERCEPTIBLE_APP_ADJ 2 ! setprop ro.HEAVY_WEIGHT_APP_ADJ 3 ! setprop ro.SECONDARY_SERVER_ADJ 4 ! setprop ro.BACKUP_APP_ADJ 5 ! setprop ro.HOME_APP_ADJ 6 ! setprop ro.HIDDEN_APP_MIN_ADJ 7 ! setprop ro.EMPTY_APP_ADJ 15 ! ! 95
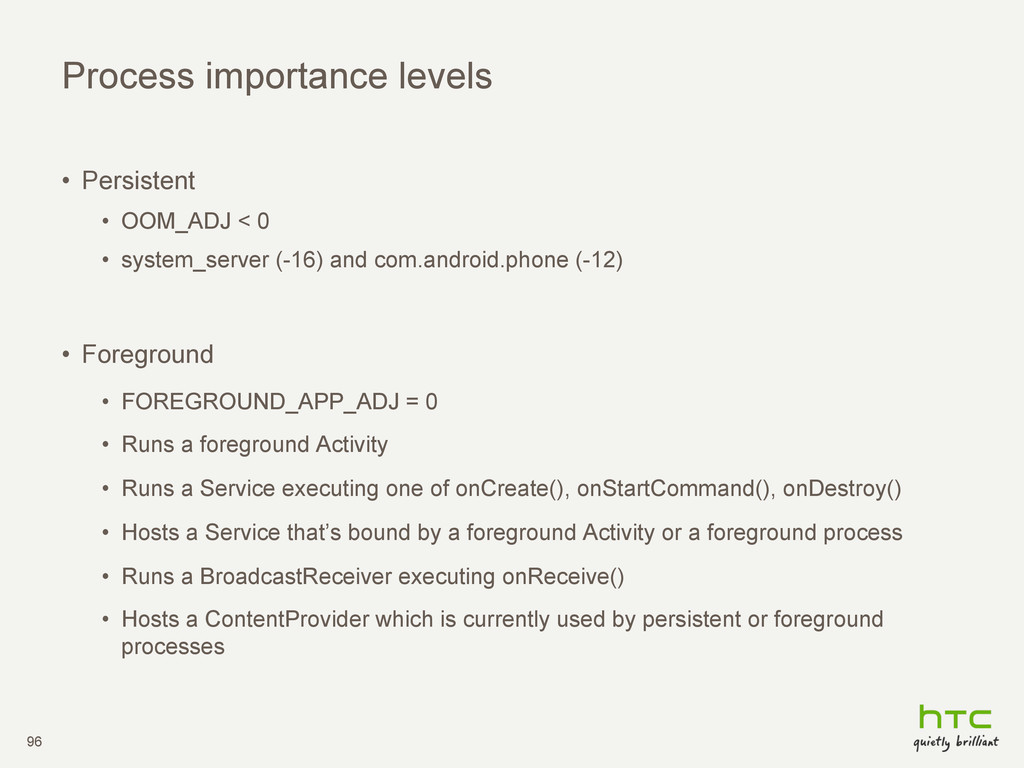
system_server (-16) and com.android.phone (-12) • Foreground • FOREGROUND_APP_ADJ = 0 • Runs a foreground Activity • Runs a Service executing one of onCreate(), onStartCommand(), onDestroy() • Hosts a Service that’s bound by a foreground Activity or a foreground process • Runs a BroadcastReceiver executing onReceive() • Hosts a ContentProvider which is currently used by persistent or foreground processes 96
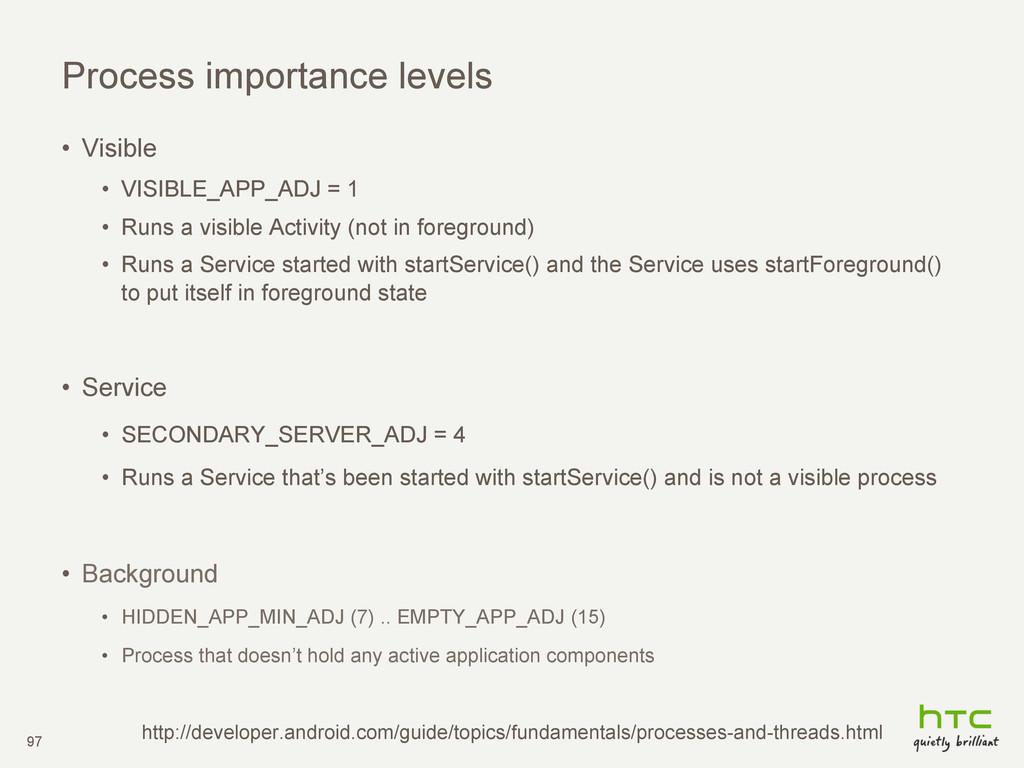
Runs a visible Activity (not in foreground) • Runs a Service started with startService() and the Service uses startForeground() to put itself in foreground state • Service • SECONDARY_SERVER_ADJ = 4 • Runs a Service that’s been started with startService() and is not a visible process • Background • HIDDEN_APP_MIN_ADJ (7) .. EMPTY_APP_ADJ (15) • Process that doesn’t hold any active application components http://developer.android.com/guide/topics/fundamentals/processes-and-threads.html 97
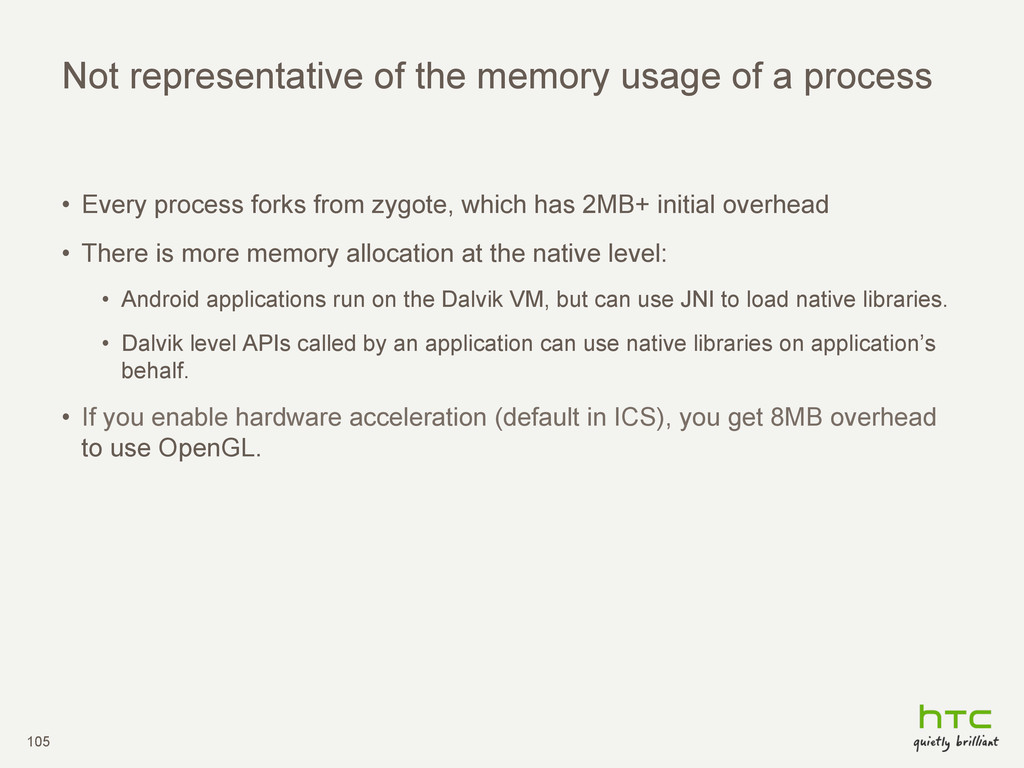
Every process forks from zygote, which has 2MB+ initial overhead • There is more memory allocation at the native level: • Android applications run on the Dalvik VM, but can use JNI to load native libraries. • Dalvik level APIs called by an application can use native libraries on application’s behalf. • If you enable hardware acceleration (default in ICS), you get 8MB overhead to use OpenGL. 105
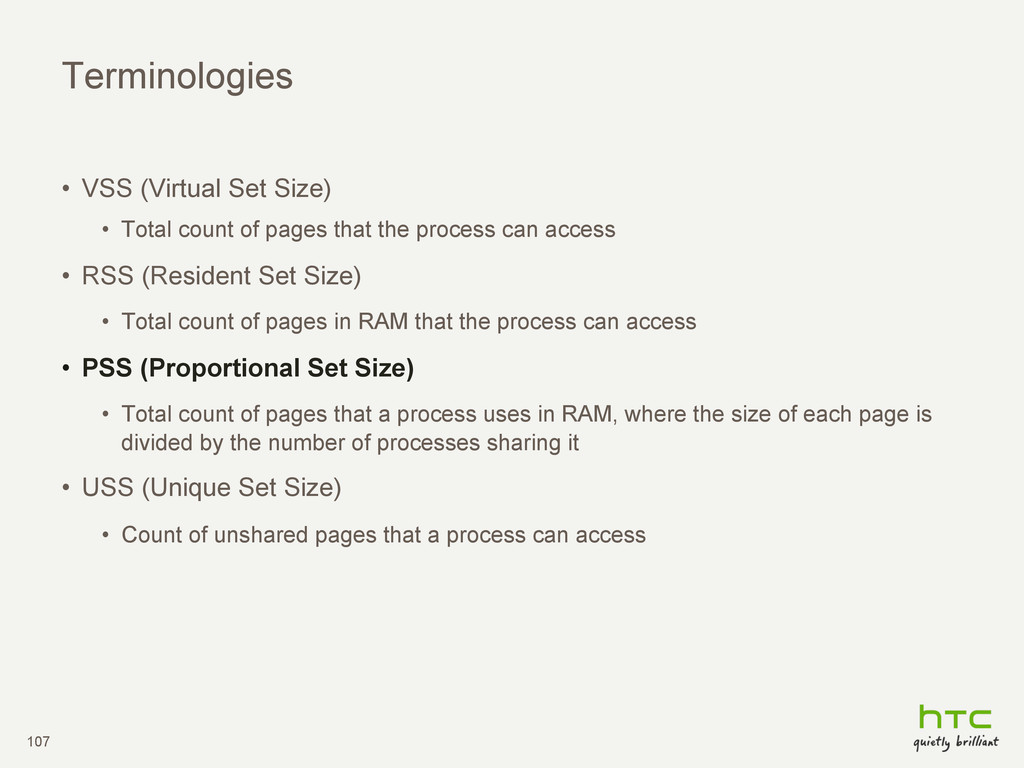
pages that the process can access • RSS (Resident Set Size) • Total count of pages in RAM that the process can access • PSS (Proportional Set Size) • Total count of pages that a process uses in RAM, where the size of each page is divided by the number of processes sharing it • USS (Unique Set Size) • Count of unshared pages that a process can access 107
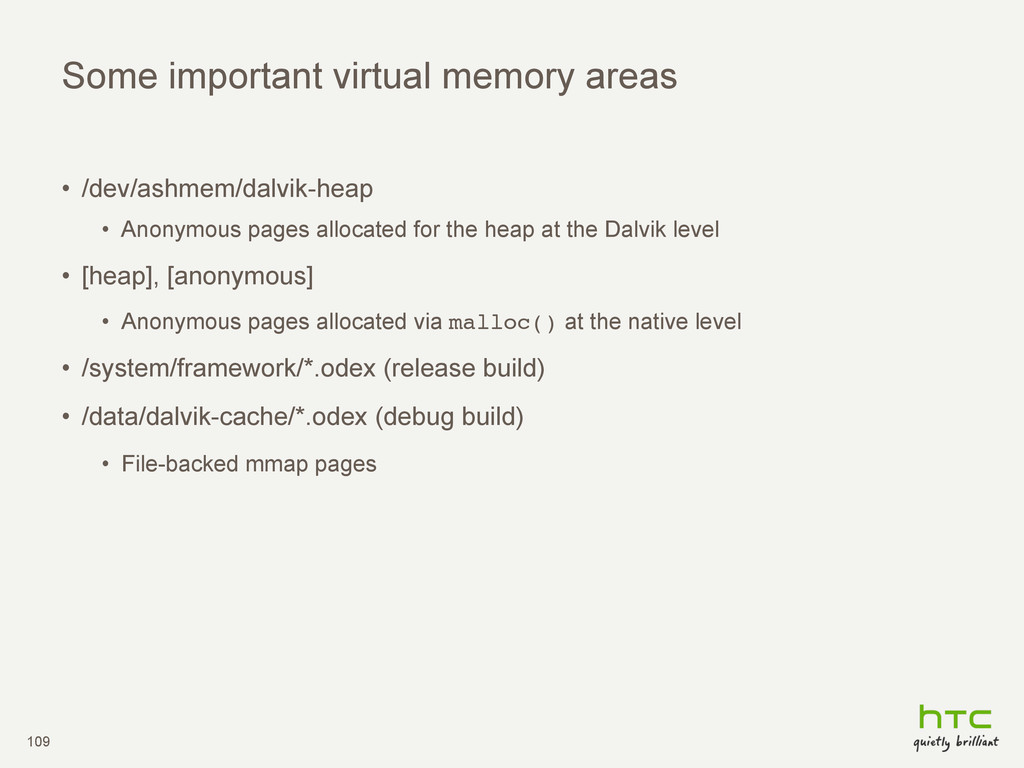
allocated for the heap at the Dalvik level • [heap], [anonymous] • Anonymous pages allocated via malloc() at the native level • /system/framework/*.odex (release build) • /data/dalvik-cache/*.odex (debug build) • File-backed mmap pages 109
inside the process that cannot be paged to disk and is not shared with any other processes • The RAM that will become available to the system when the process goes away http://stackoverflow.com/questions/2298208/how-to-discover-memory-usage-of-my-application-in-android 111
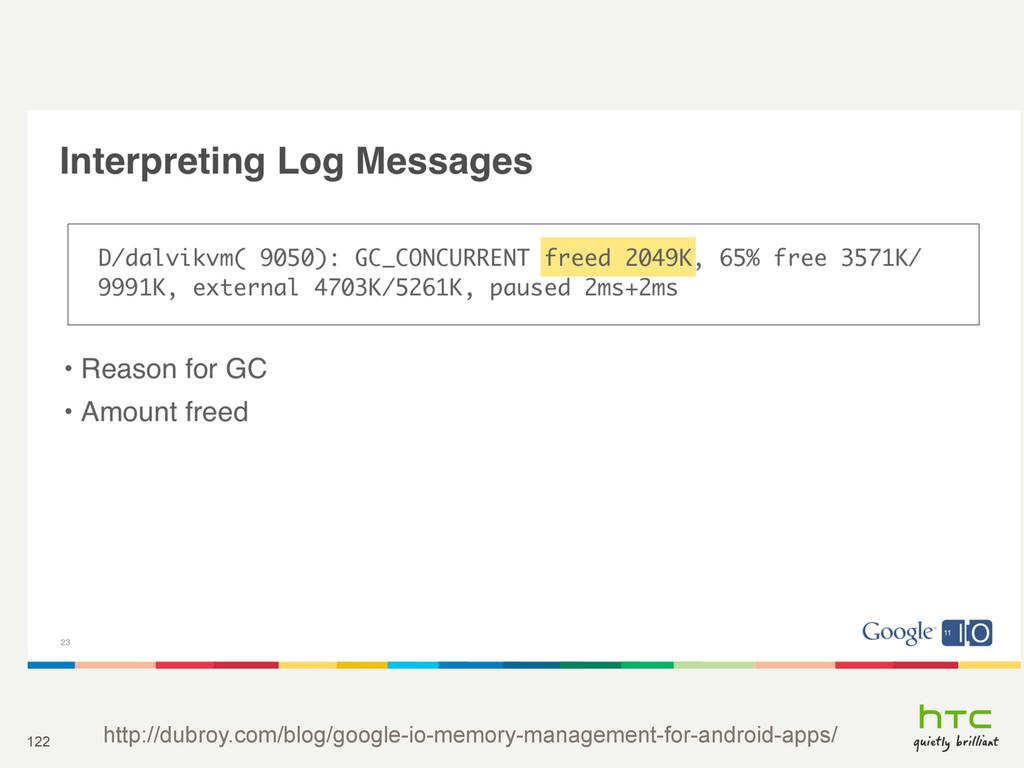
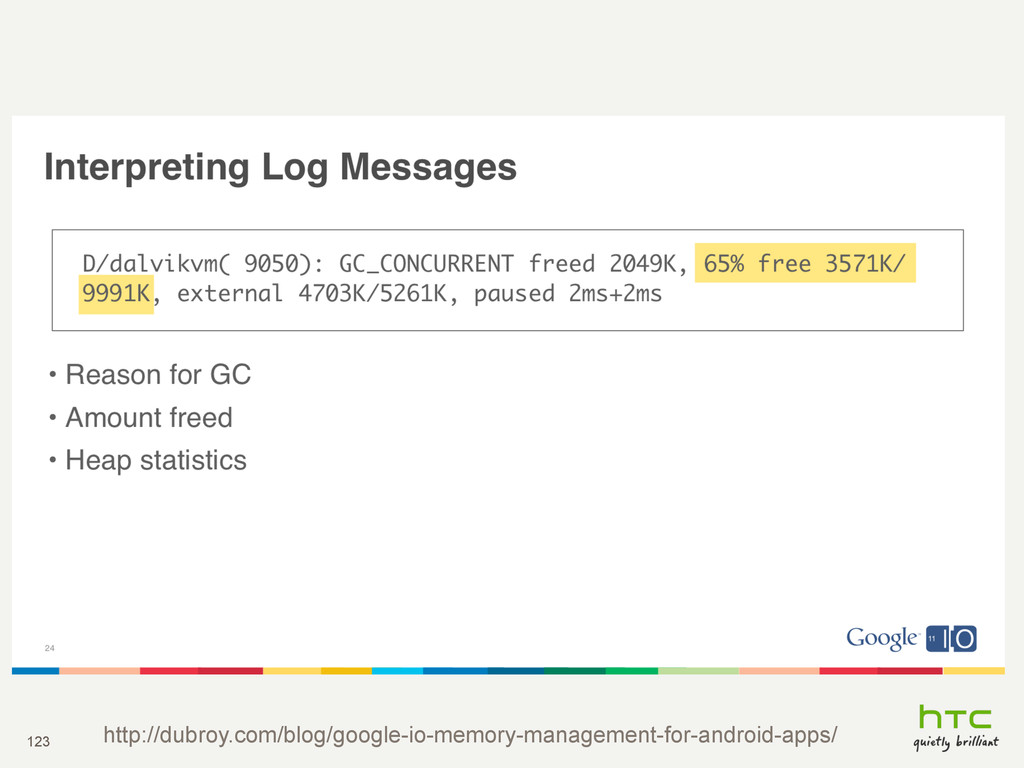
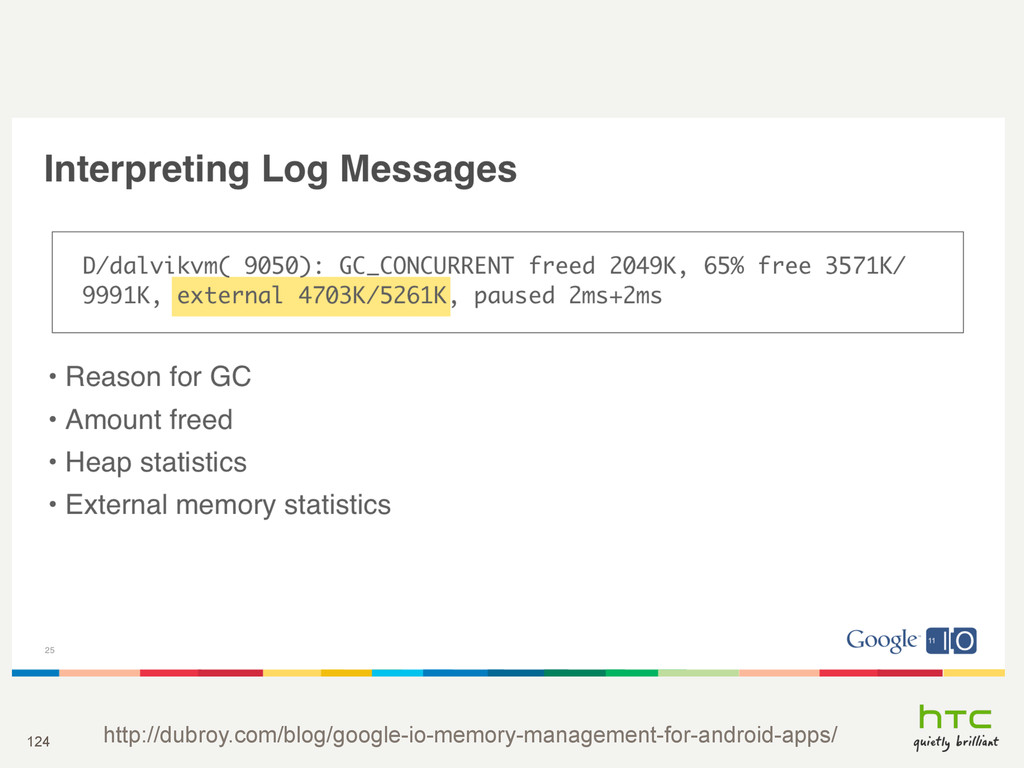
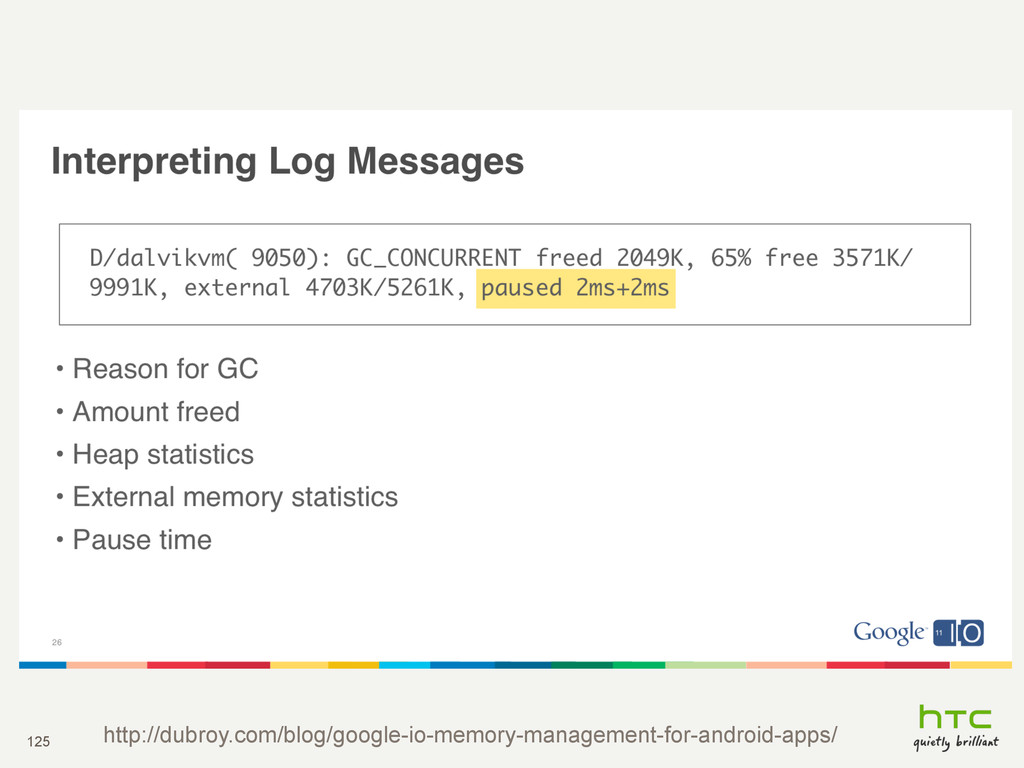
collection • Pause times often > 100ms • Gingerbread and beyond: • Concurrent (mostly) • Partial collections • Pause times usually < 5ms 113 http://dubroy.com/blog/google-io-memory-management-for-android-apps/
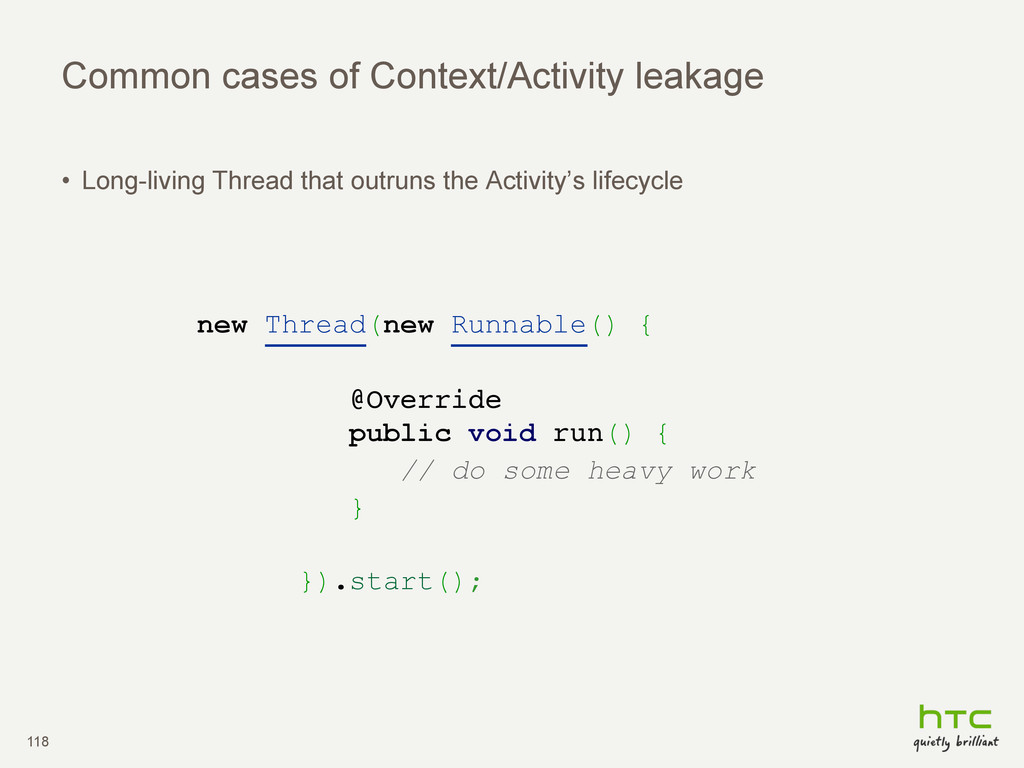
Have a long living reference to an unused object. This prevents the unused object from being garbage collected. • In Android, the memory leak is often a reference to Context/Activity. 114
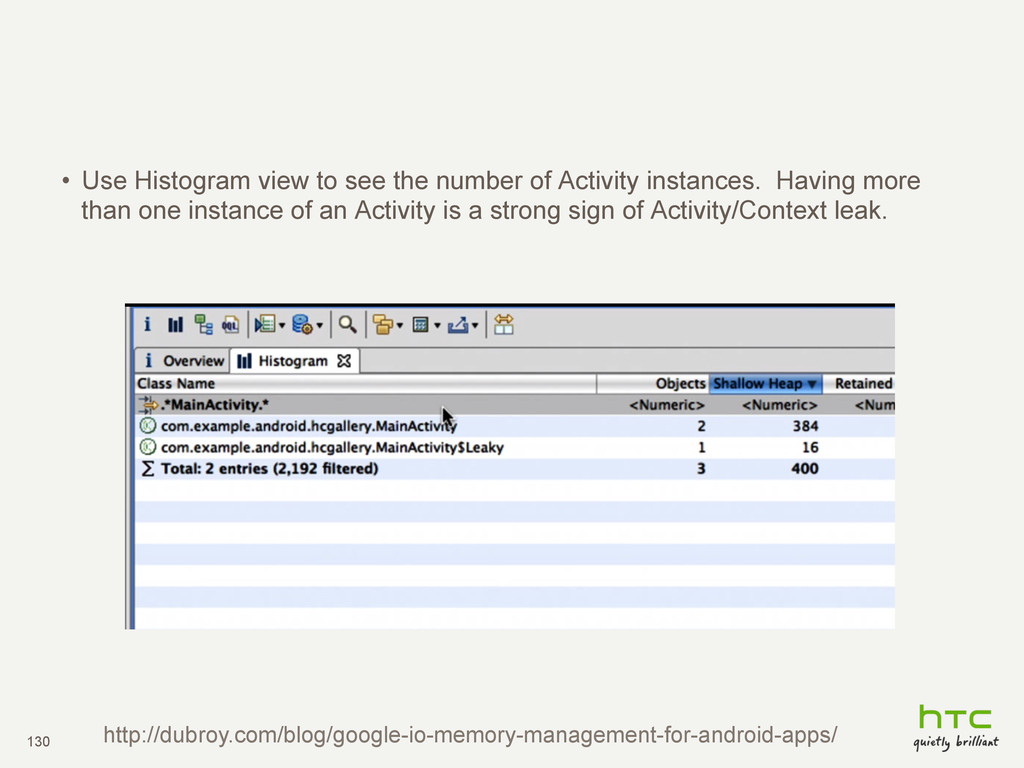
instances. Having more than one instance of an Activity is a strong sign of Activity/Context leak. 130 http://dubroy.com/blog/google-io-memory-management-for-android-apps/
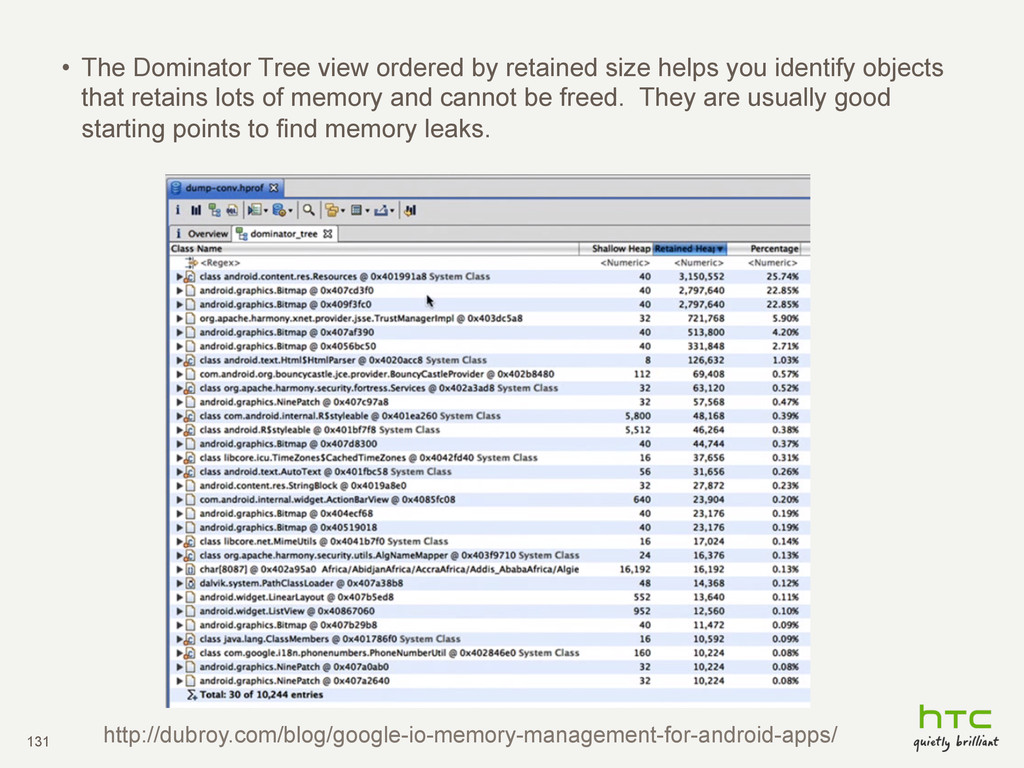
you identify objects that retains lots of memory and cannot be freed. They are usually good starting points to find memory leaks. 131 http://dubroy.com/blog/google-io-memory-management-for-android-apps/
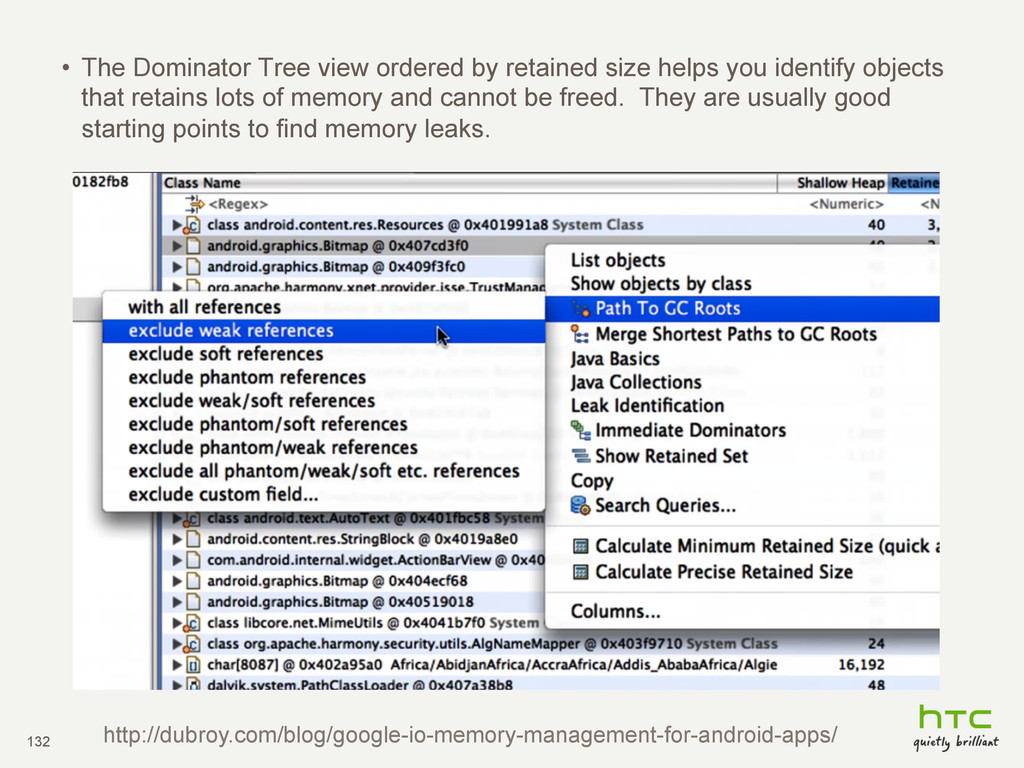
you identify objects that retains lots of memory and cannot be freed. They are usually good starting points to find memory leaks. 132 http://dubroy.com/blog/google-io-memory-management-for-android-apps/
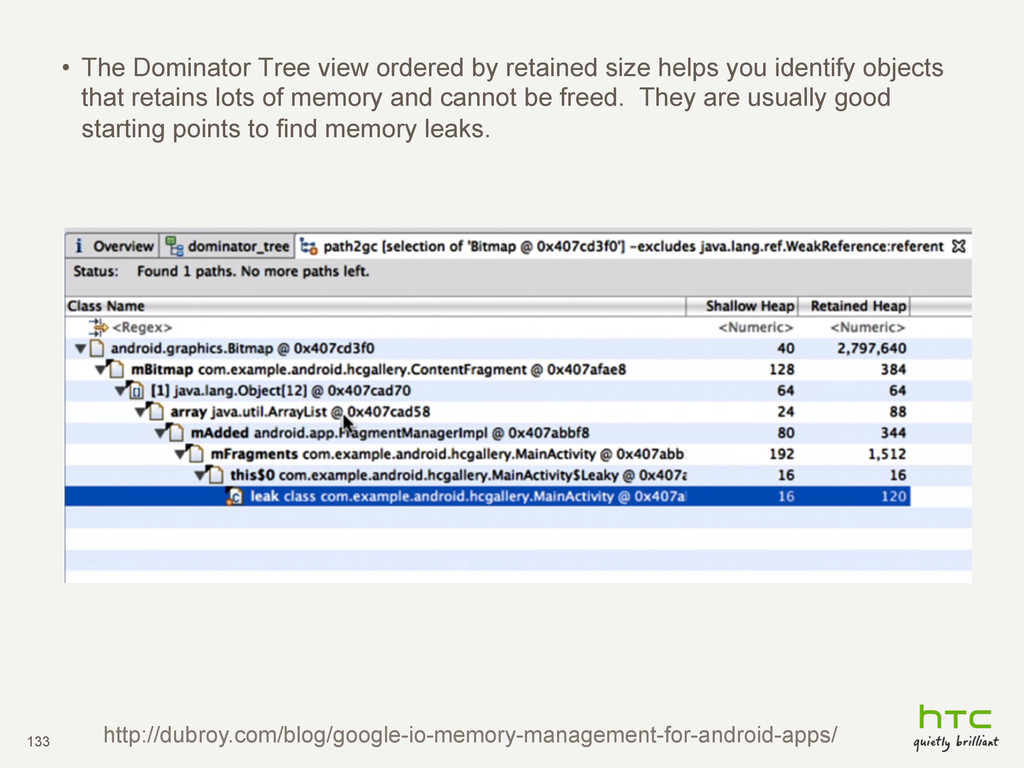
you identify objects that retains lots of memory and cannot be freed. They are usually good starting points to find memory leaks. 133 http://dubroy.com/blog/google-io-memory-management-for-android-apps/
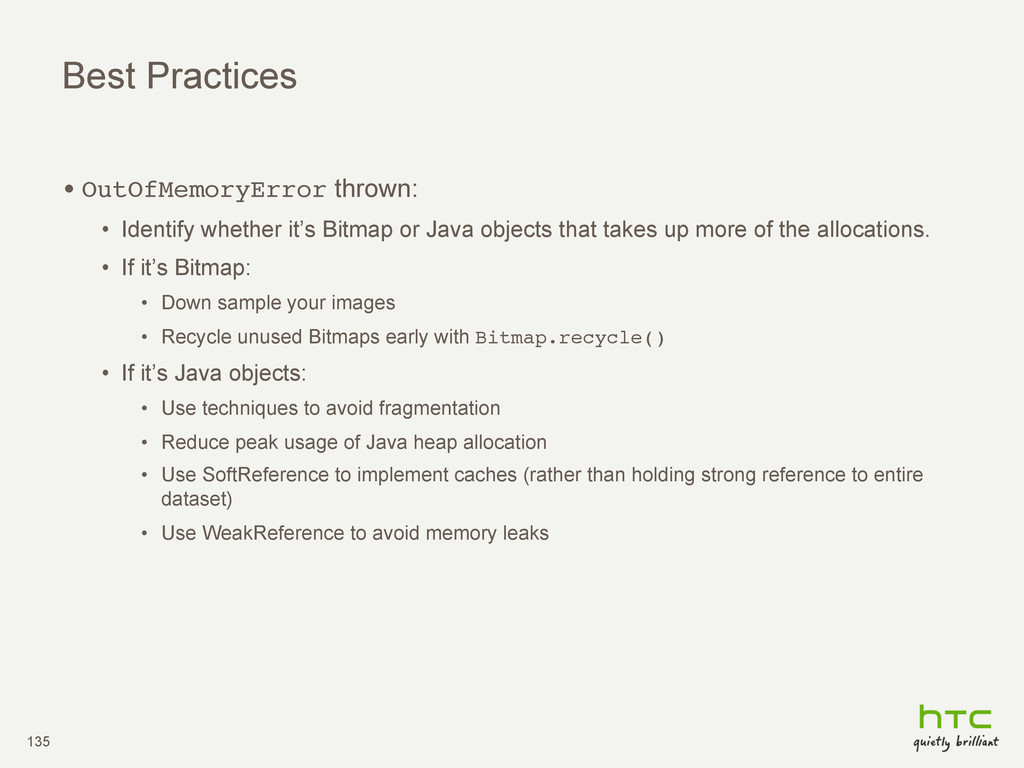
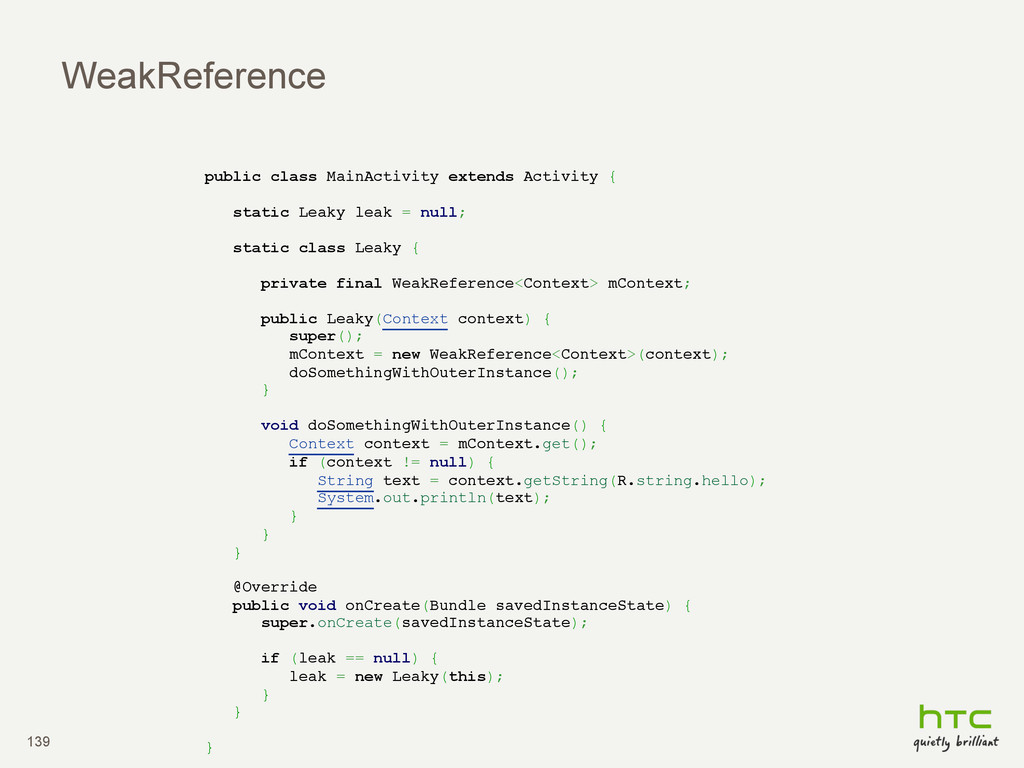
Java objects that takes up more of the allocations. • If it’s Bitmap: • Down sample your images • Recycle unused Bitmaps early with Bitmap.recycle()! • If it’s Java objects: • Use techniques to avoid fragmentation • Reduce peak usage of Java heap allocation • Use SoftReference to implement caches (rather than holding strong reference to entire dataset) • Use WeakReference to avoid memory leaks 135
![Improving Android Application Performance David Wu [email protected] Computer Science and](https://files.speakerdeck.com/presentations/506d27937e8497000203daec/slide_0.jpg)
![I/content_query_sample( 6812): ! ![content://com.android.contacts/data,sourceid/_id,account_type=? AND account_name=? AND mimetype=? AND data2=?,,95,com.htc.example,20]!](https://files.speakerdeck.com/presentations/506d27937e8497000203daec/slide_55.jpg)
![I/content_query_sample( 6812): ! ![content://com.android.contacts/data,sourceid/_id,account_type=? AND account_name=? AND mimetype=? AND data2=?,,95,com.htc.example,20]!](https://files.speakerdeck.com/presentations/506d27937e8497000203daec/slide_56.jpg)
![I/content_query_sample( 6812): ! ![content://com.android.contacts/data,sourceid/_id,account_type=? AND account_name=? AND mimetype=? AND data2=?,,95,com.htc.example,20]!](https://files.speakerdeck.com/presentations/506d27937e8497000203daec/slide_57.jpg)
![I/content_query_sample( 6812): ! ![content://com.android.contacts/data,sourceid/_id,account_type=? AND account_name=? AND mimetype=? AND data2=?,,95,com.htc.example,20]!](https://files.speakerdeck.com/presentations/506d27937e8497000203daec/slide_58.jpg)
![I/content_query_sample( 6812): ! ![content://com.android.contacts/data,sourceid/_id,account_type=? AND account_name=? AND mimetype=? AND data2=?,,95,com.htc.example,20]!](https://files.speakerdeck.com/presentations/506d27937e8497000203daec/slide_59.jpg)
![I/content_update_sample( 3156): ! ![content://com.htc.friendstream.provider.FriendStreamProvider/preferences/ key/pk_synctime,insert,,39,,8]! 61 content_update_sample! Uri!](https://files.speakerdeck.com/presentations/506d27937e8497000203daec/slide_60.jpg)
![I/content_update_sample( 3156): ! ![content://com.htc.friendstream.provider.FriendStreamProvider/preferences/ key/pk_synctime,insert,,39,,8]! 62 content_update_sample! Operation type! (insert,](https://files.speakerdeck.com/presentations/506d27937e8497000203daec/slide_61.jpg)
![I/content_update_sample( 3156): ! ![content://com.htc.friendstream.provider.FriendStreamProvider/preferences/ key/pk_synctime,insert,,39,,8]! 63 content_update_sample! Operation duration!](https://files.speakerdeck.com/presentations/506d27937e8497000203daec/slide_62.jpg)