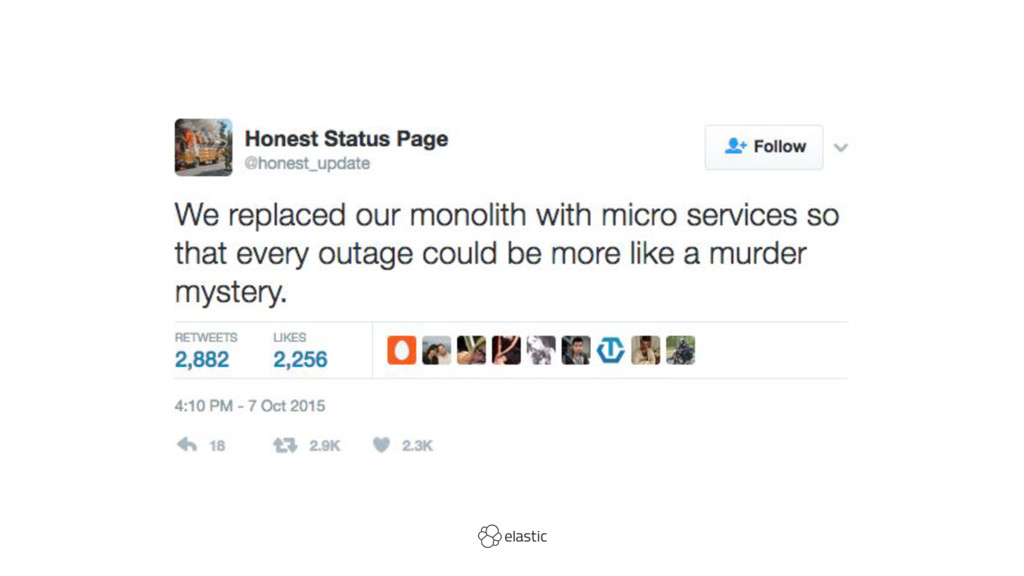
"With microservices every outage is like a murder mystery" is a common complaint. But it doesn’t have to be! This talk gives an overview on how to monitor distributed applications and how common monitoring APIs can help with this effort. We dive into:
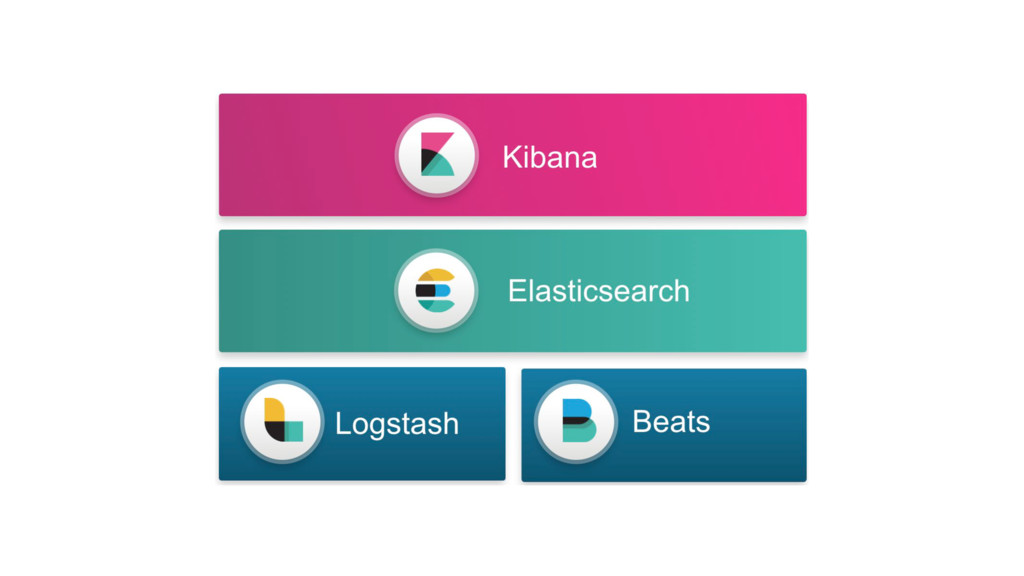
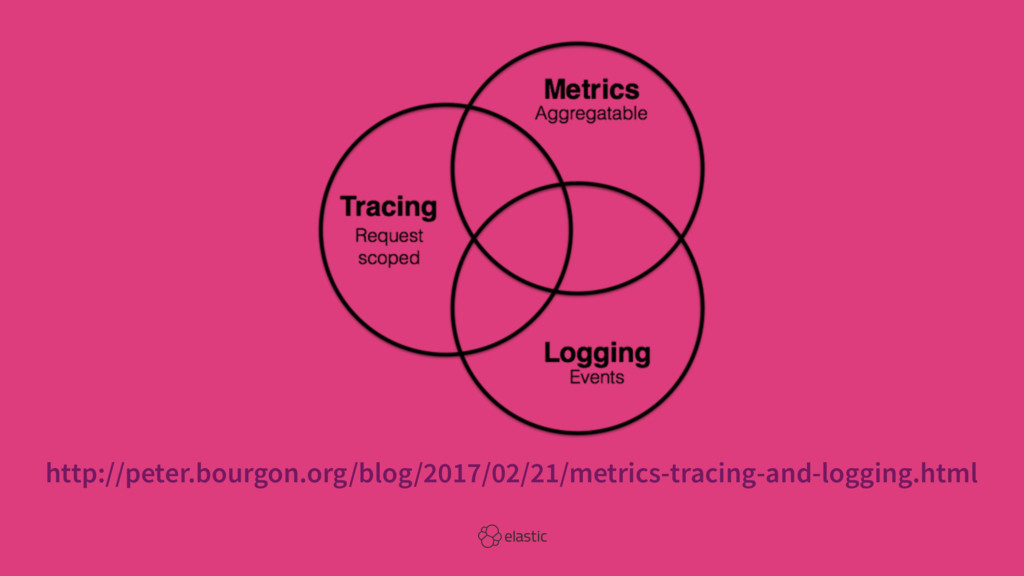
* Logs: Why structured logs should be the new norm of logging and how to centralize them.
* Metrics: This includes both application metrics (using REST APIs or JMX for example) as well as system metrics, which are more similar to the classical ‘top’ output.
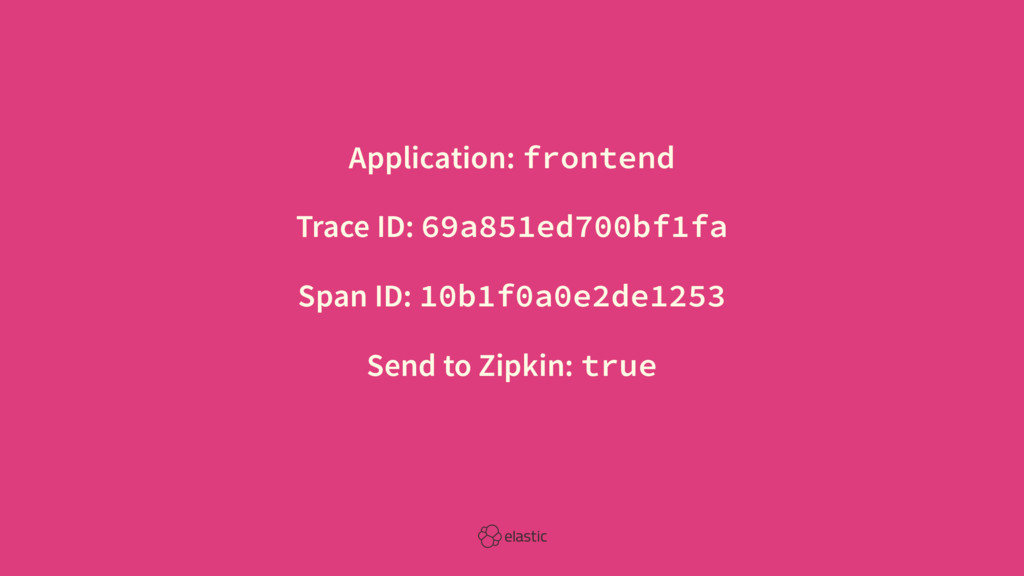
* Traces: The Open Tracing Foundation is basically the golden standard of tracing at the moment. We use Sleuth to show how to trace requests through a distributed system and Zipkin to display how long each call takes.
This combination of logs, metrics, and traces is also called the holy trinity of monitoring.
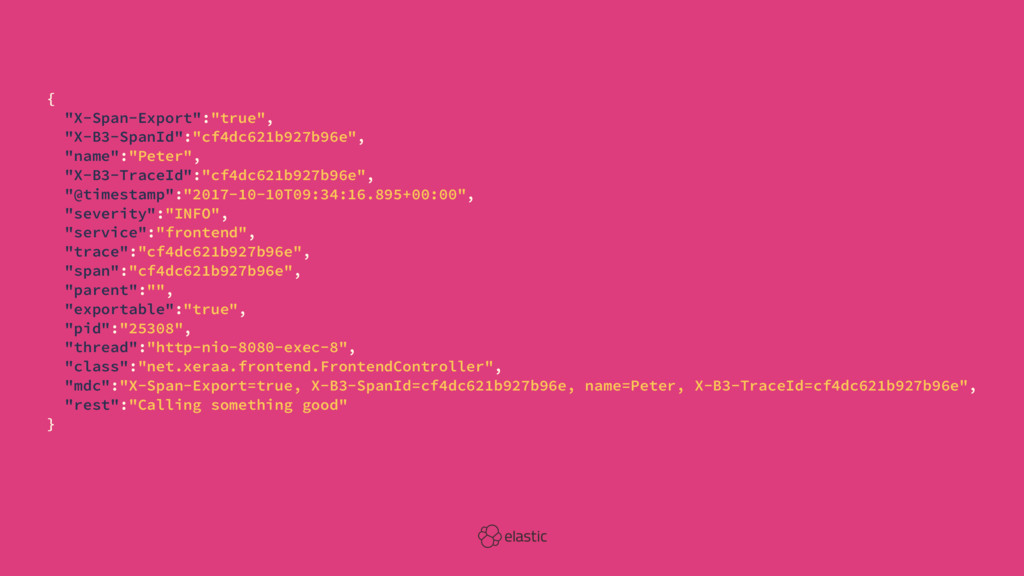
![2017-10-10 09:34:16.895 INFO [frontend,cf4dc621b927b96e,cf4dc621b927b96e,true] 25308 --- [nio-8080-exec-8] net.xeraa.frontend.FrontendController: X-Span-Export=true, X-B3-SpanId=cf4dc621b927b96e,](https://files.speakerdeck.com/presentations/f05bb7b4140f47008364dd2d8d466502/slide_11.jpg)
![2017-03-29 08:08:35.090 INFO [frontend,69a851ed700bf1fa,69a851ed700bf1fa,true] 23575 --- [p-nio-80-exec-2] n.x.MicroserviceMonitoringApplication : Calling](https://files.speakerdeck.com/presentations/f05bb7b4140f47008364dd2d8d466502/slide_19.jpg)