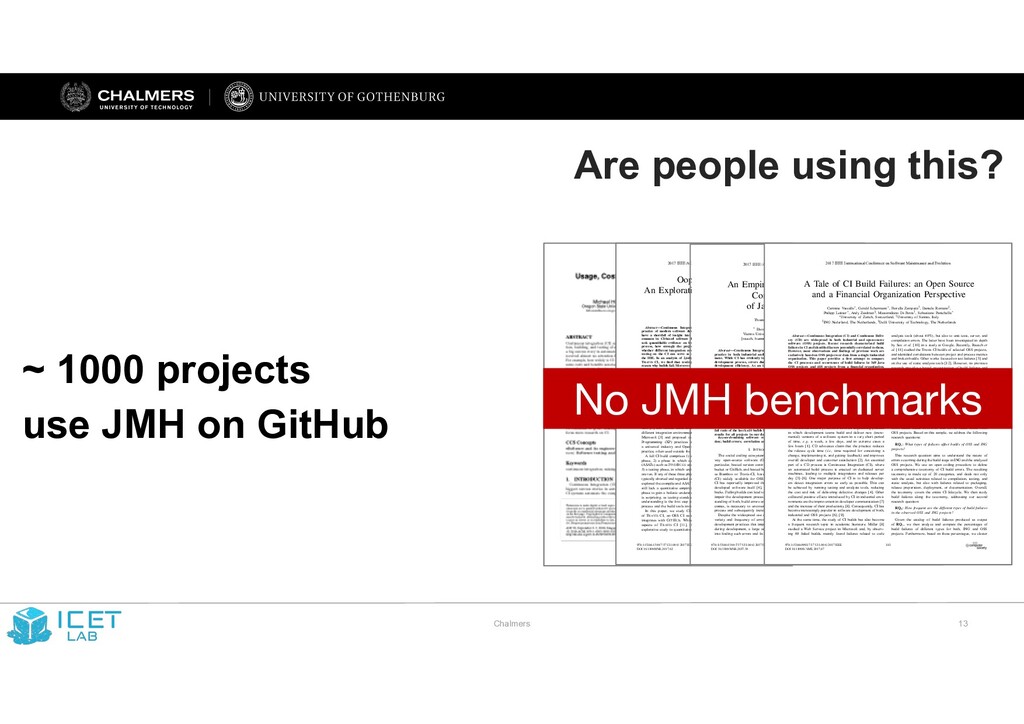
JMH on GitHub Oops, My Tests Broke the Build: An Explorative Analysis of Travis CI with GitHub Moritz Beller, Georgios Gousios, Andy Zaidman Delft University of Technology, The Netherlands {m.m.beller,g.gousios,a.e.zaidman}@tudelft.nl Abstract—Continuous Integration (CI) has become a best practice of modern software development. Yet, at present, we have a shortfall of insight into the testing practices that are common in CI-based software development. In particular, we seek quantifiable evidence on how central testing is to the CI process, how strongly the project language influences testing, whether different integration environments are valuable and if testing on the CI can serve as a surrogate to local testing in the IDE. In an analysis of 2,640,825 Java and Ruby builds on TRAVIS CI, we find that testing is the single most important reason why builds fail. Moreover, the programming language has a strong influence on both the number of executed tests, their run time, and proneness to fail. The use of multiple integration environments leads to 10% more failures being caught at build time. However, testing on TRAVIS CI does not seem an adequate surrogate for running tests locally in the IDE. To further research on TRAVIS CI with GITHUB, we introduce TRAVISTORRENT. I. INTRODUCTION Continuous Integration (CI) is the software engineering practice in which developers not only integrate their work into a shared mainline frequently, but also verify the quality of their contributions continuously. CI facilitates this through an automated build process that typically includes (developer) tests [1] and various static analysis tools that can be run in different integration environments [2]. Originally described by Microsoft [3] and proposed as one of the twelve Extreme Programming (XP) practices in 1997 [4], CI has become a universal industry and Open-Source Software (OSS) best practice, often used outside the context of XP [5], [6]. A full CI build comprises 1) a traditional build and compile phase, 2) a phase in which automated static analysis tools (ASATs) such as FINDBUGS and JSHINT are run [7], [8], and 3) a testing phase, in which unit, integration, and system tests are run. If any of these three phases fails, the whole CI build is typically aborted and regarded as broken [9]. Researchers have explored the compile and ASAT phase of CI [7], [10]; yet, we still lack a quantitative empirical investigation of the testing phase to gain a holistic understanding of the CI process. This is surprising, as testing stands central in CI [2] and a better understanding is the first step to further improve both the CI process and the build tools involved. In this paper, we study CI-based testing in the context of TRAVIS CI, an OSS CI as-a-service platform that tightly integrates with GITHUB. While there has been research on aspects of TRAVIS CI [11], [12], we lack an overarching explorative study to quantitatively explore the CI domain for testing from the ground up. Moreover, as accessing data from TRAVIS CI and overlaying it with GITHUB data involves difficult technicalities, researchers would profit from making this promising data source more accessible. Our explorative research into CI is steered by five concrete propositions inspired from and raised by previous research: P1. The use of CI is a widespread best practice. CI has become an integral quality assurance practice [13]. But just how widespread is its use in OSS projects? One study on TRAVIS CI found an adoption rate of 45 to 90% [11]. This seems surprisingly high given it was measured in 2013, when TRAVIS CI was still very new, and also based on only a small subset of projects. P2. Testing is central to CI. Two studies on the impact of compilation problems and ASATs at Google found that missing dependencies are the most important reason for builds to break [7], [10]. However, these studies have not considered the testing phase of CI. To gain a complete picture of CI, we need to measure the importance and impact of the testing phase in a CI build process. P3. Testing on the CI is language-dependent. While CI is a general purpose practice for software development projects, the programming languages used in CI have been shown to differ, e.g. in terms of programming effort [14]. As such, CI observations for one language might not generalize to other languages. A cross-language comparison might unveil which testing practices of a certain language community and culture might benefit more from CI, in terms of shorter run time or fewer broken builds. P4. Test Integration in different environments is valuable [13, Chapter 4]. Building and integrating in different environments is time- and resource-intensive. Consequently, it should deliver additional value over a regular one-environment integration strategy. We currently lack data to support this claim. P5. Testing on the CI is a surrogate for testing in the IDE for getting quick feedback. One of the core ideas of developer testing is to provide quick feedback to developers [15], [16]. Yet, a recent study on how 416 software developers test in their Integrated Development Environments (IDEs) [17] could not explain the “testing paradox:” developers spent a substantial 25% of their time working on tests, but rarely executed them in their IDE. We received anecdotal evidence that, instead, developers might offload running tests to the CI. However, it is unclear whether the CI environment is indeed a suitable replacement for running tests locally. In particular, while 2017 IEEE/ACM 14th International Conference on Mining Software Repositories (MSR) 978-1-5386-1544-7/17 $31.00 © 2017 IEEE DOI 10.1109/MSR.2017.62 46 2017 IEEE/ACM 14th International Conference on Mining Software Repositories (MSR) 978-1-5386-1544-7/17 $31.00 © 2017 IEEE DOI 10.1109/MSR.2017.62 356 2017 IEEE/ACM 14th International Conference on Mining Software Repositories (MSR) 978-1-5386-1544-7/17 $31.00 © 2017 IEEE DOI 10.1109/MSR.2017.62 356 2017 IEEE/ACM 14th International Conference on Mining Software Repositories (MSR) 978-1-5386-1544-7/17 $31.00 © 2017 IEEE DOI 10.1109/MSR.2017.62 356 An Empirical Analysis of Build Failures in the Continuous Integration Workflows of Java-Based Open-Source Software Thomas Rausch∗, Waldemar Hummer∗, Philipp Leitner†, Stefan Schulte∗ ∗ Distributed Systems Group Vienna University of Technology, Austria {rausch, hummer, schulte}@dsg.tuwien.ac.at † Software Evolution and Architecture Lab University of Zurich, Switzerland leitner@ifi.uzh.ch Abstract—Continuous Integration (CI) has become a common practice in both industrial and open-source software develop- ment. While CI has evidently improved aspects of the software development process, errors during CI builds pose a threat to development efficiency. As an increasing amount of time goes into fixing such errors, failing builds can significantly impair the development process and become very costly. We perform an in- depth analysis of build failures in CI environments. Our approach links repository commits to data of corresponding CI builds. Using data from 14 open-source Java projects, we first identify 14 common error categories. Besides test failures, which are by far the most common error category (up to >80% per project), we also identify noisy build data, e.g., induced by transient Git interaction errors, or general infrastructure flakiness. Second, we analyze which factors impact the build results, taking into account general process and specific CI metrics. Our results indicate that process metrics have a significant impact on the build outcome in 8 of the 14 projects on average, but the strongest influencing factor across all projects is overall stability in the recent build history. For 10 projects, more than 50% (up to 80%) of all failed builds follow a previous build failure. Moreover, the fail ratio of the last k=10 builds has a significant impact on build results for all projects in our dataset. Keywords-mining software repositories; continuous integra- tion; build errors; correlation analysis I. INTRODUCTION The social coding ecosystem has dramatically changed the way open-source software (OSS) is developed [1]–[3]. In particular, hosted version control systems (VCS), such as Bit- bucket or GitHub, and hosted build automation platforms, such as Bamboo or Travis-CI, have made continuous integration (CI) widely available for OSS projects of every size. While CI has reportedly improved the quality of processes and the developed software itself [4], there are also potential draw- backs. Failing builds can lead to inefficiencies and significantly impair the development process [5]. A comprehensive under- standing of both, build errors and factors that impact build out- comes, is necessary to uncover problems in the development process and subsequently increase development efficiency. Despite the widespread use of CI, little is known about the variety and frequency of errors that cause builds to fail, or development practices that impact the outcome of builds. Yet, during development, a large amount of time and focus goes into finding such errors and fixing broken builds [5]. Previous research on build errors has focused on compiler errors [6] or test failures [7], and has not considered other aspects of CI builds. Further studies of CI build failures either have a narrow scope of explored metrics (e.g., socio-technical factors) [8], [9], or consider only a single closed-source project [5], [10]. Also, the pull-based development model, as facilitated by Git- based code hosting platforms, has introduced new aspects to the development process [3] that have not been considered in prior work on build failure analysis. In this paper, we present an empirical study of CI build failures in 14 Java-based OSS projects. We extract and analyze data from publicly available GitHub repositories and Travis-CI build logs to address the following research questions: RQ1. Which types of errors occur during CI builds of Java- based open-source systems? We explore CI build data to find which types of errors occur in CI builds, and to determine the frequency of occurrence of these errors. We use a semi-automated procedure to sys- tematically classify build logfiles and map them to different error types. This data is then aggregated to gather quantitative evidence about the frequency of different error types. We observe that the most common reasons for build failures are failing integration tests, code quality measures being below a required threshold, and compilation errors. These findings help developers prioritize efforts in reducing build failures. RQ2. Which development practices can be associated with build failures in such systems? Based on existing research on software defect and build failure analysis, combined with observations from the pull-based development model, we formulate a set of 16 process and CI metrics that we hypothesize to influence build results. After extracting and linking data from different sources, we perform statistical correlation tests to examine the strength of such influence. Our results show that change complexity and author experience can describe build outcomes reasonably well. The strongest influencing factor for failing builds, however, is overall stability of the build system in the recent build history. Our research has important implications for both, practi- tioners and researchers. Practitioners should closely monitor the stability of their CI system to avoid the perpetuation of 2017 IEEE/ACM 14th International Conference on Mining Software Repositories (MSR) 978-1-5386-1544-7/17 $31.00 © 2017 IEEE DOI 10.1109/MSR.2017.54 35 2017 IEEE/ACM 14th International Conference on Mining Software Repositories (MSR) 978-1-5386-1544-7/17 $31.00 © 2017 IEEE DOI 10.1109/MSR.2017.54 345 2017 IEEE/ACM 14th International Conference on Mining Software Repositories (MSR) 978-1-5386-1544-7/17 $31.00 © 2017 IEEE DOI 10.1109/MSR.2017.54 345 2017 IEEE/ACM 14th International Conference on Mining Software Repositories (MSR) 978-1-5386-1544-7/17 $31.00 © 2017 IEEE DOI 10.1109/MSR.2017.54 345 A Tale of CI Build Failures: an Open Source and a Financial Organization Perspective Carmine Vassallo∗, Gerald Schermann∗, Fiorella Zampetti†, Daniele Romano‡, Philipp Leitner∗, Andy Zaidman§, Massimiliano Di Penta†, Sebastiano Panichella∗ ∗University of Zurich, Switzerland, †University of Sannio, Italy ‡ING Nederland, The Netherlands, §Delft University of Technology, The Netherlands Abstract—Continuous Integration (CI) and Continuous Deliv- ery (CD) are widespread in both industrial and open-source software (OSS) projects. Recent research characterized build failures in CI and identified factors potentially correlated to them. However, most observations and findings of previous work are exclusively based on OSS projects or data from a single industrial organization. This paper provides a first attempt to compare the CI processes and occurrences of build failures in 349 Java OSS projects and 418 projects from a financial organization, ING Nederland. Through the analysis of 34,182 failing builds (26% of the total number of observed builds), we derived a taxonomy of failures that affect the observed CI processes. Using cluster analysis, we observed that in some cases OSS and ING projects share similar build failure patterns (e.g., few compilation failures as compared to frequent testing failures), while in other cases completely different patterns emerge. In short, we explain how OSS and ING CI processes exhibit commonalities, yet are substantially different in their design and in the failures they report. Keywords-Continuous Delivery, Continuous Integration, Agile development, Build failures. I. INTRODUCTION Continuous Delivery (CD) is a software engineering practice in which development teams build and deliver new (incre- mental) versions of a software system in a very short period of time, e.g., a week, a few days, and in extreme cases a few hours [1]. CD advocates claim that the practice reduces the release cycle time (i.e., time required for conceiving a change, implementing it, and getting feedback) and improves overall developer and customer satisfaction [2]. An essential part of a CD process is Continuous Integration (CI), where an automated build process is enacted on dedicated server machines, leading to multiple integrations and releases per day [3]–[6]. One major purpose of CI is to help develop- ers detect integration errors as early as possible. This can be achieved by running testing and analysis tools, reducing the cost and risk of delivering defective changes [4]. Other collateral positive effects introduced by CI in industrial envi- ronments are the improvement in developer communication [7] and the increase of their productivity [8]. Consequently, CI has become increasingly popular in software development of both, industrial and OSS projects [6], [9]. At the same time, the study of CI builds has also become a frequent research topic in academic literature. Miller [8] studied a Web Service project in Microsoft and, by observ- ing 69 failed builds, mainly found failures related to code analysis tools (about 40%), but also to unit tests, server, and compilation errors. The latter have been investigated in depth by Seo et al. [10] in a study at Google. Recently, Rausch et al. [11] studied the Travis CI builds of selected OSS projects, and identified correlations between project and process metrics and broken builds. Other works focused on test failures [5] and on the use of static analysis tools [12]. However, no previous research provides a broad categorization of build failures and compared their occurrences between industry and OSS. This paper studies build failures in 418 projects (mostly Java-based) from a large financial organization, ING Neder- land (referred to as ING), as well as in 349 Java-based open source software (OSS) hosted on GitHub and using Travis CI. The purpose of the study is to compare the outcome of CI in OSS and in an industrial organization in the financial domain, and to understand commonalities and differences. As previous work by St˚ ahl et al. [13] suggested that the build process in industry varies substantially, we aim to understand the differences (also in terms of build failure distributions) between OSS and one industrial case. In total we analyzed 3,390 failed builds from ING and 30,792 failed builds from OSS projects. Based on this sample, we address the following research questions: RQ 1 : What types of failures affect builds of OSS and ING projects? This research question aims to understand the nature of errors occurring during the build stage in ING and the analyzed OSS projects. We use an open coding procedure to define a comprehensive taxonomy of CI build errors. The resulting taxonomy is made up of 20 categories, and deals not only with the usual activities related to compilation, testing, and static analysis, but also with failures related to packaging, release preparation, deployment, or documentation. Overall, the taxonomy covers the entire CI lifecycle. We then study build failures along the taxonomy, addressing our second research question: RQ 2 : How frequent are the different types of build failures in the observed OSS and ING projects? Given the catalog of build failures produced as output of RQ 1 , we then analyze and compare the percentages of build failures of different types for both, ING and OSS projects. Furthermore, based on these percentages, we cluster 2017 IEEE International Conference on Software Maintenance and Evolution 978-1-5386-0992-7/17 $31.00 © 2017 IEEE DOI 10.1109/ICSME.2017.67 183 No JMH benchmarks