Upgrade to Pro — share decks privately, control downloads, hide ads and more …

MySQL performance Test detail

MySQL performance Test detail

MySQL test

ylouis83

June 14, 2013
Tweet

More Decks by ylouis83

Other Decks in Technology

Transcript

  1. www.yhd.com MySQL performance Tips (recently update) 5.5.32 vs 5.6.12 MySQL

    performance test -----by yihaodian Tomleng. The Hardware environment: [root@db-2-9 ~]# dmidecode -s system-product-name PowerEdge R720xd [root@db-2-9 ~]# cat /proc/meminfo |more MemTotal: 65962096 kB MemFree: 54150924 kB [root@db-2-9 ~]# cat /proc/cpuinfo |more processor : 0 vendor_id : GenuineIntel cpu family : 6 model : 45 model name : Intel(R) Xeon(R) CPU E5-2620 0 @ 2.00GHz stepping : 7 cpu MHz : 2000.059 cache size : 15360 KB
  2. www.yhd.com [root@db-2-9 ~]# cat /proc/cpuinfo |grep processor |wc -l 24

    [root@db-2-9 ~]# cat /etc/my.cnf [client] port = 3306 socket = /data/mysql/data/mysql.sock [mysql] max_allowed_packet = 16M default_character_set = utf8 no_auto_rehash prompt = "\\R:\\m:\\s \\d> " pager = "more" [mysqld] open_files_limit = 65535 server-id = 201 basedir = /data/mysql datadir = /data/mysql/data socket = /data/mysql/data/mysql.sock port = 3306 character_set_server = utf8 skip_external_locking max_allowed_packet = 16M key_buffer_size = 1G myisam_sort_buffer_size=64M
  3. www.yhd.com sort_buffer_size = 4M read_buffer_size = 4M read_rnd_buffer_size = 8M

    tmp_table_size=64M query_cache_size=0 query_cache_type=0 table_open_cache = 512 thread_cache_size = 100 wait_timeout = 86400 interactive_timeout = 86400 thread_concurrency = 48 max_connections=1000 #transaction-isolation = READ-COMMITTED transaction-isolation = REPEATABLE-READ sysdate-is-now binlog_format = MIXED log-bin=/data/mysql/arch/mysql-bin #log_bin_trust_function_creators=1 slow_query_log=1 slow_query_log_file=/data/mysql/data/slow_query.log long_query_time=2 log-queries-not-using-indexes=0 performance_schema innodb_data_home_dir = /data/mysql/data innodb_data_file_path = ibdata1:1G:autoextend
  4. www.yhd.com innodb_log_group_home_dir = /data/mysql/arch innodb_log_files_in_group = 2 innodb_log_file_size = 512M

    innodb_log_buffer_size = 8M innodb_buffer_pool_size = 40G innodb_additional_mem_pool_size = 16M innodb_buffer_pool_instances=1 innodb_lock_wait_timeout = 100 innodb_thread_concurrency = 48 innodb_flush_log_at_trx_commit = 0 #innodb_locks_unsafe_for_binlog=1 innodb_locks_unsafe_for_binlog=0 innodb_read_io_threads=8 innodb-write-io-threads=8 innodb_io_capacity = 600 innodb_purge_threads=1 innodb_file_per_table = 1 innodb_flush_log_at_trx_commit = 1 sync_binlog = 1 lower_case_table_names=1 autocommit=1 [mysqldump] quick max_allowed_packet = 16M [myisamchk] key_buffer_size = 256M
  5. www.yhd.com sort_buffer_size = 256M read_buffer = 2M write_buffer = 2M

    BASED Test by Mysqlslap: 5.6.12 has a big improvement than 5.5.32 Details: All insert /data/mysql/bin/mysqlslap --verbose \ -uroot -pyihaodian \ --delimiter=";" \ --engine=innodb \ --auto-generate-sql \ --auto-generate-sql-add-autoincrement \ --number-char-cols=5 \ --number-int-cols=10 \ --auto-generate-sql-load-type=write \ --auto-generate-sql-execute-number=10000 \ --concurrency=30 \ --detach=100
  6. www.yhd.com 5.5.32-linux Benchmark Running for engine innodb Average number of

    seconds to run all queries: 112.919 seconds Minimum number of seconds to run all queries: 112.919 seconds Maximum number of seconds to run all queries: 112.919 seconds Number of clients running queries: 30 Average number of queries per client: 10000 5.6.12-linux Benchmark Running for engine innodb Average number of seconds to run all queries: 27.625 seconds Minimum number of seconds to run all queries: 27.625 seconds Maximum number of seconds to run all queries: 27.625 seconds Number of clients running queries: 30 Average number of queries per client: 10000 Update by primary key /data/mysql/bin/mysqlslap --verbose \ -uroot -pyihaodian \ --delimiter=";" \ --engine=innodb \ --auto-generate-sql \
  7. www.yhd.com --auto-generate-sql-add-autoincrement \ --number-char-cols=5 \ --number-int-cols=10 \ --auto-generate-sql-load-type=update \ --auto-generate-sql-execute-number=10000

    \ --concurrency=30 \ --detach=100 5.5.32-linux Benchmark Running for engine innodb Average number of seconds to run all queries: 111.260 seconds Minimum number of seconds to run all queries: 111.260 seconds Maximum number of seconds to run all queries: 111.260 seconds Number of clients running queries: 30 Average number of queries per client: 10000 5.6.12-linux Benchmark Running for engine innodb Average number of seconds to run all queries: 28.978 seconds Minimum number of seconds to run all queries: 28.978 seconds Maximum number of seconds to run all queries: 28.978 seconds Number of clients running queries: 30 Average number of queries per client: 10000
  8. www.yhd.com Select by primary key /data/mysql/bin/mysqlslap --verbose \ -uroot -pyihaodian

    \ --delimiter=";" \ --engine=innodb \ --auto-generate-sql \ --auto-generate-sql-add-autoincrement \ --number-char-cols=5 \ --number-int-cols=10 \ --auto-generate-sql-load-type=key \ --auto-generate-sql-execute-number=100000 \ --concurrency=30 \ --detach=100 5.5.32-linux Benchmark Running for engine innodb Average number of seconds to run all queries: 38.402 seconds Minimum number of seconds to run all queries: 38.402 seconds Maximum number of seconds to run all queries: 38.402 seconds Number of clients running queries: 30 Average number of queries per client: 100000 5.6.12-linux Benchmark
  9. www.yhd.com Running for engine innodb Average number of seconds to

    run all queries: 35.801 seconds Minimum number of seconds to run all queries: 35.801 seconds Maximum number of seconds to run all queries: 35.801 seconds Number of clients running queries: 30 Average number of queries per client: 100000 -------------------------------------------------------------------------------- On staging test environment: 5.6.12 has a bigger performance improvement than 5.5.32 when parallel sessions are increasing ,more concurrency better performance. Detail SQL text : vi query.sql select count(1) from gss_data.pm_stock_3 where pm_info_id in ( 1381898 , 995717 , 7061062 , 1009835 , 7061064 , 2274824 , 6464315 , 4667866 , 8416932 , 3942438 , 3942439 , 1932770 , 7061075 , 972348 , 7061073 , 8007295 , 8007281 , 7061080 , 2001017 , 7061087 , 8882284 , 1126760 , 8416950 , 2274844 , 7061089 , 1047183 , 8983344 , 3814131 , 8416910 , 4608916 , 3814130 , 1457653 , 7061099 , 4608923 , 1878335 , 7061098 , 7061101 , 7061100 , 1047170 , 7062092 , 7062088 , 8416927 , 8416924 , 7558294 , 8416912 , 7061114 ,
  10. www.yhd.com 2032072 , 8416919 , 8416916 , 7062075 , 2654715

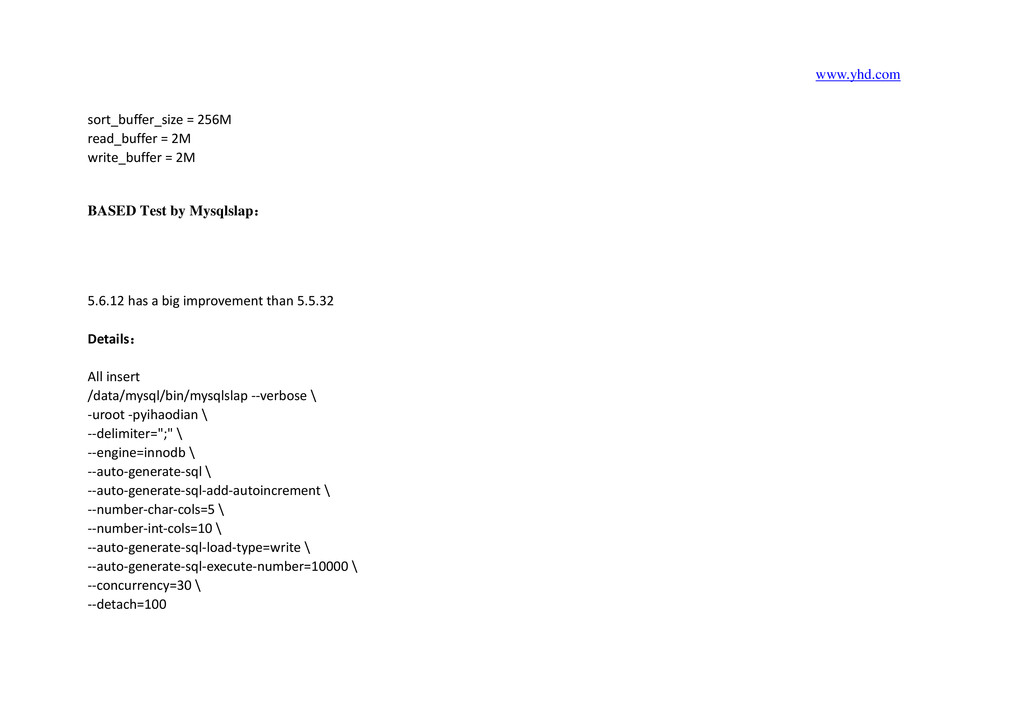
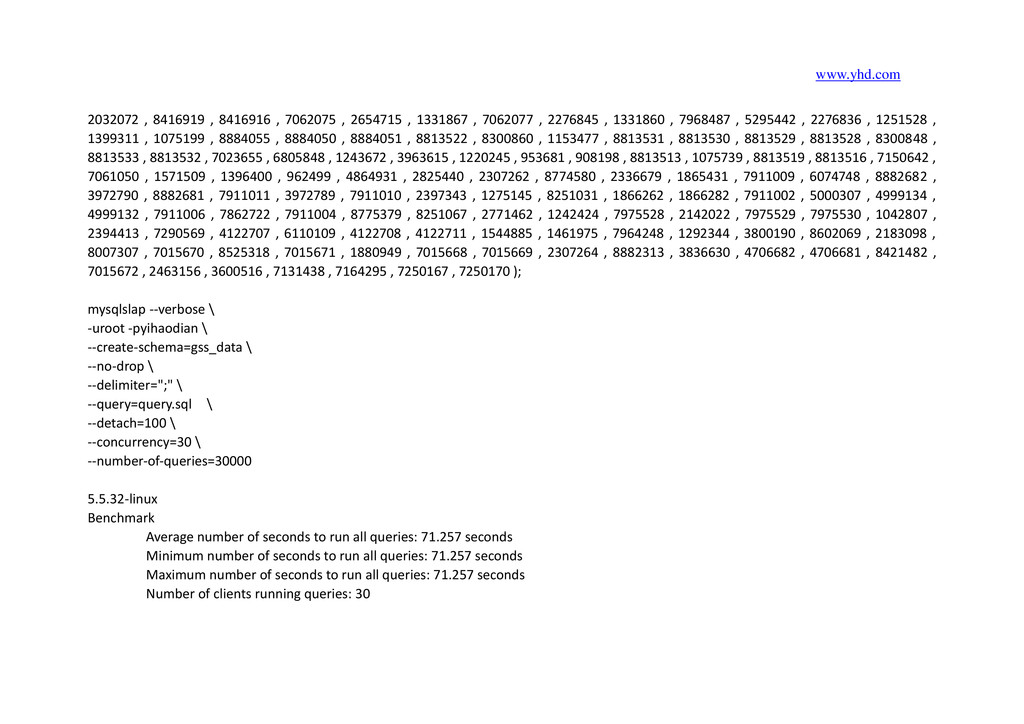
    , 1331867 , 7062077 , 2276845 , 1331860 , 7968487 , 5295442 , 2276836 , 1251528 , 1399311 , 1075199 , 8884055 , 8884050 , 8884051 , 8813522 , 8300860 , 1153477 , 8813531 , 8813530 , 8813529 , 8813528 , 8300848 , 8813533 , 8813532 , 7023655 , 6805848 , 1243672 , 3963615 , 1220245 , 953681 , 908198 , 8813513 , 1075739 , 8813519 , 8813516 , 7150642 , 7061050 , 1571509 , 1396400 , 962499 , 4864931 , 2825440 , 2307262 , 8774580 , 2336679 , 1865431 , 7911009 , 6074748 , 8882682 , 3972790 , 8882681 , 7911011 , 3972789 , 7911010 , 2397343 , 1275145 , 8251031 , 1866262 , 1866282 , 7911002 , 5000307 , 4999134 , 4999132 , 7911006 , 7862722 , 7911004 , 8775379 , 8251067 , 2771462 , 1242424 , 7975528 , 2142022 , 7975529 , 7975530 , 1042807 , 2394413 , 7290569 , 4122707 , 6110109 , 4122708 , 4122711 , 1544885 , 1461975 , 7964248 , 1292344 , 3800190 , 8602069 , 2183098 , 8007307 , 7015670 , 8525318 , 7015671 , 1880949 , 7015668 , 7015669 , 2307264 , 8882313 , 3836630 , 4706682 , 4706681 , 8421482 , 7015672 , 2463156 , 3600516 , 7131438 , 7164295 , 7250167 , 7250170 ); mysqlslap --verbose \ -uroot -pyihaodian \ --create-schema=gss_data \ --no-drop \ --delimiter=";" \ --query=query.sql \ --detach=100 \ --concurrency=30 \ --number-of-queries=30000 5.5.32-linux Benchmark Average number of seconds to run all queries: 71.257 seconds Minimum number of seconds to run all queries: 71.257 seconds Maximum number of seconds to run all queries: 71.257 seconds Number of clients running queries: 30
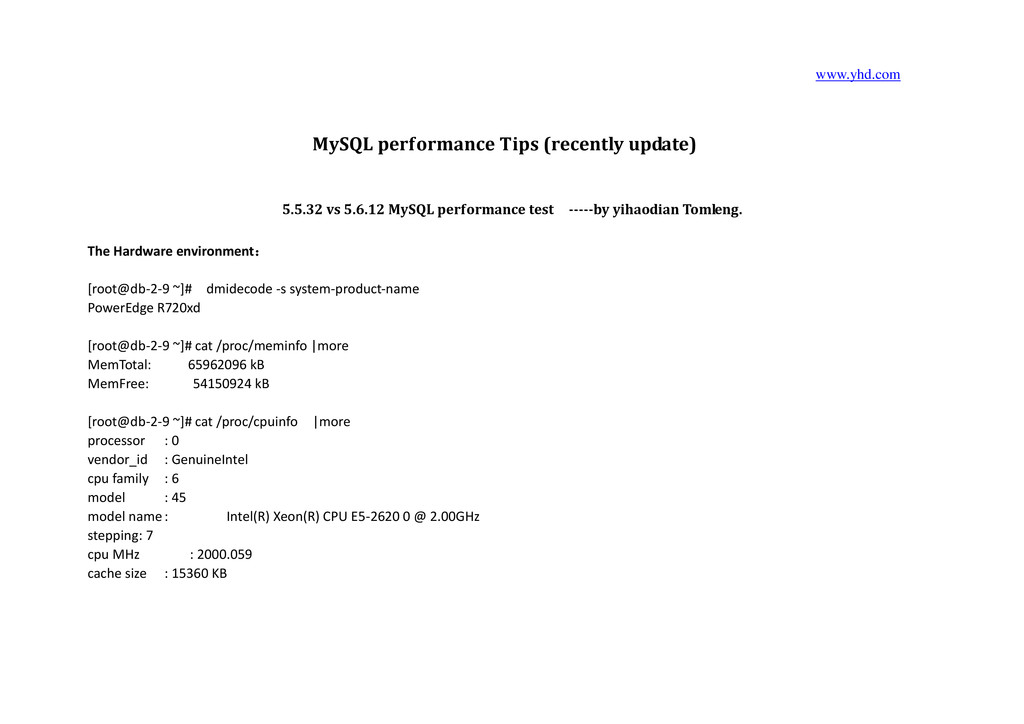
  11. www.yhd.com Average number of queries per client: 1000 5.6.12-linux Benchmark

    Average number of seconds to run all queries: 3.738 seconds Minimum number of seconds to run all queries: 3.738 seconds Maximum number of seconds to run all queries: 3.738 seconds Number of clients running queries: 30 Average number of queries per client: 1000 mysqlslap --verbose \ -uroot -pyihaodian \ --create-schema=gss_data \ --no-drop \ --delimiter=";" \ --query=query.sql \ --detach=100 \ --concurrency=1 \ --number-of-queries=30000 5.5.32-linux Benchmark Average number of seconds to run all queries: 120.504 seconds Minimum number of seconds to run all queries: 120.504 seconds Maximum number of seconds to run all queries: 120.504 seconds
  12. www.yhd.com Number of clients running queries: 1 Average number of

    queries per client: 30000 5.6.12-linux Benchmark Average number of seconds to run all queries: 48.158 seconds Minimum number of seconds to run all queries: 48.158 seconds Maximum number of seconds to run all queries: 48.158 seconds Number of clients running queries: 1 Average number of queries per client: 30000
  13. www.yhd.com MySQL binary installation VS MySQL source code installation----by yihaodian

    rzj Hardware : # Percona Toolkit System Summary Report ###################### Date | 2013-06-14 03:31:12 UTC (local TZ: CST +0800) Hostname | SHABBO2-SRV-0041 Uptime | 25 days, 33 min, 3 users, load average: 0.77, 0.57, 0.38 System | Dell Inc.; PowerEdge R815; vNot Specified (<OUT OF SPEC>) Platform | Linux Release | Red Hat Enterprise Linux Server release 5.8 (Tikanga) Kernel | 2.6.32-300.10.1.el5uek Architecture | CPU = 64-bit, OS = 64-bit Threading | NPTL 2.5 Compiler | GNU CC version 4.1.2 20080704 (Red Hat 4.1.2-50). SELinux | Disabled Virtualized | No virtualization detected # Processor ################################################## Processors | physical = 4, cores = 48, virtual = 48, hyperthreading = no Speeds | 48x2100.117
  14. www.yhd.com Models | 48xAMD Opteron(tm) Processor 6172 Caches | 48x512

    KB # Memory ##################################################### Total | 126.2G Free | 54.8G Used | physical = 71.4G, swap allocated = 125.0G, swap used = 387.5M, virtual = 71.8G Buffers | 288.8M Caches | 23.8G Test tool:Percona-TPCC More information about TPCC you can visit http://www.tpc.org/tpcc/ Test process : We do this test on MySQL (Be installed by MySQL binary and MySQL source code) all of them have the same parameters only the difference is port number 。 1.create test database
  15. www.yhd.com # mysqladmin -h127.0.0.1 -P3306 -uroot -pyihaodian create tpcc50 #

    mysqladmin -h127.0.0.1 -P3308 -uroot -pyihaodian create tpcc50 2.create test tables # mysql -h127.0.0.1 -P3306 -uroot -pyihaodian tpcc50 < create_table.sql # mysql -h127.0.0.1 -P3308 -uroot -pyihaodian tpcc50 < create_table.sql 3.add index and PK # mysql -h127.0.0.1 -P3306 -uroot -pyihaodian tpcc50 < add_fkey_idx.sql # mysql -h127.0.0.1 -P3308 -uroot -pyihaodian tpcc50 < add_fkey_idx.sql 4.create 50 DWs # ./tpcc_load 127.0.0.1:3306 tpcc50 root 'yihaodian' 50 # ./tpcc_load 127.0.0.1:3308 tpcc50 root 'yihaodian' 50 Reporting and Analysis # ./tpcc_start -h127.0.0.1 -P3306 -d tpcc50 -u root -p 'yihaodian' -w 50 -c 1 -r 60 -l 300 -f tpcc50_3306_c1.txt
  16. www.yhd.com Result :5606.600 TpmC # ./tpcc_start -h127.0.0.1 -P3308 -d tpcc50

    -u root -p 'yihaodian' -w 50 -c 1-r 60 -l 300 -f tpcc50_3308_c1.txt Result :6586.600 TpmC # ./tpcc_start -h127.0.0.1 -P3306 -d tpcc50 -u root -p 'yihaodian' -w 50 -c 10 -r 60 -l 300 -f tpcc50_3306_c10.txt Result : 36890.398 TpmC # ./tpcc_start -h127.0.0.1 -P3308 -d tpcc50 -u root -p 'yihaodian' -w 50 -c 10 -r 60 -l 300 -f tpcc50_3308_c10.txt Result: 33451.398 TpmC # ./tpcc_start -h127.0.0.1 -P3306 -d tpcc50 -u root -p 'yihaodian' -w 50 -c 30 -r 60 -l 300 -f tpcc50_3306_c30.txt Result : 44680.199TpmC # ./tpcc_start -h127.0.0.1 -P3308 -d tpcc50 -u root -p 'yihaodian' -w 50 -c 30 -r 60 -l 300 -f tpcc50_3308_c30.txt Result : 43589.000 TpmC
  17. www.yhd.com # ./tpcc_start -h127.0.0.1 -P3306 -d tpcc50 -u root -p

    'yihaodian' -w 50 -c 60 -r 60 -l 300 -f tpcc50_3306_c60.txt Result : 47708.602 TpmC # ./tpcc_start -h127.0.0.1 -P3308 -d tpcc50 -u root -p 'yihaodian' -w 50 -c 60 -r 60 -l 300 -f tpcc50_3308_c60.txt Result :35535.199 TpmC # ./tpcc_start -h127.0.0.1 -P3306 -d tpcc50 -u root -p 'yihaodian' -w 50 -c 80 -r 60 -l 300 -f tpcc50_3306_c80.txt Result :46586.000 TpmC # ./tpcc_start -h127.0.0.1 -P3308 -d tpcc50 -u root -p 'yihaodian' -w 50 -c 80 -r 60 -l 300 -f tpcc50_3308_c80.txt Result :38174.199 TpmC
  18. www.yhd.com OS kernel difference leading MySQL performance undulate -----by willy

    Linux 5.8 with FusionIO [root@GSS-02 ioDrive2]# uname -a Linux GSS-02 2.6.18-308.0.0.0.1.el5 #1 SMP Sat Feb 25 16:16:23 EST 2012 x86_64 x86_64 x86_64 GNU/Linux [root@GSS-03 ioDrive2]# uname -a Linux ITEM-LGSTD01 2.6.32-300.10.1.el5uek #1 SMP Wed Feb 22 17:37:40 EST 2012 x86_64 x86_64 x86_64 GNU/Linux [root@GSS-02 ioDrive2]# cat /etc/grub.conf # grub.conf generated by anaconda # # Note that you do not have to rerun grub after making changes to this file # NOTICE: You have a /boot partition. This means that # all kernel and initrd paths are relative to /boot/, eg. # root (hd0,0) # kernel /vmlinuz-version ro root=/dev/sda3 # initrd /initrd-version.img #boot=/dev/sda default=1 ------------------> default not 1 (default 0)
  19. www.yhd.com timeout=5 splashimage=(hd0,0)/grub/splash.xpm.gz hiddenmenu title Oracle Linux Server (2.6.32-300.10.1.el5uek) root

    (hd0,0) kernel /vmlinuz-2.6.32-300.10.1.el5uek ro root=LABEL=/ rhgb quiet numa=off initrd /initrd-2.6.32-300.10.1.el5uek.img title Oracle Linux Server-base (2.6.18-308.0.0.0.1.el5) root (hd0,0) kernel /vmlinuz-2.6.18-308.0.0.0.1.el5 ro root=LABEL=/ rhgb quiet numa=off initrd /initrd-2.6.18-308.0.0.0.1.el5.img Test : use java client to run simple select command to see MySQL performance 1.One session to run same sql query on different kernels [oracle@yhdem dbtest]$ java dbtest.DBTest select45o.xml ---------- select returns rows from kernel 2.6.32-300.10.1.el5uek 0 SECONDS:60
  20. www.yhd.com maxMills:3 minMills:0 countMax:0 avgMills:1 allMills:60000 countAll:52644 --------- not good

    [oracle@yhdem dbtest]$ java dbtest.DBTest select46o.xml -------------select returns rows from kernel 2.6.18-308.0.0.0.1.el5 0 SECONDS:60 maxMills:2 minMills:0 countMax:0 avgMills:0 allMills:60000 countAll:98914 ----------almost double TPS of test 1 2.multi sessions to run same sql query on different kernels (Gap of TPS is not huge but still have gap) 3.MySQL 5.6 has a better performance in these situation (TPS performance is better on os kernel 2.6.32-300.10.1.el5uek)
  21. www.yhd.com MySQL NUMA Tips As MySQL can’t work well on

    NUMA,We can disable numa when you’re running single instance MySQL on Physical PC-server.And also we can use -- cpunodebind to bind MySQL instance to different nodes. But In MySQL 5.6 oracle seems to change MySQL behavior so performance improves a lot. Reference : http://blog.jcole.us/2010/09/28/mysql-swap-insanity-and-the-numa-architecture/ The memory allocated by MySQL looks something like this: Allocating memory severely imbalanced, preferring Node 0 Due to Node 0 being completely exhausted of free memory, even though the system has plenty of free memory overall (over 10GB has been used for caches) it is entirely on Node 1. If any process scheduled on Node 0 needs local memory for anything, it will cause some of the
  22. www.yhd.com already-allocated memory to be swapped out in order to

    free up some Node 0 pages. Even though there is free memory on Node 1, the Linux kernel in many circumstances (which admittedly I don’t totally understand3) prefers to page out Node 0 memory rather than free some of the cache on Node 1 and use that memory. Of course the paging is far more expensive than non-local memory access ever would be.