1992–2017 Xiaowen Wang1,2 and Yosuke Aoki1 1 Earthquake Research Institute, The University of Tokyo 2 Now at Southwest Jiaotong University, Chengdu, China J. Geophys. Res. Solid Earth, 124, 335-357 doi:10.1029/2018JB016729 (2019) 2 October 2019 Workshop IPGP-ERI Paris, France
Viscoelastic relaxation (Hamlyn et al., 2018; Yamasaki et al., 2018) ü Contraction of magma reservoir (e.g. Hamlyn et al., 2018) ü Cooling of emplaced lava (Wittmann et al., JGR Solid Earth, 2017) Temporal evolution of volcano deflation could carry various information such as rheology of intruded magma and host rock.
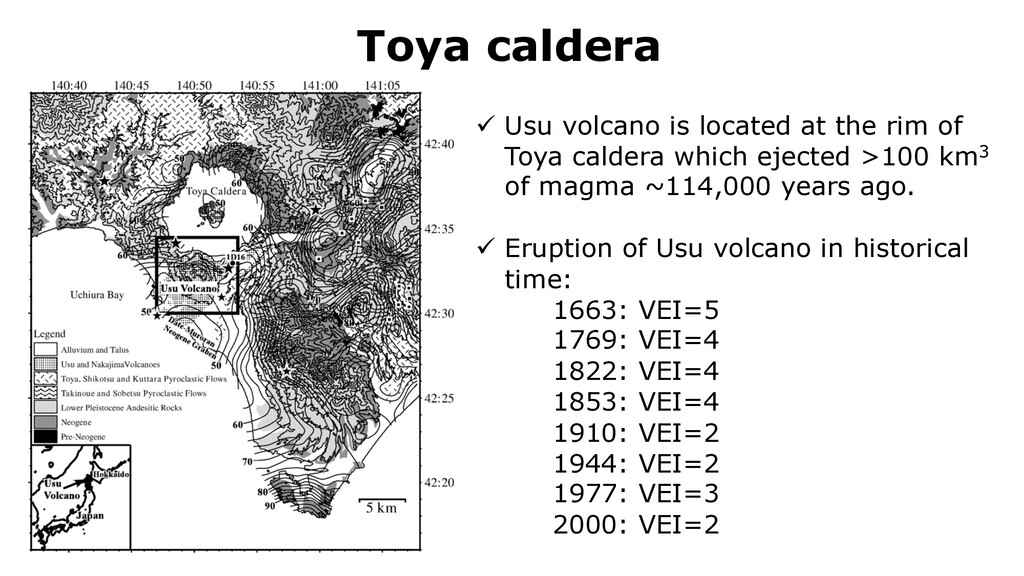
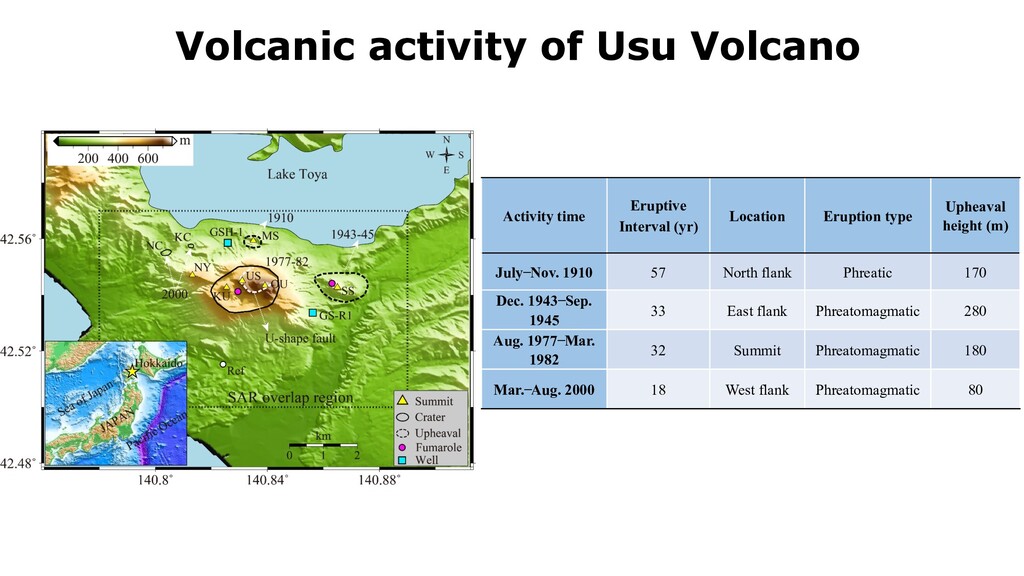
of Toya caldera which ejected >100 km3 of magma ~114,000 years ago. ü Eruption of Usu volcano in historical time: 1663: VEI=5 1769: VEI=4 1822: VEI=4 1853: VEI=4 1910: VEI=2 1944: VEI=2 1977: VEI=3 2000: VEI=2
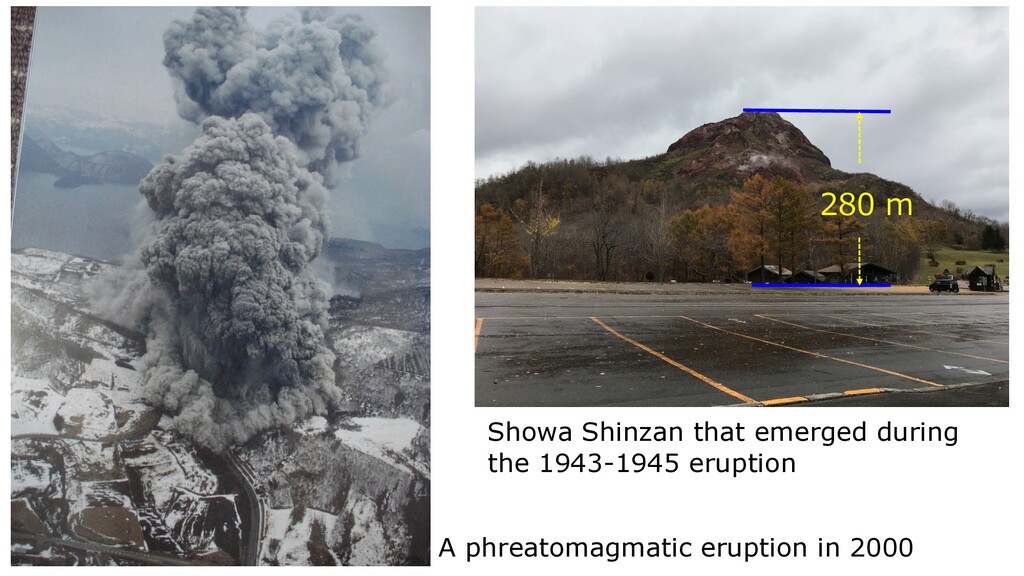
(yr) Location Eruption type Upheaval height (m) July ̶ Nov. 1910 57 North flank Phreatic 170 Dec. 1943 ̶ Sep. 1945 33 East flank Phreatomagmatic 280 Aug. 1977 ̶ Mar. 1982 32 Summit Phreatomagmatic 180 Mar. ̶ Aug. 2000 18 West flank Phreatomagmatic 80
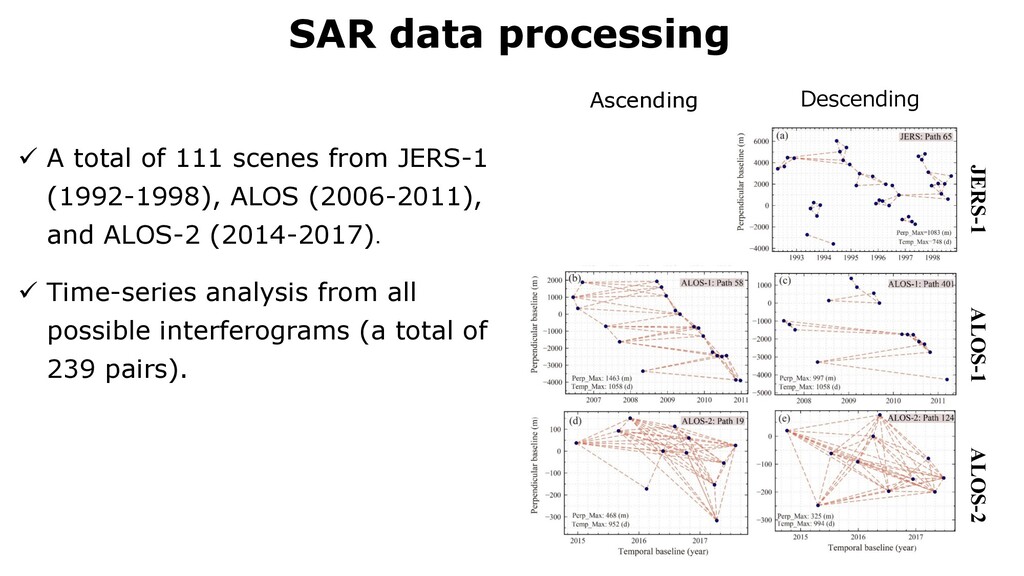
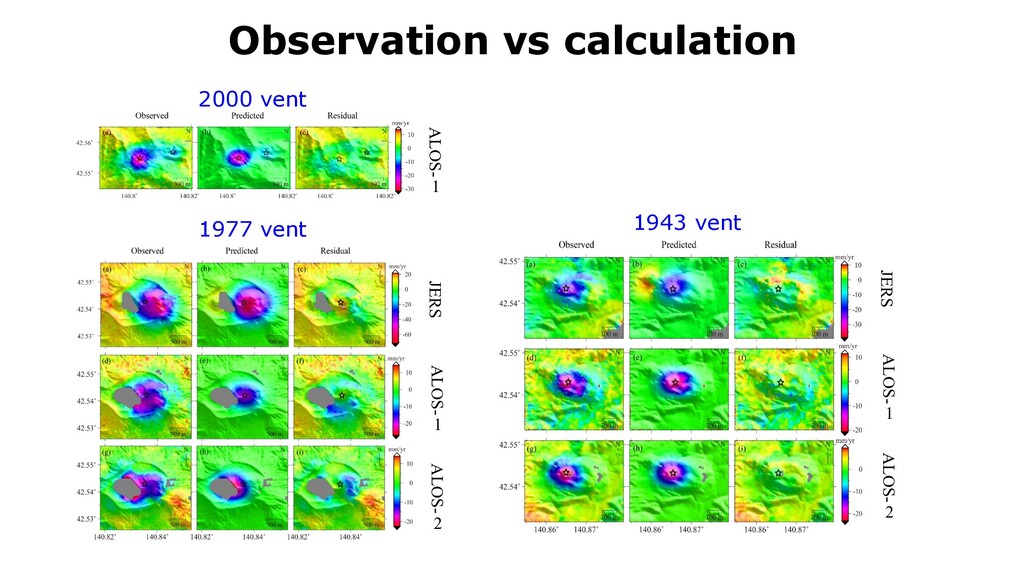
total of 111 scenes from JERS-1 (1992-1998), ALOS (2006-2011), and ALOS-2 (2014-2017). ü Time-series analysis from all possible interferograms (a total of 239 pairs).
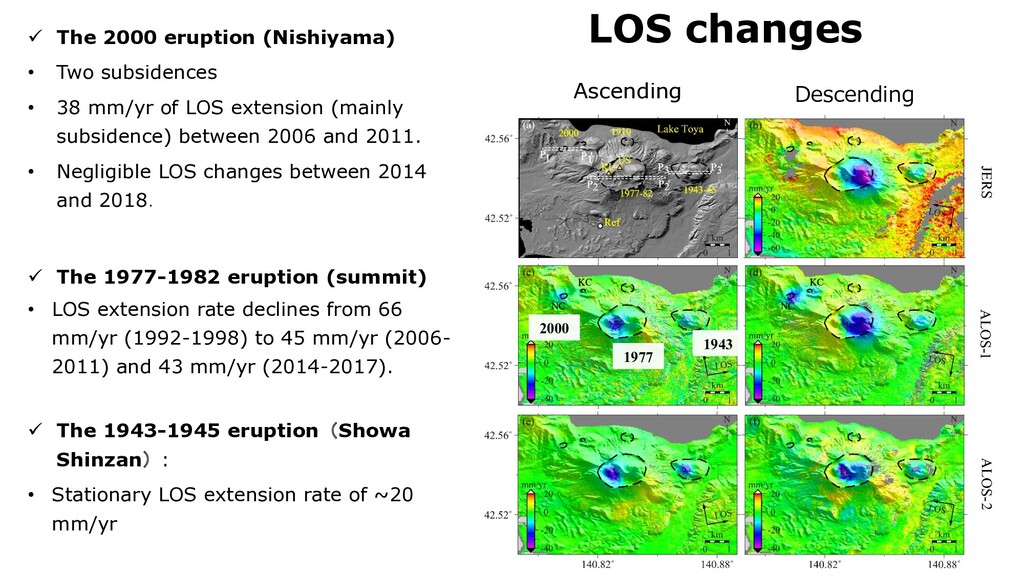
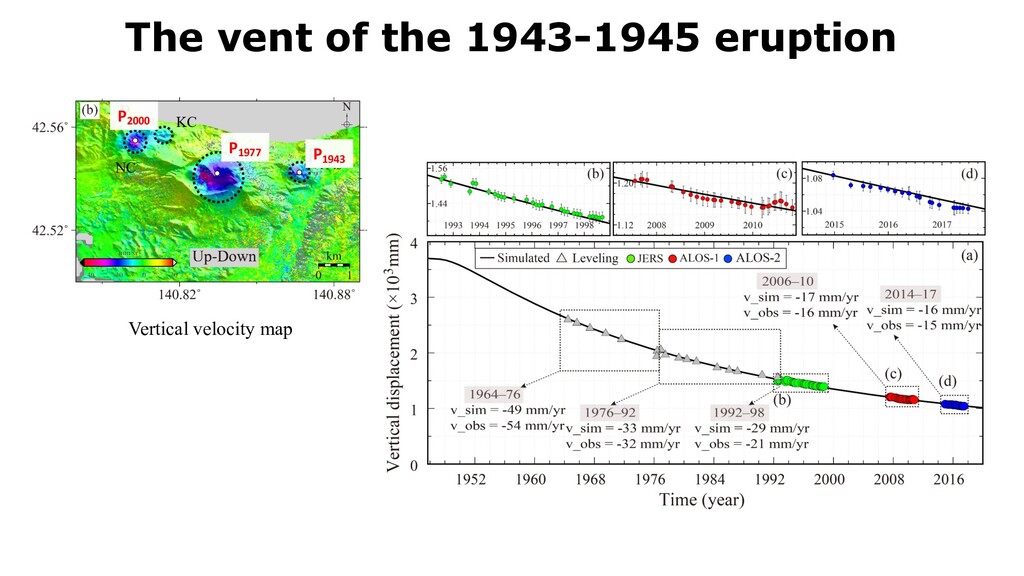
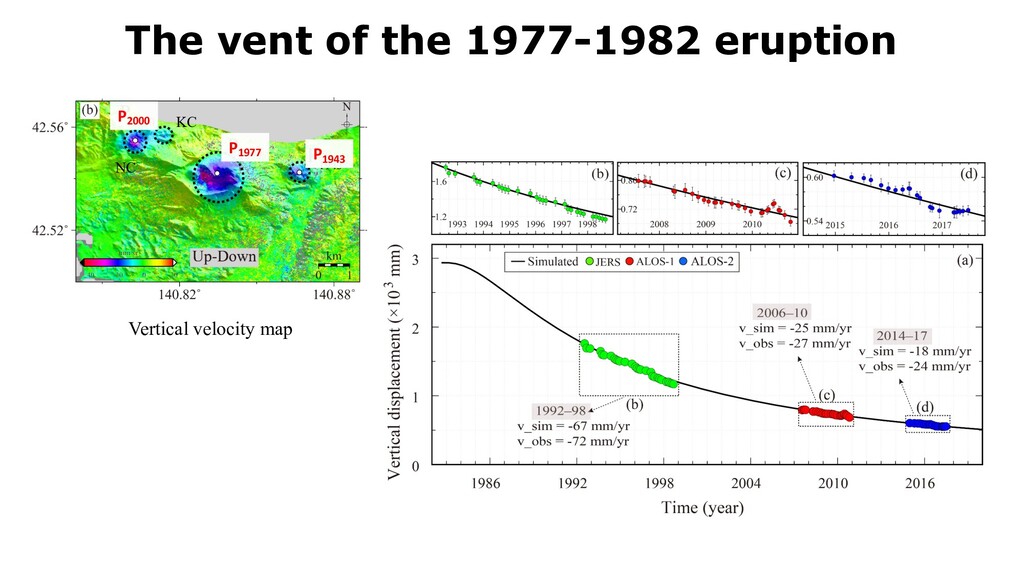
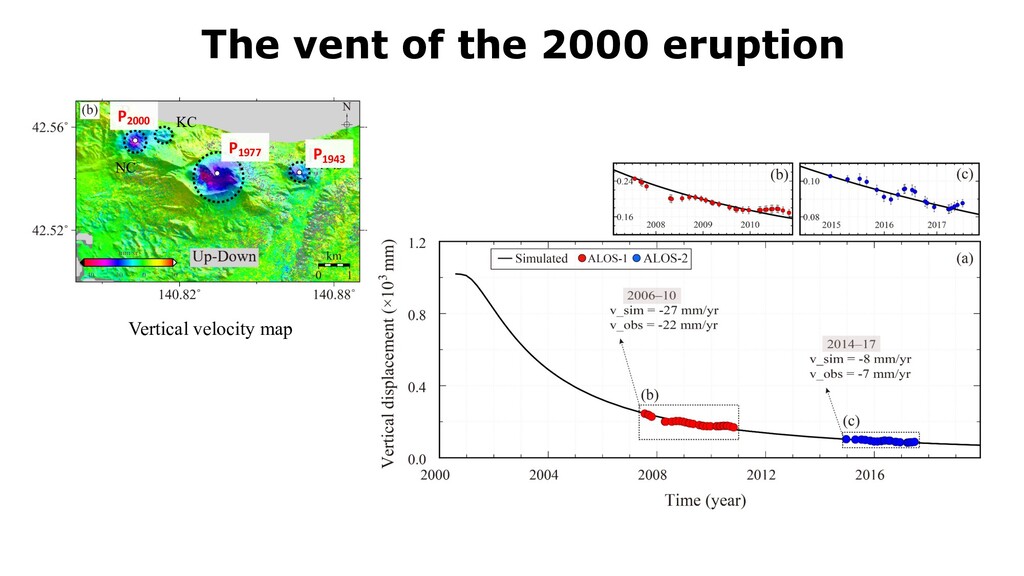
• 38 mm/yr of LOS extension (mainly subsidence) between 2006 and 2011. • Negligible LOS changes between 2014 and 2018. ü The 1977-1982 eruption (summit) • LOS extension rate declines from 66 mm/yr (1992-1998) to 45 mm/yr (2006- 2011) and 43 mm/yr (2014-2017). ü The 1943-1945 eruption(Showa Shinzan): • Stationary LOS extension rate of ~20 mm/yr Descending Ascending 2000 1977 1943
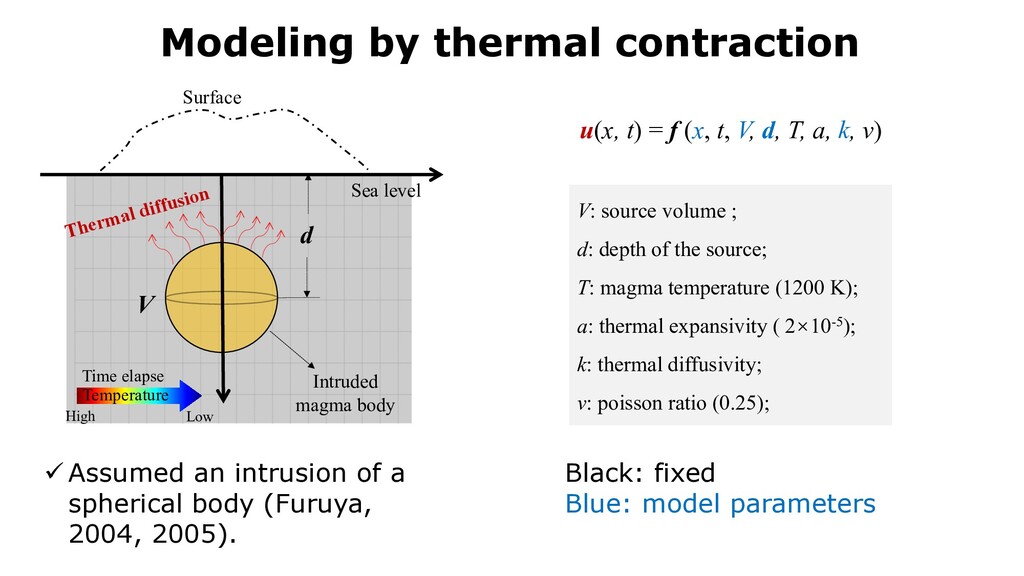
body Surface Thermal diffusion Temperature Time elapse High Low V: source volume ; d: depth of the source; T: magma temperature (1200 K); a: thermal expansivity ( 2×10⁻⁵); k: thermal diffusivity; v: poisson ratio (0.25); u(x, t) = f (x, t, V, d, T, a, k, v) ü Assumed an intrusion of a spherical body (Furuya, 2004, 2005). Black: fixed Blue: model parameters
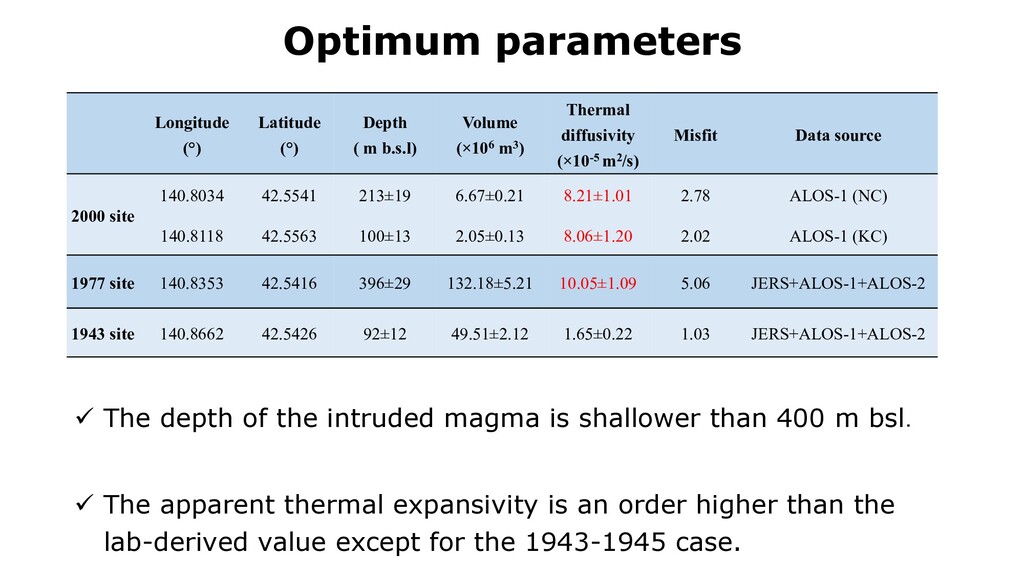
shallower than 400 m bsl. ü The apparent thermal expansivity is an order higher than the lab-derived value except for the 1943-1945 case. Longitude (°) Latitude (°) Depth ( m b.s.l) Volume (×106 m3) Thermal diffusivity (×10-5 m2/s) Misfit Data source 2000 site 140.8034 42.5541 213±19 6.67±0.21 8.21±1.01 2.78 ALOS-1 (NC) 140.8118 42.5563 100±13 2.05±0.13 8.06±1.20 2.02 ALOS-1 (KC) 1977 site 140.8353 42.5416 396±29 132.18±5.21 10.05±1.09 5.06 JERS+ALOS-1+ALOS-2 1943 site 140.8662 42.5426 92±12 49.51±2.12 1.65±0.22 1.03 JERS+ALOS-1+ALOS-2
release heat from magma right after the intrusion? ü Lake Toya is right next to the volcano, providing groundwater. ü Frequent phreatomagmatic eruptions Question: Why is the apparent thermal diffusivity in the 1943 vent normal? Possible collaboration with IPGP: Reconstructing hydrothermal circulation beneath Usu volcano by numerical simulation.
SAR images. ü Deformation is concentrated around lava domes that emerged during previous eruptions. ü The observed deformation is explained by thermal contraction of the intruded lava dome. ü The inferred apparent thermal diffusivity is larger than the lab-derived value especially right after the intrusion. ü Hydrothermal circulation effectively cools the intruded magma?
Current and future applications to Earth Sciences https://earth-planets-space.springeropen.com/lbsar Submission due: 31 December 2019 Guest Editors: Yosuke Aoki (Univ. Tokyo), Masato Furuya (Hokkaido Univ.), Francesco de Zan (DLR), Marie-Pierre Doin (ISTerre), Michael Eineder (DLR), Masato Ohki (JAXA), Mark Simons (Caltech), Tim Wright (Univ. Leeds)