Upgrade to Pro — share decks privately, control downloads, hide ads and more …

Small-scale deformation of active volcanoes measured by Synthetic Aperture Radar

Yosuke Aoki
October 15, 2019

Small-scale deformation of active volcanoes measured by Synthetic Aperture Radar

A talk on small-scale volcano deformation given at an internal seminar in ERI.

Yosuke Aoki

October 15, 2019
Tweet

More Decks by Yosuke Aoki

Other Decks in Science

Transcript

  1. Small-scale deformation of active volcanoes measured by Synthetic Aperture Radar

    Yosuke Aoki Earthquake Research Institute, The University of Tokyo Email: [email protected] with Xiaowen Wang (Southwest Jiatong University, Sichuan, China) Jie Chen (The Chinese University of Hong Kong) Wang & Aoki (2019), J. Geophys. Res. Solid Earth, 124, 335-357, doi:10.1029/2018JB016729. Wang, Aoki, & Chen, Earth Planet. Space, in revision. 2019年10⽉15⽇ 地球計測セミナー 東京⼤学地震研究所
  2. Small-scale deformation in volcanoes ion SBAS and MT-InSAR results across

    summit area indicated by dashed box in Fig. 1. Left column shows ascending, right column descending data rapped interferograms, full resolution SBAS and MT InSAR approaches. Common colourbar for all results is shown in the top left. Blue colours nt away from the satellite (dome subsidence). phic point cloud in CloudCompare, giving an us in the range of the errors between the two This allows direct comparison of the deforma- graphic features and the surface temperature. d the RGB information associated with each polated and resampled on a 1 m grid, yield- ts: a high resolution DEM and an orthomosaic ace temperatures. results and method comparison sive or explosive activity in 2012 led to good mmit area over the course of this study. On cales, we did not detect any long term defor- n de Colima. Focusing on the summit dome, displacements were clearly detected using all thods across a circular area approximately 200 total displacements exceeding 10 cm in either line of sight (LOS) direction, and being larger in the descending track, reaching up to 15 cm in LOS. However, when comparing LOS displacements derived from the three InSAR processing chains, clear differences become apparent regarding the shape and extent of the deforming area, as well as the maximum displacements. For both look directions, the NSBAS displacement fields appear smoother and larger, extending beyond the limits of the dome, with poorly defined limits to the deforming area and showing overall lower magnitude displacements when compared to the MT-InSAR or Full Resolution SBAS results. The full resolution SBAS results are more similar to those derived from MT- InSAR, yet the net displacements are slightly larger (Fig. 3). The differences in the LOS displacement fields have a strong ef- fect on the near Up–Down and East–West displacements (Fig. 4a–f). In the MT-InSAR (Fig. 4e) the vertical displacements affect a sharply defined, circular area lying on the topography of the vol- canic dome. Within the deforming area, the displacements gener- ally increase towards the centre. While the NSBAS results (Fig. 4a) appear to show a smooth gradient towards the area of highest vertical displacements, the MT-InSAR results (Fig. 4e) reveal that Volcán de Colima, Mexico (Salzer et al., EPSL, 2017) Santiaguito, Guatemala (Ebmeier et al., EPSL, 2012) ophysical Research Letters 10.1002/2016GL069820 Wolf, Gálapagos (Xu, Jónsson, Ruch, and Aoki, GRL, 2016) SAR is capable of measuring small-scale deformation by taking advantages of high spatial resolution. S.K. Ebmeier et al. / Earth and Planetary Science Letters 335–336 (2012) 216–225 220
  3. Volcanoes of Today Tokyo Ontake Usu Mt. Fuji Part 1

    Usu: Thermoelastic deflation (Wang & Aoki, 2019) Part 2 Asama: Flank instability (?) (Wang, Aoki, & Chen, in revision) Asama
  4. Inter-eruptive volcano deflation Nabro, Eritrea (Hamlyn et al., Prog. Earth

    Planet. Sci., 2018) Asama, Japan (Aoki et al., Geol. Soc. Lond. Spec. Publ., 2013) Kutcharo, Japan (Fujiwara et al., Earth Planet. Space, 2017; Yamasaki et al., JVGR, 2018)
  5. Why studying volcano deflation? Potential mechanisms of volcano deflation ü

    Viscoelastic relaxation (Hamlyn et al., 2018; Yamasaki et al., 2018) ü Contraction of magma reservoir (e.g. Hamlyn et al., 2018) ü Cooling of emplaced lava (Wittmann et al., JGR Solid Earth, 2017) Temporal evolution of volcano deflation could carry various information such as rheology of intruded magma and host rock.
  6. Toya caldera ü Usu volcano is located at the rim

    of Toya caldera which ejected >100 km3 of magma ~114,000 years ago. ü Eruption of Usu volcano in historical time: 1663: VEI=5 1769: VEI=4 1822: VEI=4 1853: VEI=4 1910: VEI=2 1944: VEI=2 1977: VEI=3 2000: VEI=2
  7. Volcanic activity of Usu Volcano 1910 Activity time Eruptive Interval

    (yr) Location Eruption type Upheaval height (m) July ̶ Nov. 1910 57 North flank Phreatic 170 Dec. 1943 ̶ Sep. 1945 33 East flank Phreatomagmatic 280 Aug. 1977 ̶ Mar. 1982 32 Summit Phreatomagmatic 180 Mar. ̶ Aug. 2000 18 West flank Phreatomagmatic 80
  8. Subsidence of the 1943 vent ü Persistent subsidence observed by

    leveling survey. ü Subsidence of 54 mm/yr (1965-1975) and 32 mm/yr (1975-1990) ü Current deformation? Spatial variation? Yokoyama & Seino (EPS, 2000)
  9. SAR data processing JERS-1 ALOS-1 ALOS-2 Ascending Descending ü A

    total of 111 scenes from JERS-1 (1992-1998), ALOS (2006-2011), and ALOS-2 (2014-2017). ü Time-series analysis from all possible interferograms (a total of 239 pairs).
  10. LOS changes ü The 2000 eruption (Nishiyama) • Two subsidences

    • 38 mm/yr of LOS extension (mainly subsidence) between 2006 and 2011. • Negligible LOS changes between 2014 and 2018. ü The 1977-1982 eruption (summit) • LOS extension rate declines from 66 mm/yr (1992-1998) to 45 mm/yr (2006- 2011) and 43 mm/yr (2014-2017). ü The 1943-1945 eruption(Showa Shinzan): • Stationary LOS extension rate of ~20 mm/yr Descending Ascending 2000 1977 1943
  11. Decomposing (quasi-)EW and vertical velocities • EW contraction and subsidence.

    • The subsidence rate is higher than the contraction rate. 1977 1943 2000 1977 1943 NC KC ALOS-1 (2006-2011) ALOS-2 (2014-2017)
  12. Modeling by thermal contraction V d Sea level Intruded magma

    body Surface Thermal diffusion Temperature Time elapse High Low V: source volume ; d: depth of the source; T: magma temperature (1200 K); a: thermal expansivity ( 2×10⁻⁵); k: thermal diffusivity; v: poisson ratio (0.25); u(x, t) = f (x, t, V, d, T, a, k, v) ü Assumed an intrusion of a spherical body (Furuya, 2004, 2005). Black: fixed Blue: model parameters
  13. Optimum parameters ü The depth of the intruded magma is

    shallower than 400 m bsl. ü The apparent thermal expansivity is an order higher than the lab-derived value except for the 1943-1945 case. Longitude (°) Latitude (°) Depth ( m b.s.l) Volume (×106 m3) Thermal diffusivity (×10-5 m2/s) Misfit Data source 2000 site 140.8034 42.5541 213±19 6.67±0.21 8.21±1.01 2.78 ALOS-1 (NC) 140.8118 42.5563 100±13 2.05±0.13 8.06±1.20 2.02 ALOS-1 (KC) 1977 site 140.8353 42.5416 396±29 132.18±5.21 10.05±1.09 5.06 JERS+ALOS-1+ALOS-2 1943 site 140.8662 42.5426 92±12 49.51±2.12 1.65±0.22 1.03 JERS+ALOS-1+ALOS-2
  14. Observation vs calculation 2000 vent 1977 vent 1943 vent ALOS-

    1 JERS ALOS- 1 ALOS- 2 JERS ALOS- 1 ALOS- 2
  15. Why is the apparent thermal diffusivity high? Hydrothermal convection effectively

    release heat from magma right after the intrusion? ü Lake Toya is right next to the volcano, providing groundwater. ü Frequent phreatomagmatic eruptions Question: Why is the apparent thermal diffusivity in the 1943 vent normal? Possible collaboration with IPGP: Reconstructing hydrothermal circulation beneath Usu volcano by numerical simulation.
  16. Usu Summary ü We measured ground deformation of Usu volcano

    by SAR images. ü Deformation is concentrated around lava domes that emerged during previous eruptions. ü The observed deformation is explained by thermal contraction of the intruded lava dome. ü The inferred apparent thermal diffusivity is larger than the lab-derived value especially right after the intrusion. ü Hydrothermal circulation effectively cools the intruded magma?
  17. Previous eruptions of Mt. Asama ü 1108, 1783: Large (VEI=5)

    eruptions ü 1900-60s: Intermittent explosive eruptions (VEI<=3) ü 1973, 1982, 1983, 2004: Middle-sized (VEI=2) eruptions ü 2008, 2009, 2015, 2019: Small and minor eruptions 15 Sep. 2004 15 Feb. 1973 30 Sep. 2004
  18. Magma pathway of Asama Eruptions in Aug. 2008 and Feb.

    2009 Enhanced seismicity Summer 2008- Shallow inflation Summer-winter 2008 Nagaoka et al. (EPSL, 2012) Aoki et al. (Geol. Soc. Lond. Spec. Publ., 2013)
  19. Motivation GPS stations ü Near-summit deformation? ü 2 GNSS sites

    at the summit. The next closest one is 4 km from the summit. ü No deformation field observed by SAR GPS baseline variations (Aoki et al., 2013) KAHG KAWG AVOG Eruption Eruption Eruption
  20. Time span Num. of images Path number Off-nadir angle (°)

    Azimuth angle (°) Resolution (Rg.×Azi. m) Num. of interferogram ALOS-2 20141028‒ 20180814 20 19 36.2 -169.7 (D) 1.4×2.1 75 Sentinel- 1A 20150411‒ 20180302 58 119 33.8 -166.8 (D) 2.3×14.0 187 Sentinel- 1B 20150430‒ 20180303 62 39 33.8 -10.5 (A) 2.3×14.0 220 SAR images ü ALOS-2 and Sentinel-1 images between 2014 and 2018. ü We processed Sentinel-1 images to enhance the temporal resolution.
  21. Challenges Mean coherence Time (Year) Summer Summer Winter Winter Winter

    ü Vegetation ü Snow in winter Normalized Difference Vegetation Index (NVDI) derived from Sentinel-2
  22. Data processing (1) Select SAR interferograms with small temporal and

    perpendicular baselines. (2) Combine both PS and DS targets for the phase analysis. (3) Apply the spatially adaptive phase filtering to improve the phase quality. (4) Exclude temporally noisy pixels. (5) 3D phase unwrapping (Hooper et al., 2004). StaMPS
  23. Average LOS velocities ü Deformation in NE and SE flanks.

    ü NE flank dominated by subsidence (6 mm/yr) with negligible (<1 mm/yr) (quasi-)EW motion. ü SE flank dominated by (quasi-)eastward motion (~7 mm/yr) with smaller subsidence (~2 mm/yr). Path 39 Path 119 ALOS-2 Path 19 Sentinel-1 ALOS-2 Descending Ascending NEF NEF NEF SEF SEF SEF
  24. Time Series ü Steady state between 2014 and 2018. ü

    Not affected by the 2015 eruption.
  25. NEF SEF Comparing with geological map The area of deformation

    corresponds to the 1783 lava flow. Lava with a thickness 20-90 m (Yasui & Koyaguchi, Bull. Volcanol., 2004) should give negligible thermoelastic contraction 100 years after the emplacement (Chaussard et al., J. Volcanol. Geotherm. Res., 2016; Wang & Aoki, JGR-Solid Earth, 2019). Flank instability dominated by north displacements? (InSAR cannot measure). 1783 eruption 1108 eruption
  26. Deformation at SE flank ALOS-2: Path 19 LOS velocity NEF

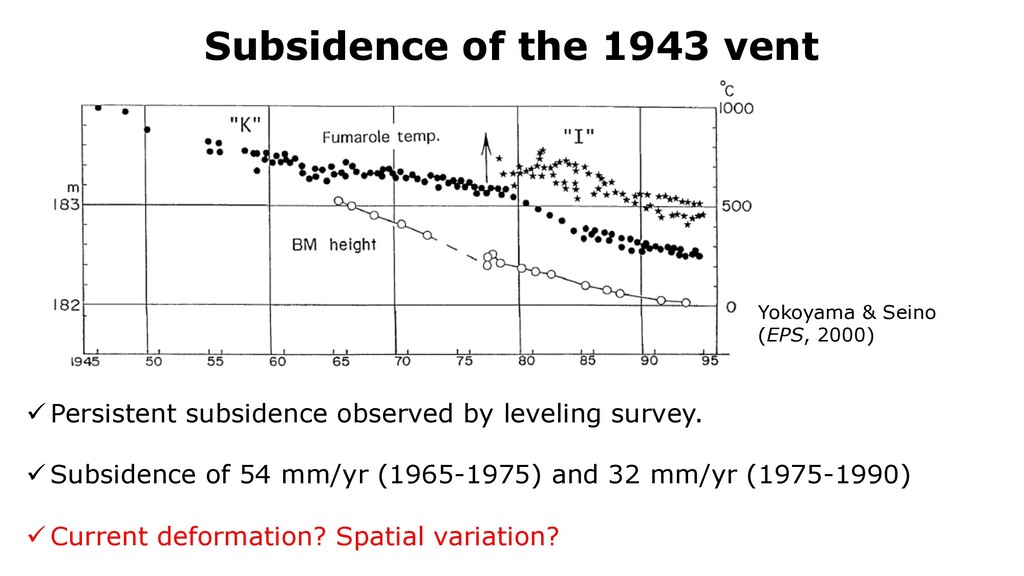
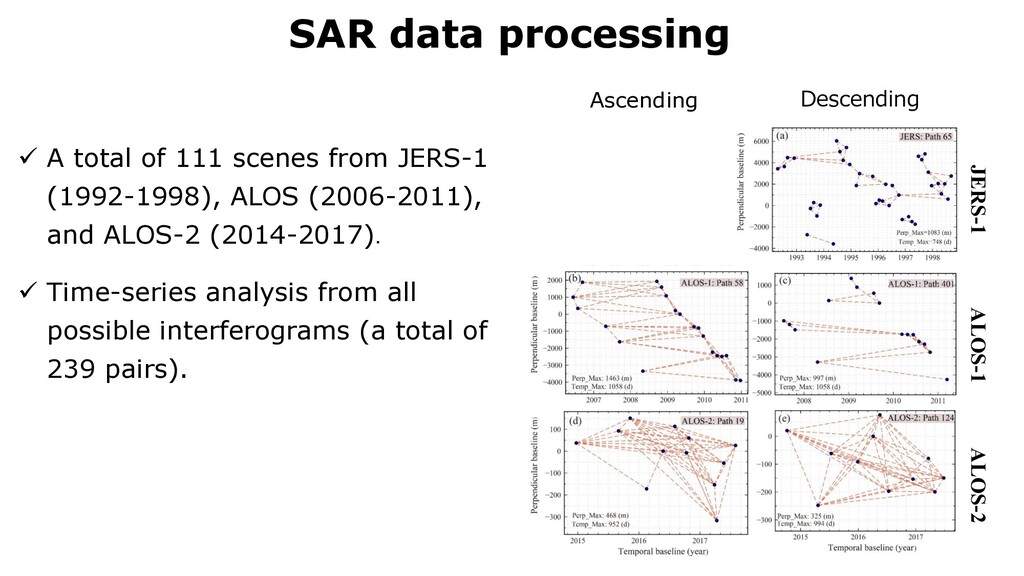
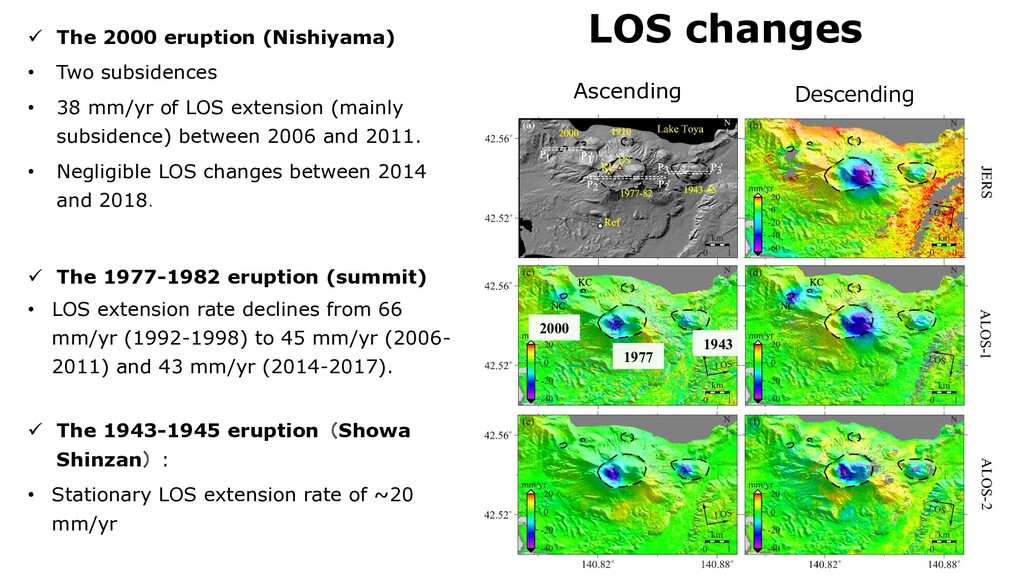
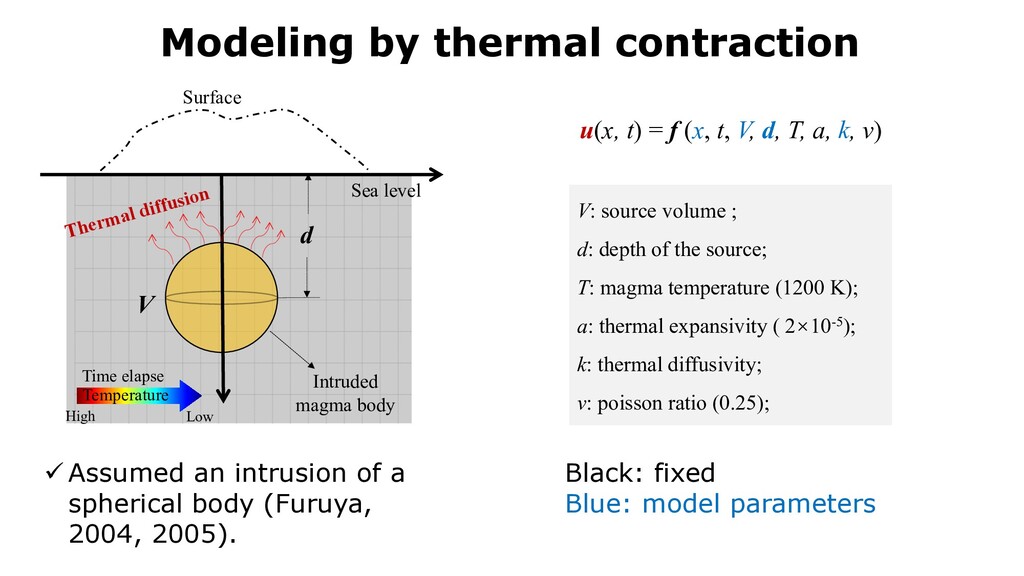
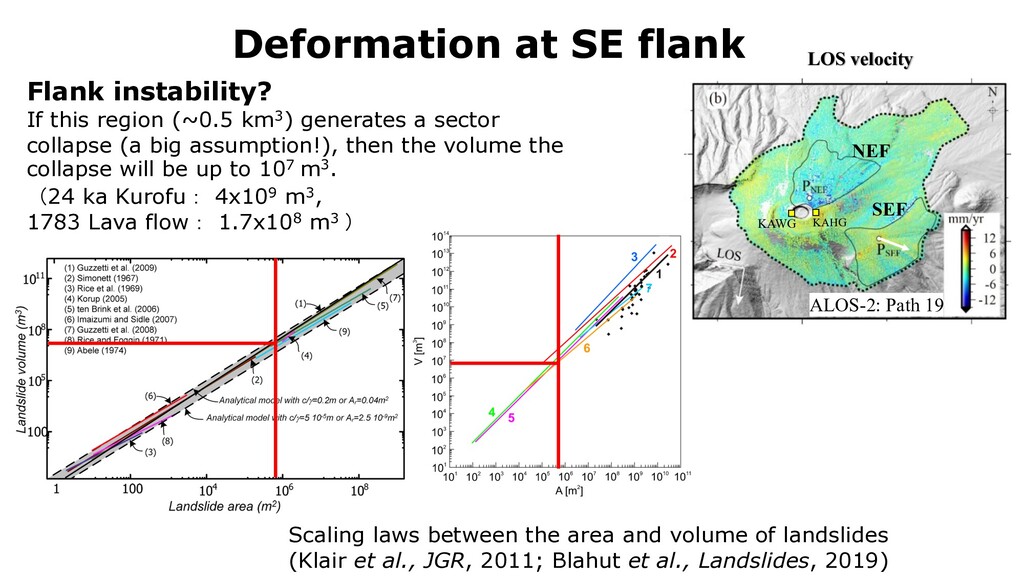
    SEF KAHG KAWG Flank instability? If this region (~0.5 km3) generates a sector collapse (a big assumption!), then the volume the collapse will be up to 107 m3. (24 ka Kurofu: 4x10⁹ m3, 1783 Lava flow: 1.7x10⁸ m3 ) ur model assuming model derived t ation (7)) and As / w · l. However, as 3.2, slide width, w, is not well con- cal considerations (in theory it could ally infinite slope). Two end‐members de widths: a lower bound arises from sting w / t, so that As / t · l, (this is d end‐member) and an approximate dth suggests w / l, so that As / l2. our model thus predicts scaling rang- 9 (for w / t) and t / As 0.27 (for w / l), scatter of t versus As observed by may be explained via the mechani- nge in landslide widths, w, which ge in mechanically permissible areas and 20 kPa. When comparing with the model results using the w / l scaling (Figure 15), and a power of 1.32, the cohesion is found to be in the range of 0.6–200 kPa. [32] The very large range of obtained permissible cohe- sions (more than 5 orders of magnitude, 10−3 to 200 kPa) versus the very narrow range of permissible power ex- ponents (d ranging by a few percent between 1.32 and 1.38) indicates that the value of the power exponent is not very sensitive to the specific cohesion value of the slope material, and also not very sensitive to the width of the slide, but is instead mostly sensitive to the aspect ratio t/l which really dictates the scaling between volume and surface area. This clearly supports, and partially explains, the observations that landslides from diverse conditions follow similar power laws. 14. Analytical model (based on w = t) superimposed on the observational field data. 8 of 10 Scaling laws between the area and volume of landslides (Klair et al., JGR, 2011; Blahut et al., Landslides, 2019) classification of remotely sensed imagery (e.g. Fiorucci et al. 2011) and their derivatives such as high resolution digital elevation models (e.g. Břežný and Pánek 2017) and Synthetic Aperture Radar (e.g. Strozzi et al. 2018). The rapid preparation of more reliable and representative land- slide inventories covering increasingly extensive regions is being facili- tated by these advancing technologies coupled with data mining from media reports (e.g. Battistini et al. 2013) or social networks (De Longueville et al. 2010; Yin et al. 2012). Unfortunately, the mapping of submarine landslides is limited by financial constraints and the time- consuming nature of seafloor investigations. Therefore, there is a ten- dency for submarine landslide inventories to come from regions of high economic importance, including both continental margins (Chaytor et al. 2009; Katz et al. 2015) and intraplate volcanic islands (e.g. Gee et al. 2001). In this regard, it is notable that much of the information about giant landslides on volcanic islands comes from economically prosperous archipelagos such as the Canary Islands and the Hawaiian Islands. To some extent, the global distribution of giant landslides on volcanic islands outlined here may be distorted by the fact that so much research focuses on these islands. In the future, it is expected that an increasing number of giant landslides will be recognised in more re- mote, less prosperous islands such as those in the Subantarctic. Conclusions In this report, a global database of giant landslides on volcanic islands has been presented. One hundred and eighty-two records are listed: seventy- five are hosted in the Atlantic Ocean, sixty-seven are hosted in the Pacific Fig. 4 Volume-area relationships calculated using the outlined database and from other literature sources V = αAγ. (1) Giant landslides on volcanic islands, α = 0.26, γ = 1.29 (Blahůt et al., this study); (2) Martian landslides, α = 2.53, γ = 1.23 (Crosta et al. 2018); (3) Martian landslides, α = 0.20, γ = 1.43 (Legros 2002); (4) all landslides, α = 0.15, γ = 1.33 (Larsen et al. 2010); (5) bedrock landslides, α = 0.19, IPL/WCoE activities
  27. Asama Summary ü We measure deformation around the summit of

    Asama Volcano between 2014 and 2018 by SAR images. ü Deformation is temporally steady without any perturbations by the 2015 eruption. ü Subsidence in the NE flank and eastward motion (with smaller subsidence) in the SE flank. ü Deformation in the NE flank cannot be explained by thermal contraction. ü Deformation in the SE flank is due to flank instability?
  28. Grand Summary ü SAR images are powerful in extracting small-scale

    deformation. ü Volcano deforms for various reasons including thermoelastic deformation and flank instability. ü ALOS and ALOS-2 (L-band) images work well even in vegetated regions, but temporal resolution (>14 days) is not favorable. ü Sentinel-1 (C-band) images do not work everywhere, but the temporal resolution (down to 6 days) is favorable. ü Future SAR missions (NISAR, ALOS-4, both L-band) will further enhance temporal resolution.