Upgrade to Pro — share decks privately, control downloads, hide ads and more …

合成開口レーダーで観測される火山の地殻変動:有珠山・浅間山

 合成開口レーダーで観測される火山の地殻変動:有珠山・浅間山

合成開口レーダーで観測される有珠山・浅間山の最近の地殻変動について日本大学文理学部で行ったセミナーのスライドです。

Yosuke Aoki

May 23, 2019
Tweet

More Decks by Yosuke Aoki

Other Decks in Science

Transcript

  1. R2 R1 内容 ü 合成開⼝レーダーの原理 ü 有珠⼭溶岩ドームの地殻変動 1992-2017 (Wang &

    Aoki, J. Geophys. Res. Solid Earth, 2019) ü 浅間⼭の地殻変動 2014-2018 (Wang, Aoki & Chen, Earth Planet. Space, in prep. )
  2. 合成開⼝レーダー(SAR)とは Nature 2000年10⽉26⽇号 (Amelung et al., 2000) ü ⼈⼯衛星より地殻変動を⾯的に撮影 ü

    ⾼い空間分解能(3-5 m) ü 地上観測の必要なし ü 昼夜・天気の別なく観測が可能 ung et al. (2000) was on the cover of Nature (Fig. 30). Note, however,
  3. SARは何をしているのか h’s surface. By convention, the direction of flight of

    the satellite is called ”azimuth” and the dir is the emission of microwaves is called ”range” (Fig. 8). A SAR sensor emits pulses of microw ü Radar = Radio detection and ranging ü ⼈⼯衛星から地⾯までの距離を測ってい る. ü ⼈⼯衛星から電磁波(レーダー波)を照 射し,多重反射して戻ってきた電磁波を 計測する. ü ⼈⼯衛星の両側の同じ距離の点を識別す るために,電磁波の照射⽅向は斜めでな くてはならない(真下ではいけない). ü ⽔⾯などの平らな⾯からは多重反射が少 ない.
  4. 2回観測し,地殻変動を抽出する. 光路差 縞模様の幅 観測される縞模様=軌道の効果+地 形の効果+地殻変動 SAR⼲渉解析(InSAR) ヤングの実験とのアナロジー schematic view of

    Young’s interference experiment. (b) An extension of (a) to three ellite orbits in two different timings are denoted by black lines dots. the point P in Fig. 13a, redoubling the strength or destroying each other depending r = r1 r2 ' xB R x = R B
  5. InSARは何を観測しているのか ements themselves like Figs. 4 and 5 may be

    more natural but it tends to lose mall-scale deformation. SAR s measure all three component displacements, InSAR measures a single com- pixel. Sensitivity of LOS to the three component displacement depends on ken from the ascending or descending orbit. The satellite flies from roughly cending orbit and the other way around in the descending orbit (Fig. 18) . The -looking SAR satellite such as ALOS and many others is roughly from west to orbit and from east to west from the descending orbit. When the orbit is offset egree of φ (Fig. 18), the LOS change is written by ∆Ra = ue cos φ sin θ + un sin φ sin θ − uv cos θ (28) ∆Rd = −ue cos φ sin θ + un sin φ sin θ − uv cos θ (29) ending orbits of the satellit. LOS is for a right-looking SAR satellit ü InSARは衛星から距離変化を計測 している. ü 衛星軌道は南から北(上昇軌道; ascending)もしくは北から南 (下降軌道; descending)なの で,視線⽅向は概ね⻄から東もし くは東から⻄になる. ü 南北成分に感度が低い. ü ⽔平成分よりも上下成分に感度が ⾼いが,観測される量は両者を分 離することはできない.. 視線距離変化と東⻄・南北・上下成分変位との関係
  6. ⽕⼭の地殻変動への応⽤ Amelung et al. (Nature, 2000) ü アクセス困難な場所の多い活⽕⼭で 地殻変動を観測するのに適している. ü

    活⽕⼭に特有の⼩スケールの地殻変 動を捉えるのに適している. ü 他の観測⼿段よりも時間分解能や精 度が悪い. With this background, SAR observations give us valuable informat tific interests as the study of Amelung et al. (2000) was on the cover o Figure 30: Cover of Nature on 26 October
  7. 有珠⼭の⽕⼭活動 1910 Activity time Eruptive Interval (yr) Location Eruption type

    Upheaval height (m) July ̶ Nov. 1910 57 North flank Phreatic 170 Dec. 1943 ̶ Sep. 1945 33 East flank Phreatomagmatic 280 Aug. 1977 ̶ Mar. 1982 32 Summit Phreatomagmatic 180 Mar. ̶ Aug. 2000 18 West flank Phreatomagmatic 80
  8. 視線距離変化 ü 2000年噴⽕ (⻄⼭) • 2箇所の沈降域 • 2006-2011年の視線距離変化 (概ね沈降) 速度は38

    mm/yr程度. • 2014-2018年の変動は検出できず. ü 1977-1982噴⽕(⼭頂域) • 視線距離変化は66 mm/yr(1992- 1998),45 mm/yr(2006-2011), 43 mm/yr(2014-2018年)と徐々に減 衰. ü 1943-1945噴⽕(昭和新⼭): • 視線距離変化は20 mm/yrで⼀定 Descending Ascending 2000 1977 1943
  9. 熱収縮によるモデリング V d Sea level Intruded magma body Surface Thermal

    diffusion Temperature Time elapse High Low V: source volume ; d: depth of the source; T: magma temperature (1200 K); a: thermal expansivity ( 2×10⁻⁵); k: thermal diffusivity; v: poisson ratio (0.25); u(x, t) = f (x, t, V, d, T, a, k, v) ü 球形マグマの貫⼊を仮定. ü 貫⼊時刻(既知)・マグマ温度・熱膨張率・⺟岩のポアソン⽐を固定し,観測をもっともよく説 明する貫⼊位置・貫⼊体積・熱拡散係数を求める.
  10. 最適なパラメータ ü 貫⼊マグマの深さは海⾯下400 mより浅い. ü 昭和新⼭(1943-1945年噴⽕)以外について,熱拡散係数は実験室で 求められる値(0.1–1×10⁻⁵ m2/s) より1桁程度⼤きい. Longitude

    (°) Latitude (°) Depth ( m b.s.l) Volume (×106 m3) Thermal diffusivity (×10-5 m2/s) Misfit Data source 2000 site 140.8034 42.5541 213±19 6.67±0.21 8.21±1.01 2.78 ALOS-1 (NC) 140.8118 42.5563 100±13 2.05±0.13 8.06±1.20 2.02 ALOS-1 (KC) 1977 site 140.8353 42.5416 396±29 132.18±5.21 10.05±1.09 5.06 JERS+ALOS-1+ALOS-2 1943 site 140.8662 42.5426 92±12 49.51±2.12 1.65±0.22 1.03 JERS+ALOS-1+ALOS-2
  11. ⾒かけ熱拡散係数はなぜ⼤きいか︖ 豊富な地下⽔によって貫⼊直後にマグマの熱が効率的に逃がさ れているのではないか︖ (傍証) ü 洞爺湖がすぐ隣にあり,地下⽔の供給源はある. ü 頻発するマグマ⽔蒸気噴⽕ ü ⾼い透⽔性を持つ岩⽯の存在(Matsushima,

    2003) (疑問) 昭和新⼭の⾒かけ熱拡散係数は実験室によって求められる値と同程度である.貫 ⼊直後だけみかけ熱拡散係数が⼤きいのはなぜ︖ (今後の課題) 有珠⼭溶岩ドーム群の熱⽔活動を数値シミュレーションなど定量的な⽅法で再現 する.
  12. 有珠まとめ ü SARデータをもちいて有珠⼭の1992年から2017年までの地殻変動を 計測した. ü 顕著な変動は過去の噴⽕にともない出現した溶岩ドーム周辺に局在す る. ü 観測された変動は貫⼊した溶岩ドームの熱収縮により説明できる. ü

    観測を説明するマグマの⾒かけ熱拡散係数は,特に貫⼊直後において 実験室で求められた値より⼤きい. ü 貫⼊直後は豊富な地下⽔が効率的にマグマの熱を冷やしている︖
  13. 浅間⼭の過去の噴⽕ ü 1108, 1783: ⼤噴⽕ ü 1900-60s: 爆発的な噴⽕の繰り返し ü 1973,

    1982, 1983, 2004: 中規模噴⽕ ü 2008年8⽉: ⼩規模噴⽕ ü 2009年2⽉: ⼩規模噴⽕ 140km離れた東京にもわずかな降灰 ü 2015年6⽉︓微噴⽕ 2004年9⽉15⽇ 1973年2月15日 2004年9⽉30⽇の⽕映
  14. Magma pathway of Asama Eruptions in Aug. 2008 and Feb.

    2009 Enhanced seismicity Summer 2008- Shallow inflation Summer-winter 2008 Nagaoka et al. (EPSL, 2012) Aoki et al. (Geol. Soc. Lond. Spec. Publ., 2013)
  15. 動機 GPS stations ü ⼭体は膨張と収縮を繰り返している ü GNSS観測点は⼭頂付近に2点,次に近 いのは⼭頂から4 km ü

    SARでは地殻変動は調べられていない ü 冬季の降雪と急峻な地形がSARでの地 殻変動観測に適していない. GPS baseline variations (Aoki et al., 2013) KAHG KAWG AVOG Eruption Eruption Eruption
  16. Time span Num. of images Path number Off-nadir angle (°)

    Azimuth angle (°) Resolution (Rg.×Azi. m) Num. of interferogram ALOS-2 20141028‒ 20180814 20 19 36.2 -169.7 (D) 1.4×2.1 75 Sentinel- 1A 20150411‒ 20180302 58 119 33.8 -166.8 (D) 2.3×14.0 187 Sentinel- 1B 20150430‒ 20180303 62 39 33.8 -10.5 (A) 2.3×14.0 220 SAR画像 ü2014年から2018年までのALOS-2およびSentinel-1データを⽤いた. üデータ数を稼ぐためにSenitnel-1衛星のデータも⽤いた.
  17. 結果︓平均視線距離変化 ü 北東麓と南東麓に変位が⾒ られる. ü 北東麓は沈降が主(~6 mm/yr)で⽔平変動は⼩ さい(<1 mm/yr). ü

    南東麓は東⽅向への変位が 卓越(~7 mm/yr)し,微 ⼩な沈降(~2 mm/yr)も ある. Path 39 Path 119 ALOS-2 Path 19 Sentinel-1 ALOS-2 Descending Ascending NEF NEF NEF SEF SEF SEF
  18. NEF SEF 地質図との⽐較 北東麓の変動域は1783年天明噴⽕の溶岩流 と⼀致する. 溶岩流の厚さが20-90 mとすると(Yasui & Koyaguchi, Bull.

    Volcanol., 2004)熱 収縮による変動は噴⽕後100年前後で観測 されなくなるはず(Chaussard et al., JVGR, 2016; Wang & Aoki, 2019). 1783 eruption 1108 eruption Chaussard et al. (2016)
  19. 観測された沈降は熱⽔活動によるもの︖ 重⼒および⽐抵抗構造は東麓に熱⽔活動が発達して いることを⽰唆する(Kazama et al., JGR, 2014; Usui et al.,

    2017). 北東麓の地殻変動の解釈︖ Old Magma Body Hydrothermal fluids Resistivity Structure (Usui et al., GJI, 2017) Aoki et al., 2013 Deformation area Old magma bodies (~24,000 years ago) Recent intrusions (e.g., 2004, 2009)
  20. 南東麓の地殻変動 ALOS-2: Path 19 LOS velocity NEF SEF KAHG KAWG

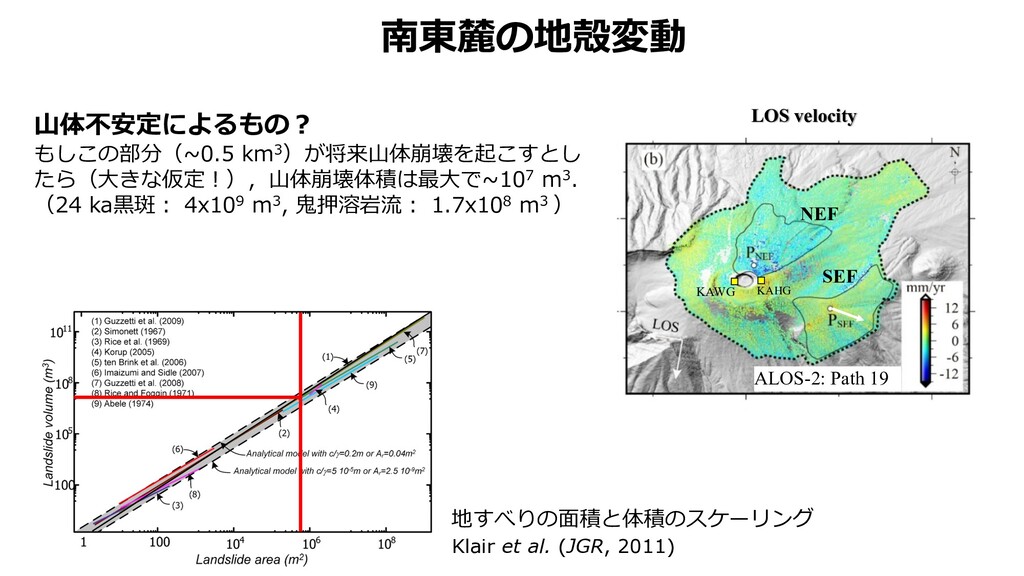
    ⼭体不安定によるもの︖ もしこの部分(~0.5 km3)が将来⼭体崩壊を起こすとし たら(⼤きな仮定︕),⼭体崩壊体積は最⼤で~107 m3. (24 ka⿊斑︓ 4x10⁹ m3, ⻤押溶岩流︓ 1.7x10⁸ m3 ) gure 2b], which show that t‐As scaling may t / As m, with m = 0.31 ± 0.19 (i.e., there is ield data, yet on average, large slides are er). Predictions for t versus As scaling may om our model assuming model derived t (equation (7)) and As / w · l. However, as ction 3.2, slide width, w, is not well con- chanical considerations (in theory it could laterally infinite slope). Two end‐members or slide widths: a lower bound arises from uggesting w / t, so that As / t · l, (this is trained end‐member) and an approximate r width suggests w / l, so that As / l2. (7), our model thus predicts scaling rang- As 0.39 (for w / t) and t / As 0.27 (for w / l), the scatter of t versus As observed by 2010] may be explained via the mechani- le range in landslide widths, w, which a range in mechanically permissible areas compared with the lower range of power exponents found from the analysis (i.e., d = 1.36) the values of the scaled cohesions c/g are an order of magnitude larger (between 0.005 and 1 m) leading to cohesion ranging between 10−1 and 20 kPa. When comparing with the model results using the w / l scaling (Figure 15), and a power of 1.32, the cohesion is found to be in the range of 0.6–200 kPa. [32] The very large range of obtained permissible cohe- sions (more than 5 orders of magnitude, 10−3 to 200 kPa) versus the very narrow range of permissible power ex- ponents (d ranging by a few percent between 1.32 and 1.38) indicates that the value of the power exponent is not very sensitive to the specific cohesion value of the slope material, and also not very sensitive to the width of the slide, but is instead mostly sensitive to the aspect ratio t/l which really dictates the scaling between volume and surface area. This clearly supports, and partially explains, the observations that landslides from diverse conditions follow similar power laws. 地すべりの⾯積と体積のスケーリング Klair et al. (JGR, 2011)
  21. Earth Planets and Space 特集号 L-band Synthetic Aperture Radar: Current

    and future applications to Earth Sciences https://earth-planets-space.springeropen.com/lbsar 投稿締め切り: 2019年12⽉31⽇ ゲストエディタ︓⻘⽊陽介(東⼤), 古屋正⼈(北⼤), Francesco de Zan (DLR), Marie-Pierre Doin (ISTerre), Michael Eineder (DLR), ⼤⽊真⼈ (JAXA), Mark Simons (Caltech), Tim Wright (Univ. Leeds)