dollar total economic loss [Howitt et al., 2014] Australian Millennium drought [van Dijk et al., 2013] The worst record since European settlement of Australia [Gergis et al., 2012] Amazon drought [Lewis., 2011] Response of largest carbon sink to drought is uncertain [e.g., Morton et al., 2014; Samanta et al., 2010] Horn of Africa & Sahel drought [Anderson et al., 2013] The food shortages affected 31 million people [e.g., Boyd et al., 2013] Future change in aridity is very uncertain. [e.g., Dai, 2011; Roderick et al., 2015]
climate variability Precipitation deficiency, high temperature etc… Soil water deficiency Plant water stress, reduced biomass and yield Reduced stream flow, inflow to reservoirs, Groundwater deficiency, …… Economic, Social, and Environmental impacts [from National Drought Mitigation Center, University of Nebraska-Lincoln, USA] See also [Mishra and Singh, 2010] Meteorological Ecological Hydrological Drought is multi-sector and multi-scale phenomena. Couplings between hydrology and ecology are important to quantify droughts.
model) Dynamic Vegetation Model (DVM) WEB-DHM-Veg can simulate soil moisture, groundwater, river discharge, and vegetation growth (and their interactions).
rainfall JRA25 reanalysis [Onogi et al., 2007] Biomass Soil Moisture Groundwater River discharge Satellite LAI (AVHRR) Calibration & Validation In-situ river discharge Calibration & Validation Agricultural Drought Index Nationwide crop production & Reports about past droughts Validation Hydrological Drought Index Drought Analysis Drought Indices - Standardized Anomaly Index (SA index) – [Jaranilla-Sanchez et al., 2011]
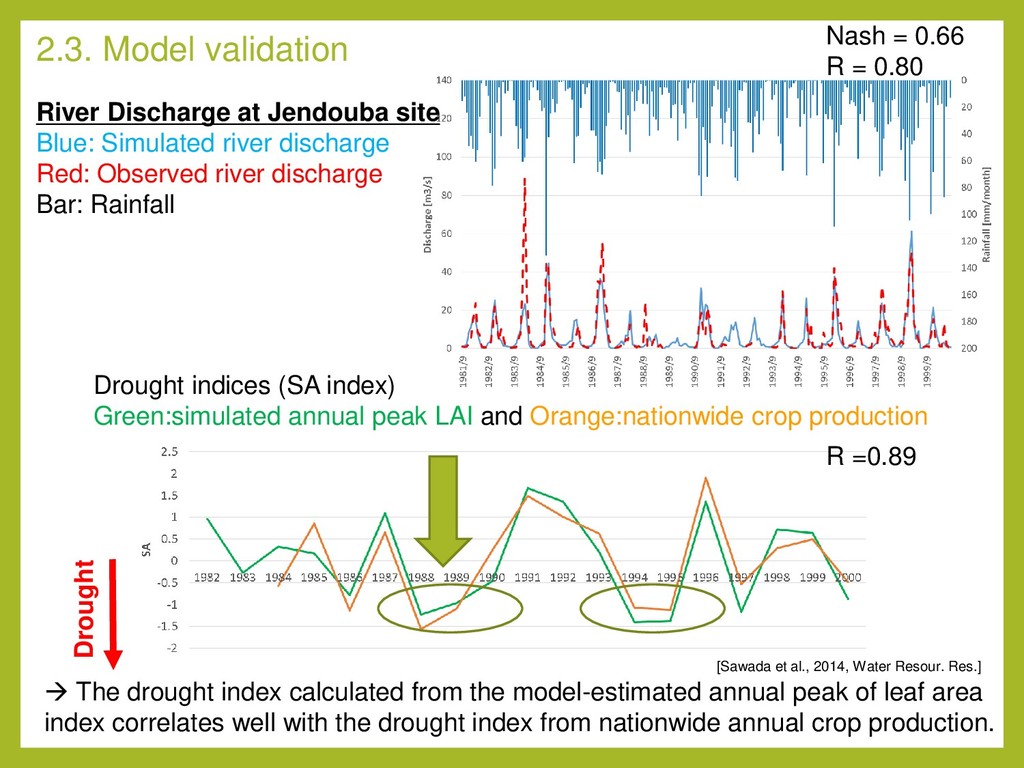
LAI and Orange:nationwide crop production The drought index calculated from the model-estimated annual peak of leaf area index correlates well with the drought index from nationwide annual crop production. R =0.89 Drought Nash = 0.66 R = 0.80 River Discharge at Jendouba site Blue: Simulated river discharge Red: Observed river discharge Bar: Rainfall [Sawada et al., 2014, Water Resour. Res.]
River discharge Gray: Groundwater level Green: Leaf Area Index Drought Agricultural Drought Hydrological Drought Historic agricultural droughts predominantly occurred prior to hydrological droughts and the hydrological drought lasted much longer, even after crop production has recovered. [Sawada et al., 2014, Water Resour. Res.]
simulation) Data (observation) Good: - We can calculate everything - We can predict the future Bad: - (generally) less accurate Good: - (generally) more accurate Bad: - We can observe a small subset of the world - We cannot predict the future Data Assimilation is strongly recommended to improve our skill of monitoring and predicting natural disasters.
microwave region Radiation from soil depends on Surface Soil Moisture Attenuation by canopy Radiation from canopy depend on Vegetation water content • Microwave brightness temperature is influenced by surface soil moisture, vegetation water content, and temperature [e.g., Paloscia and Pampaloni, 1988] • It is not strongly influenced by atmospheric condition AMSR-E AMSR2
Soil Moisture Green: Optimized, Black:Default, Red:Observed, Yellow:Observed (Microwave VOD (NASA LPRM)) Optimization improves the skill of estimating surface soil moisture and vegetation dynamics at the same time. [Sawada and Koike, 2014 JGR-A]
Climatorogy Green: Horn of Africa drought (reanalysis) Leaf Area Index timeseries CLVDAS (Ensemble Stream Prediction) CLVDAS (Real Predicion) [Sawada and Koike, 2016 JGR-A] Ecosystem damage of the Horn of Africa drought is predictable 10 months before.
Area Index timeseries CLVDAS (Ensemble Stream Prediction) CLVDAS (Real Predicion) Gray: Climatorogy Green: Horn of Africa drought (reanalysis) [Sawada and Koike, 2016 JGR-A]
Area Index timeseries CLVDAS (Ensemble Stream Prediction) CLVDAS (Real Predicion) Gray: Climatorogy Green: Horn of Africa drought (reanalysis) [Sawada and Koike, 2016 JGR-A]
Area Index timeseries CLVDAS (Ensemble Stream Prediction) CLVDAS (Real Predicion) Gray: Climatorogy Green: Horn of Africa drought (reanalysis) Ensemble stream prediction (with no meteorological prediction skill) can predict ecosystem damages to some extent in the short lead time predictions. [Sawada and Koike, 2016 JGR-A]
Drought @Morocco @Algeria @Tunisia LAI anomaly from CLVDAS CLVDAS can reproduce the decrease of nationwide crop production [Sawada and Koike, in prep]
Drought @Morocco @Algeria @Tunisia LAI anomaly from CLVDAS CLVDAS can reproduce the decrease of nationwide crop production [Sawada and Koike, in prep]
Algeria & Tunisia Drought @Morocco @Algeria @Tunisia LAI anomaly from CLVDAS CLVDAS can reproduce the decrease of nationwide crop production [Sawada and Koike, in prep]
Drought @Morocco @Algeria @Tunisia LAI anomaly from CLVDAS CLVDAS can reproduce the decrease of nationwide crop production [Sawada and Koike, in prep]
inter-disciplinary aspects of your research? If so, what were the benefits? DIAS is designed to go across the boundary of disciplines. It is necessary to solve the natural disaster related issues. Q2. Did your research benefit from the data and model integration DIAS offers? DIAS is the only-one platform ever which makes it possible to the inter- disciplinary drought monitoring & prediction in the real-time basis. Q3. With regard to the Sustainable Development Goals and the Future Earth project, how should DIAS be developed? What changes and improvements would you like to see? DIAS should be the leader of open science. We need to improve the transparency of data management and computer codes, which is necessary to contribute to decision making.
![1. Introduction [Photos from The Telegraph http://www.telegraph.co.uk]](https://files.speakerdeck.com/presentations/1212a00b6f2d42d98bb88579cbc82195/slide_1.jpg)
![1.1. Motivation [Shukla et al., 2015] California drought 2.2 million](https://files.speakerdeck.com/presentations/1212a00b6f2d42d98bb88579cbc82195/slide_2.jpg)
![4.1. Case study 1: Horn of Africa drought [FAO, 2011]](https://files.speakerdeck.com/presentations/1212a00b6f2d42d98bb88579cbc82195/slide_15.jpg)