Upgrade to Pro — share decks privately, control downloads, hide ads and more …

Debugging

Abhi
July 31, 2015

 Debugging

Debugging

Abhi

July 31, 2015
Tweet

More Decks by Abhi

Other Decks in Technology

Transcript

  1. Agenda  Mule Project Creation  Basic Structure  Simple

    Program  Run Program  Topic for next session  Reference
  2. Run Program in Debug We will continue with the program

    mentioned in previous session. Run the program in Debug mode.
  3. Debug Mode Continues -Mule application will be running in “Mule

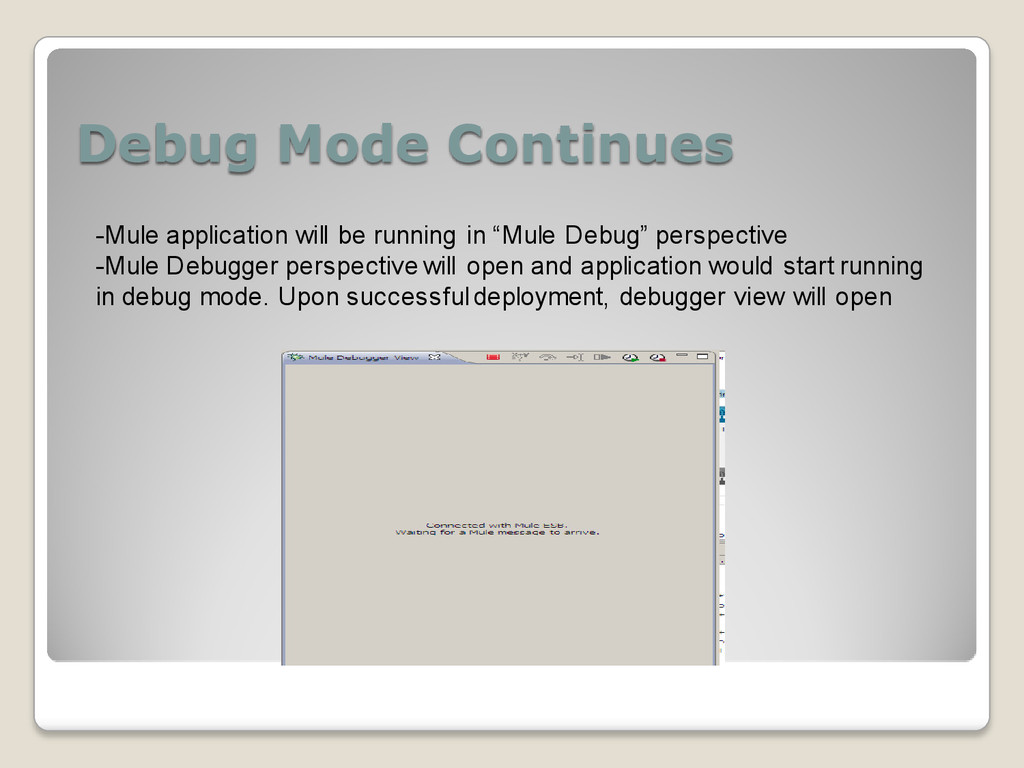
    Debug” perspective -Mule Debugger perspective will open and application would start running in debug mode. Upon successful deployment, debugger view will open
  4. Some Debugging Issues -There could be some scenarios where application

    might not run in debug mode. Anypoint doesn’t show the error sometimes in that case. -Possible Solution -Change the port number for debug mode -Restart the workspace -Port number can be changed by going into below -Right click -> Debug-> Debug Configurations -> Mule Debugger-> Port
  5. Apply Breakpoints -Breakpoints can be applied easily by right click

    on any of the message processor/inbound/outbound endpoints
  6. Debug Program (Continues) Application will be paused on break points

    and debugger view will open with all the properties associated with the message at that time
  7. Debug Program (Continues) You can play/evaluate with mule expression evaluator

    in order to check the expression syntax you are writing
  8. Debug Program (Continues) You can play/evaluate with mule expression evaluator

    in order to check the expression syntax you are writing
  9. Debug Program (Continues..) Program can be continued.. By pressing f8

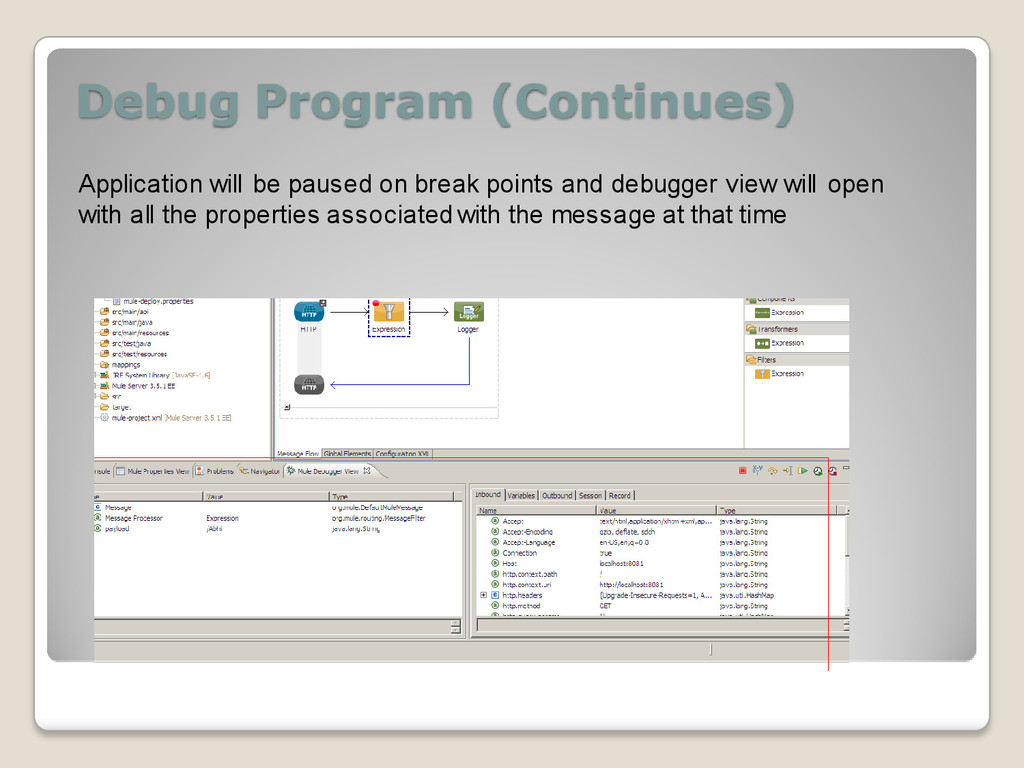
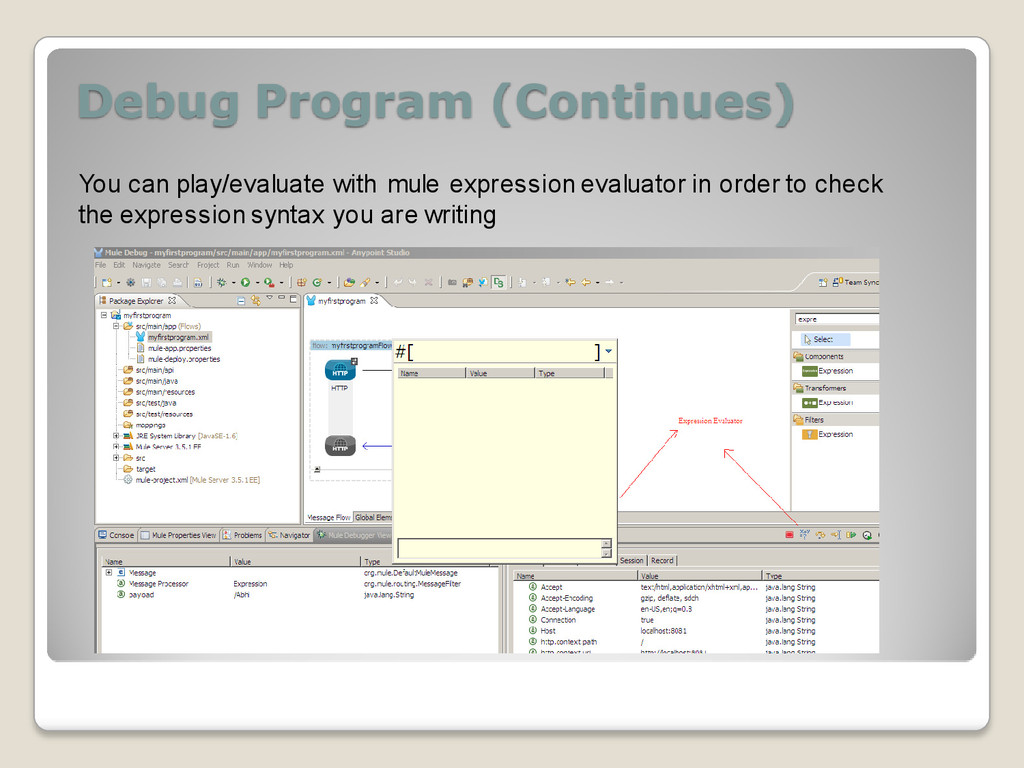
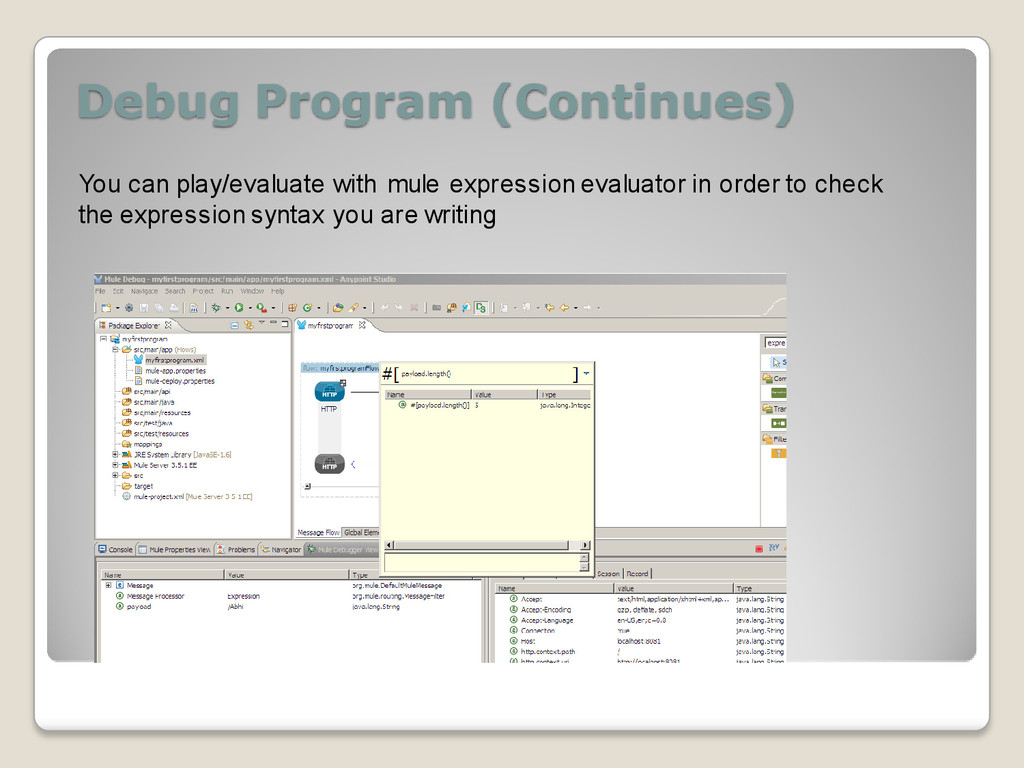
    or next message processor button under mule debugger Debugger is having capabilities to check the properties at runtime, evaluate the expression, analyze each component/processor in detail