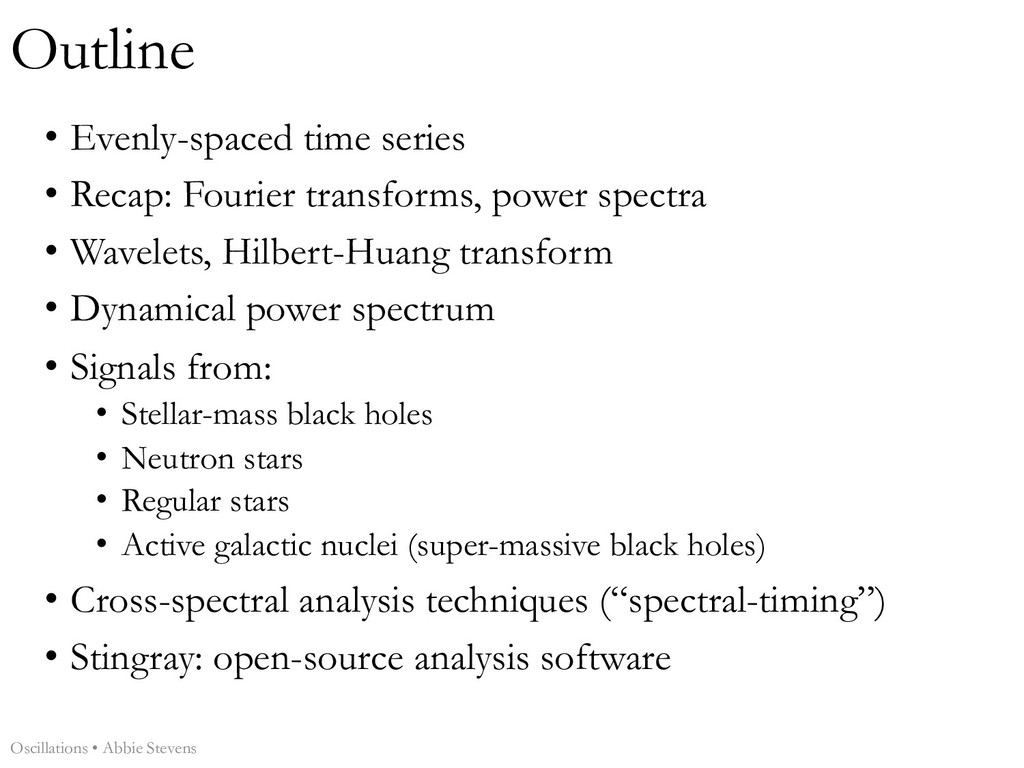
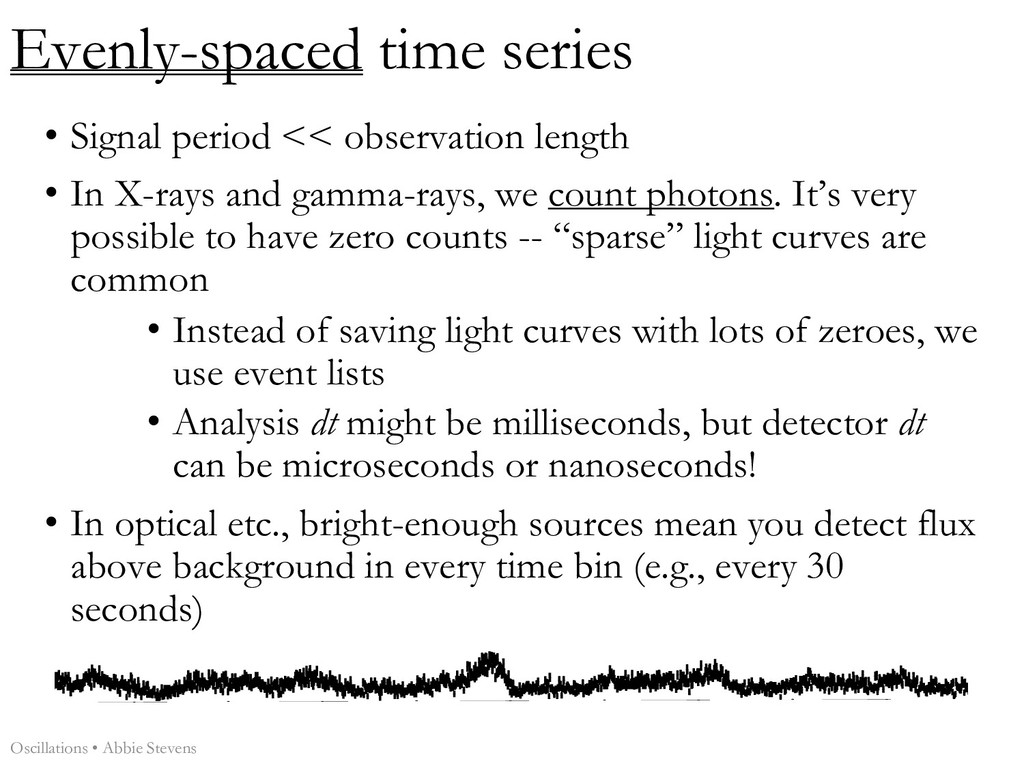
In X-rays and gamma-rays, we count photons. It’s very possible to have zero counts -- “sparse” light curves are common • Instead of saving light curves with lots of zeroes, we use event lists • Analysis dt might be milliseconds, but detector dt can be microseconds or nanoseconds! • In optical etc., bright-enough sources mean you detect flux above background in every time bin (e.g., every 30 seconds) Oscillations • Abbie Stevens 1700 1702 1704 1706 1708 1710 2000 4000 6000 8000 10 4 1.2×10 4 Time (s) Start Time 12339 7:28:14:566 Stop Time 12339 7:29:32:683 Bin time: 0.7812E−02 s
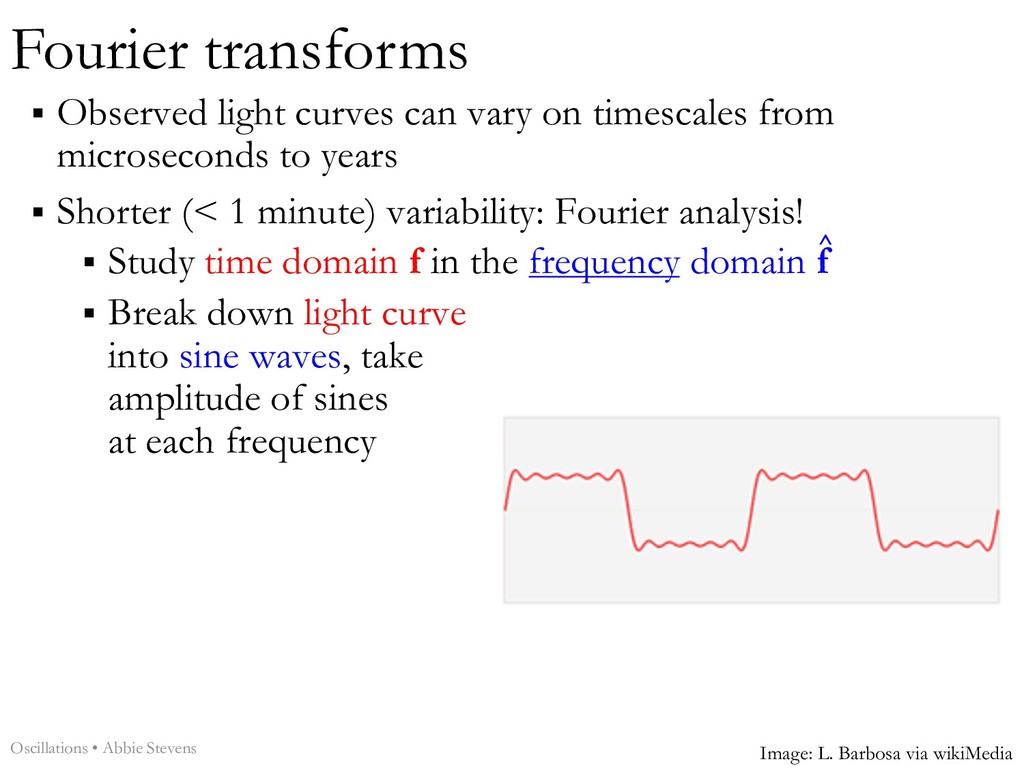
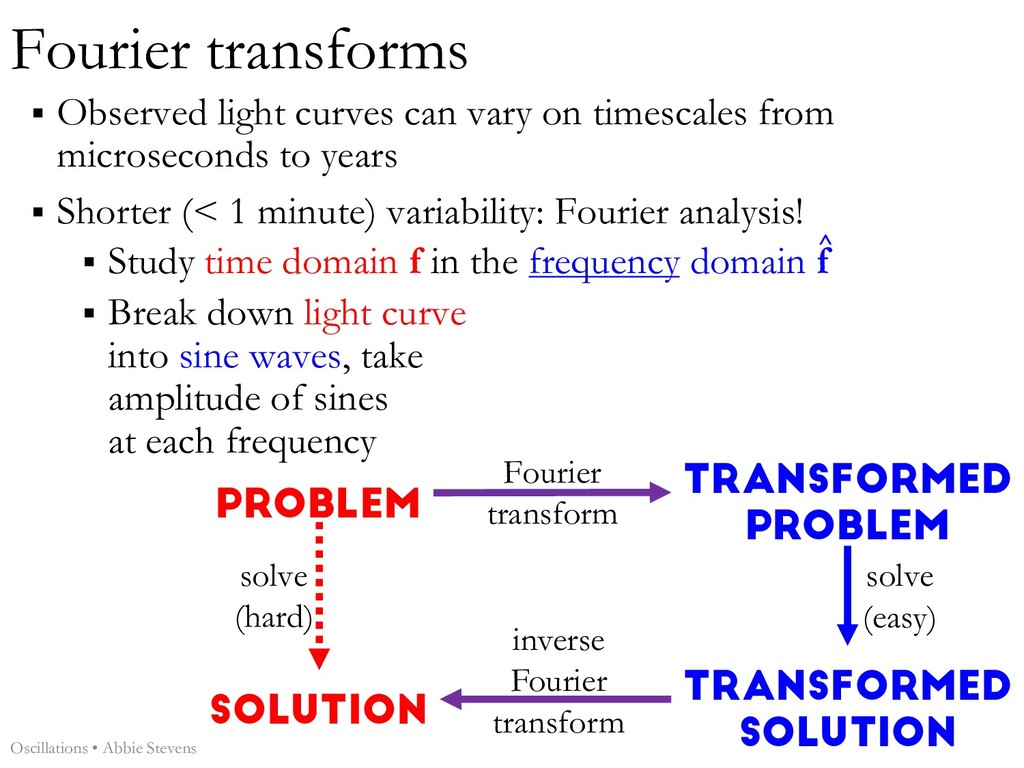
from microseconds to years § Shorter (< 1 minute) variability: Fourier analysis! § Study time domain f in the frequency domain f § Break down light curve into sine waves, take amplitude of sines at each frequency ^ Image: L. Barbosa via wikiMedia Oscillations • Abbie Stevens
from microseconds to years § Shorter (< 1 minute) variability: Fourier analysis! § Study time domain f in the frequency domain f § Break down light curve into sine waves, take amplitude of sines at each frequency ^ Problem solution solve (hard) Transformed problem Transformed solution solve (easy) Fourier transform inverse Fourier transform Oscillations • Abbie Stevens
5000 104 1.5×10⁴ Count/sec Time (s) Start Time 10168 18:16:52:570 Stop Time 10168 18:17:08:180 Bin time: 0.1562E−01 s Time domain Light curve Frequency/Fourier domain Power density spectrum FOURIER TRANSFORM2 Light curve broken into equal-length chunks, take power spectrum of each chunk, average those together x(t)→X(ν) P(ν)=X(ν)X*(ν) =|X(ν)|2 Oscillations • Abbie Stevens
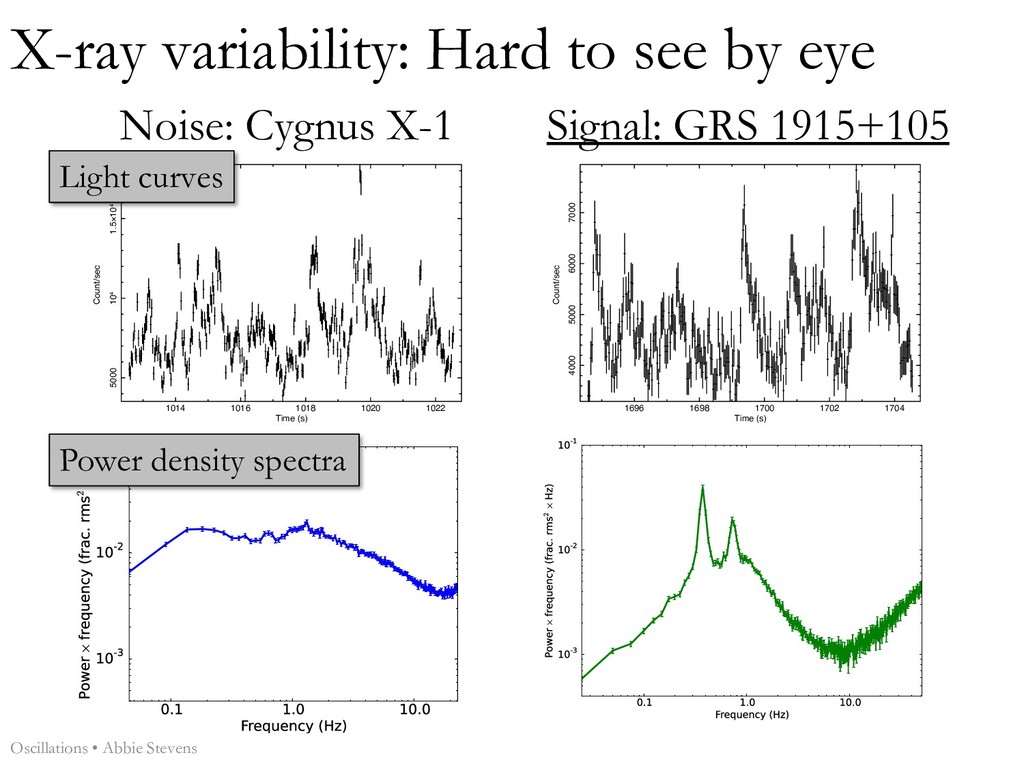
1020 1022 5000 104 1.5×10⁴ Count/sec Time (s) CYGNUS_X−1 Start Time 10168 18:16:52:578 Stop Time 10168 18:17:02:547 Bin time: 0.3125E−01 s 1696 1698 1700 1702 1704 4000 5000 6000 7000 Count/sec Time (s) GRS1915+105 Start Time 12339 7:28:14:582 Stop Time 12339 7:28:24:542 Bin time: 0.4000E−01 s Light curves Power density spectra Noise: Cygnus X-1 Signal: GRS 1915+105 Oscillations • Abbie Stevens
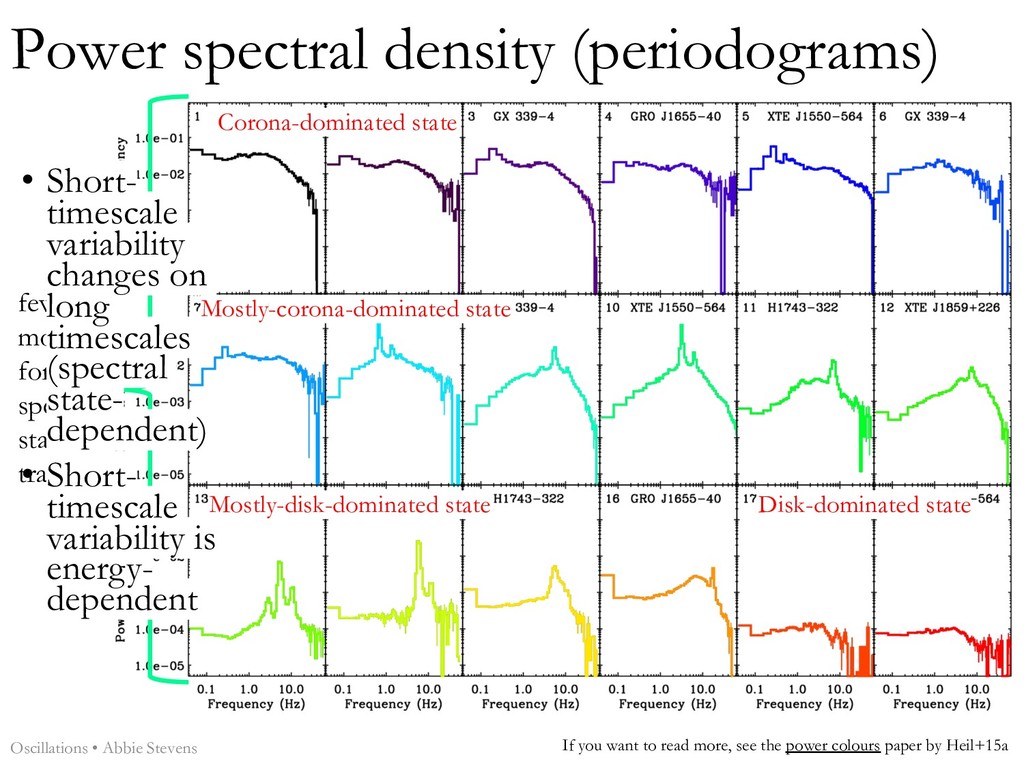
few months for full spectral state transition Mostly-disk-dominated state • Short- timescale variability changes on long timescales (spectral state- dependent) • Short- timescale variability is energy- dependent If you want to read more, see the power colours paper by Heil+15a Oscillations • Abbie Stevens
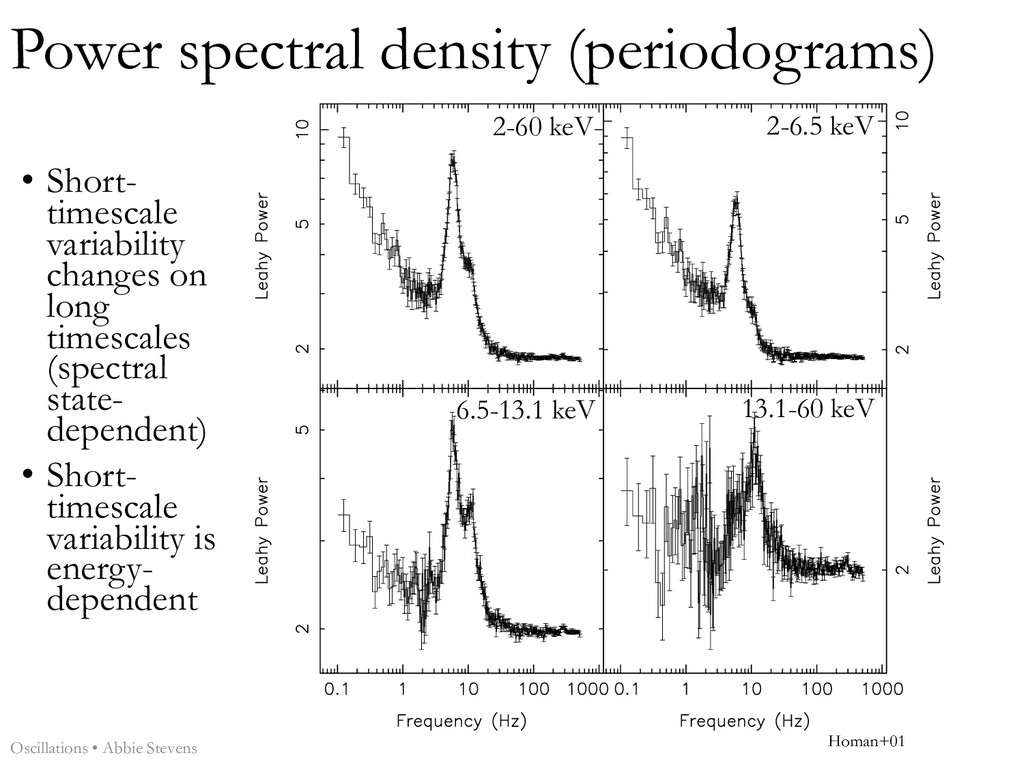
long timescales (spectral state- dependent) • Short- timescale variability is energy- dependent Oscillations • Abbie Stevens A B C D 2-60 keV 6.5-13.1 keV 13.1-60 keV 2-6.5 keV Homan+01
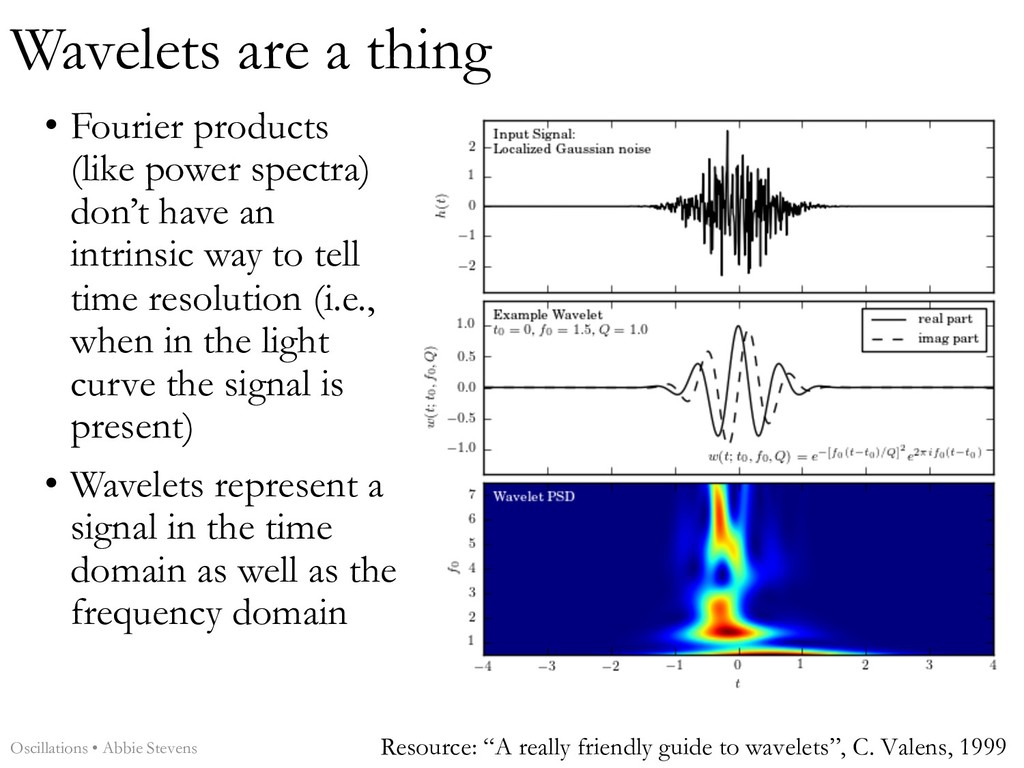
don’t have an intrinsic way to tell time resolution (i.e., when in the light curve the signal is present) • Wavelets represent a signal in the time domain as well as the frequency domain Oscillations • Abbie Stevens Resource: “A really friendly guide to wavelets”, C. Valens, 1999
segments) follow a chi-squared distribution with 2 degrees of freedom, about the underlying true power spectrum • Errors are statistically well-defined and well-understood (and easy to compute!) • Wavelets do not follow such a well-defined and well- known distribution • No clear way to assess statistical significance of a signal (which is one of the things we often want to do) Oscillations • Abbie Stevens
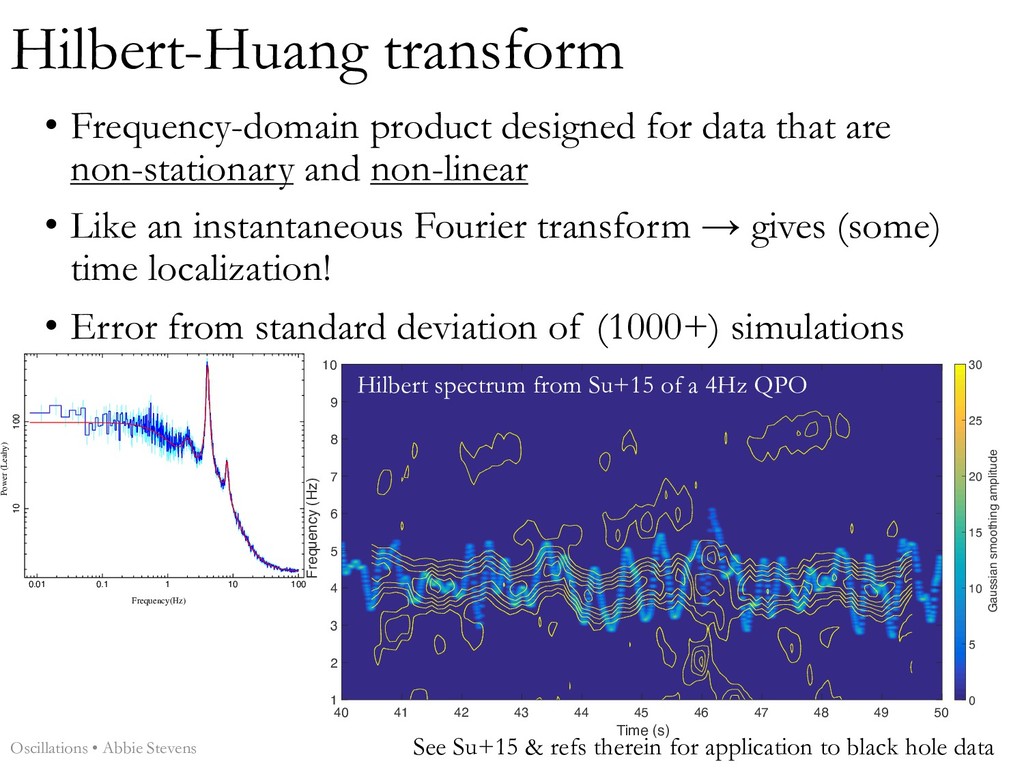
48 49 50 Frequency (Hz) 1 2 3 4 5 6 7 8 9 10 Gaussian smoothing amplitude 0 5 10 15 20 25 30 Hilbert-Huang transform • Frequency-domain product designed for data that are non-stationary and non-linear • Like an instantaneous Fourier transform → gives (some) time localization! • Error from standard deviation of (1000+) simulations Oscillations • Abbie Stevens See Su+15 & refs therein for application to black hole data 0.01 0.1 1 10 100 10 100 Frequency(Hz) Power (Leahy) Hilbert spectrum from Su+15 of a 4Hz QPO
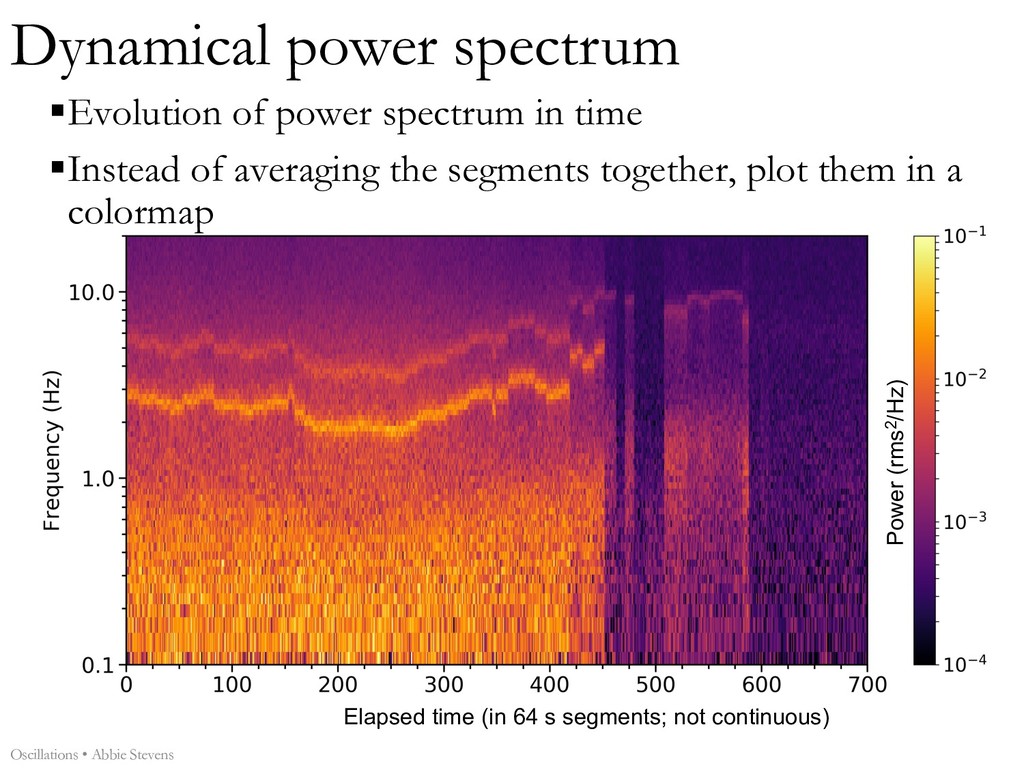
(in 64 s segments; not continuous) §Evolution of power spectrum in time §Instead of averaging the segments together, plot them in a colormap Dynamical power spectrum Oscillations • Abbie Stevens
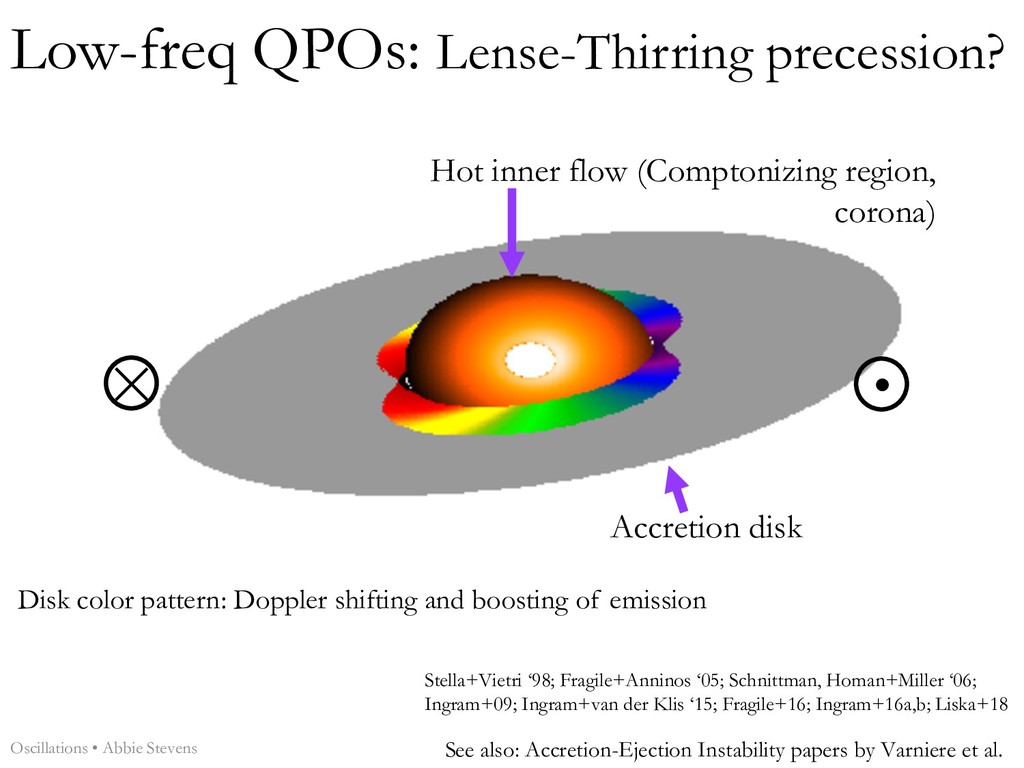
inner flow (Comptonizing region, corona) Accretion disk Disk color pattern: Doppler shifting and boosting of emission Stella+Vietri ‘98; Fragile+Anninos ‘05; Schnittman, Homan+Miller ‘06; Ingram+09; Ingram+van der Klis ‘15; Fragile+16; Ingram+16a,b; Liska+18 See also: Accretion-Ejection Instability papers by Varniere et al.
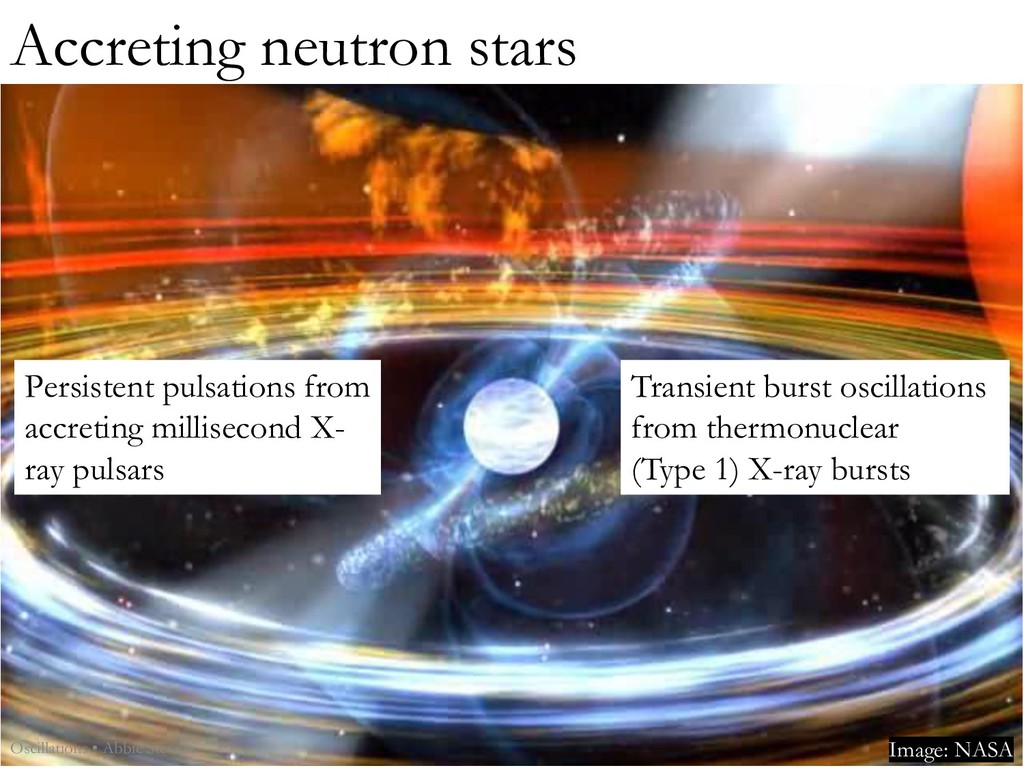
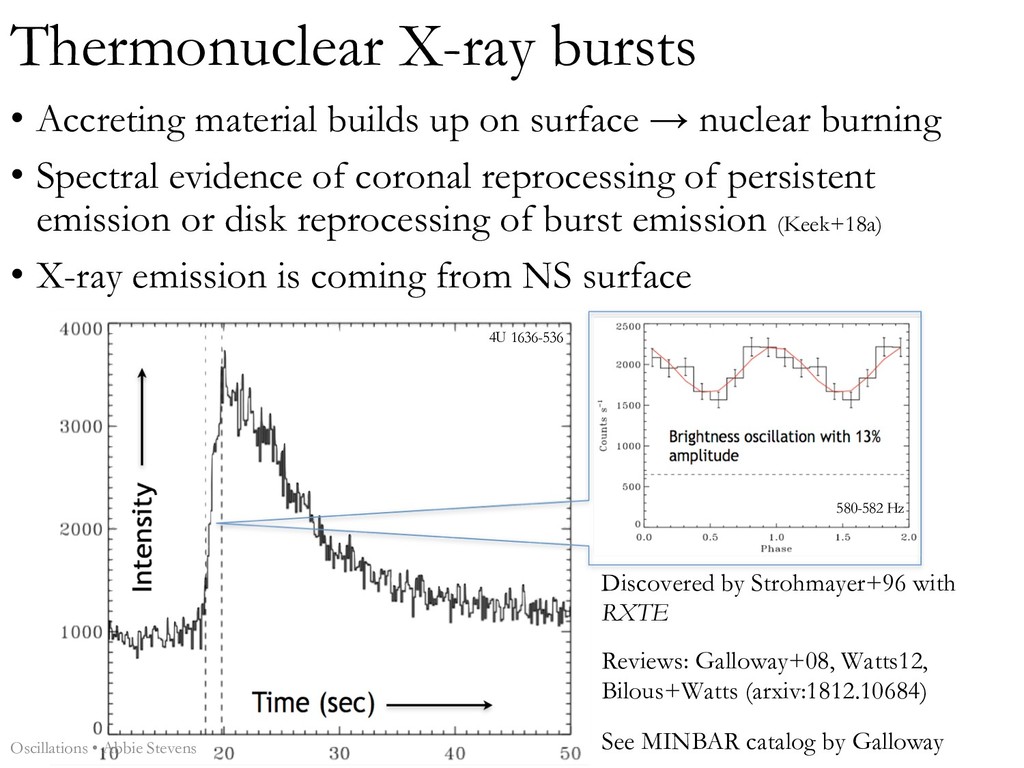
• Spectral evidence of coronal reprocessing of persistent emission or disk reprocessing of burst emission (Keek+18a) • X-ray emission is coming from NS surface Thermonuclear X-ray bursts 4U 1636-536 580-582 Hz Discovered by Strohmayer+96 with RXTE Reviews: Galloway+08, Watts12, Bilous+Watts (arxiv:1812.10684) See MINBAR catalog by Galloway Oscillations • Abbie Stevens
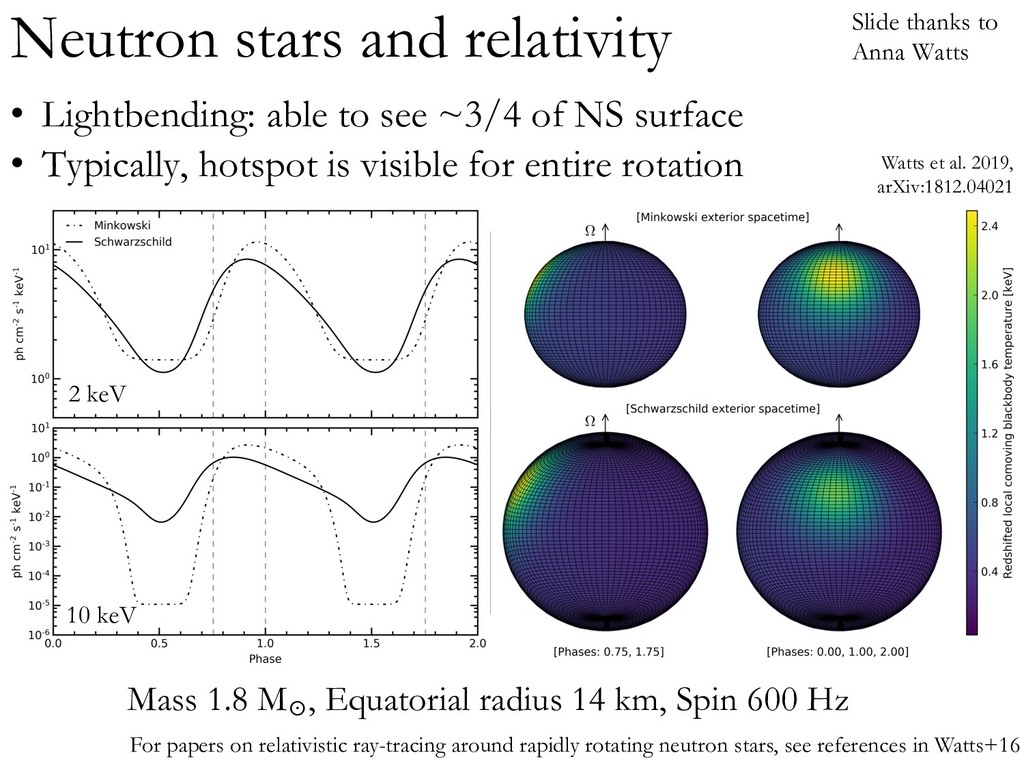
14 km, Spin 600 Hz For papers on relativistic ray-tracing around rapidly rotating neutron stars, see references in Watts+16 Watts et al. 2019, arXiv:1812.04021 Slide thanks to Anna Watts • Lightbending: able to see ~3/4 of NS surface • Typically, hotspot is visible for entire rotation 10 keV 2 keV
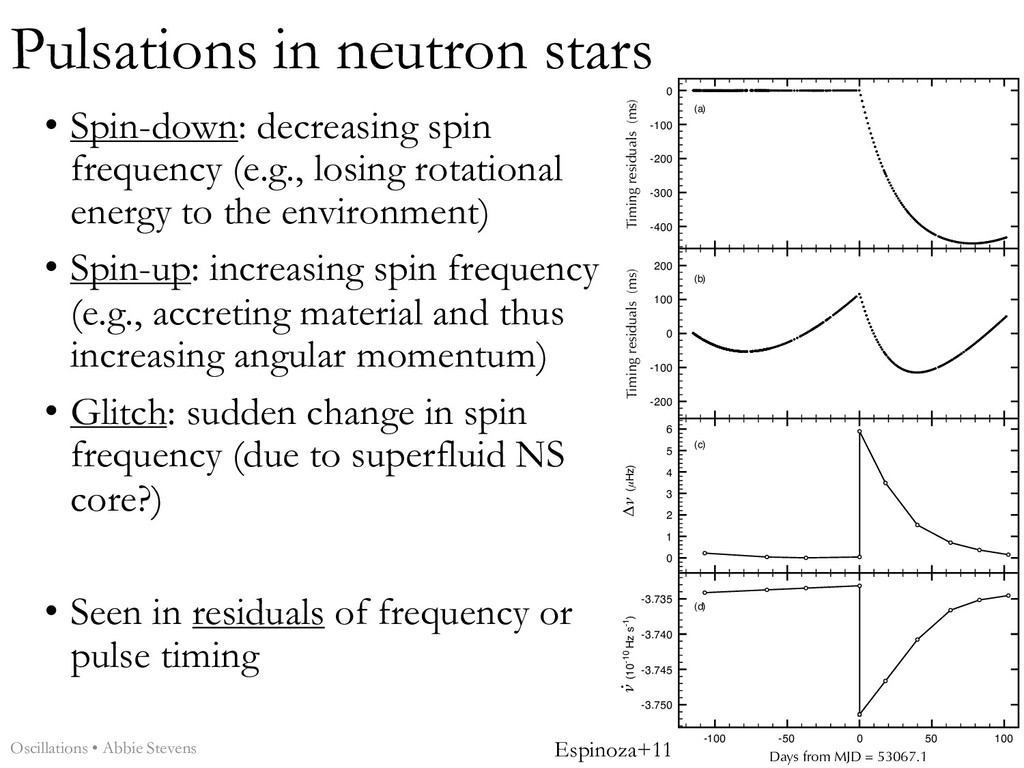
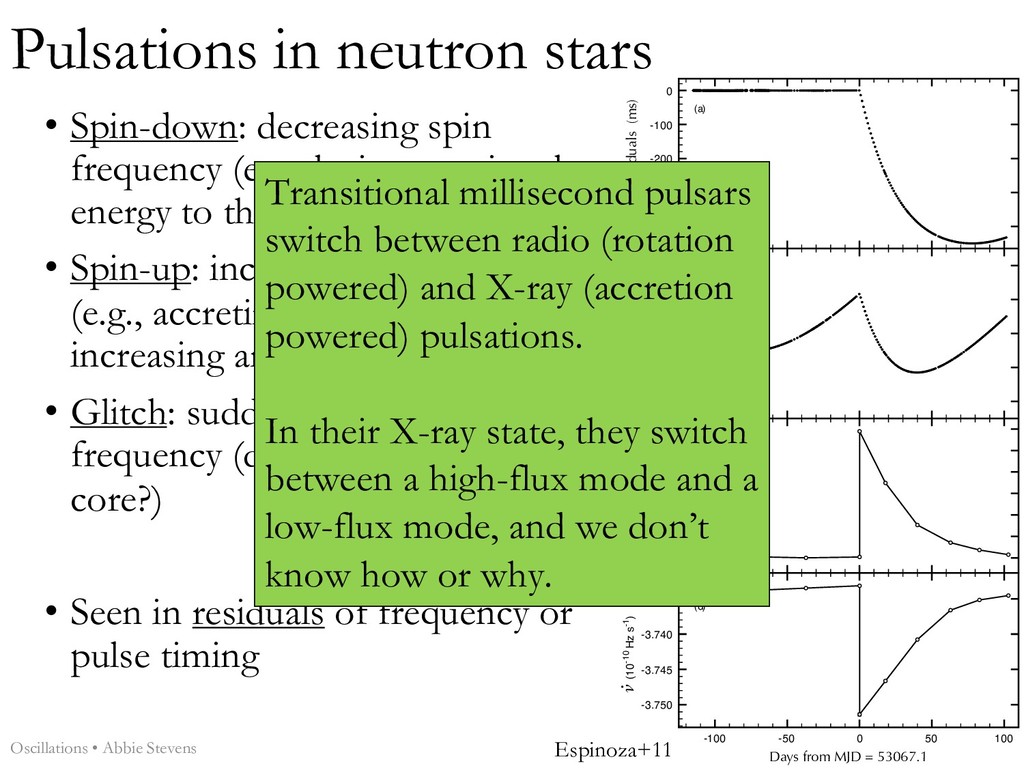
losing rotational energy to the environment) • Spin-up: increasing spin frequency (e.g., accreting material and thus increasing angular momentum) • Glitch: sudden change in spin frequency (due to superfluid NS core?) • Seen in residuals of frequency or pulse timing Oscillations • Abbie Stevens -400 -300 -200 -100 0 Timing residuals (ms) (a) -100 -50 0 50 100 Days from MJD = 53067.1 -3.750 -3.745 -3.740 -3.735 ν (10-10 Hz s-1) • (d) -100 -50 0 50 100 0 1 2 3 4 5 6 Δν (μHz) (c) -100 -50 0 50 100 -200 -100 0 100 200 Timing residuals (ms) (b) Espinoza+11 Transitional millisecond pulsars switch between radio (rotation powered) and X-ray (accretion powered) pulsations. In their X-ray state, they switch between a high-flux mode and a low-flux mode, and we don’t know how or why.
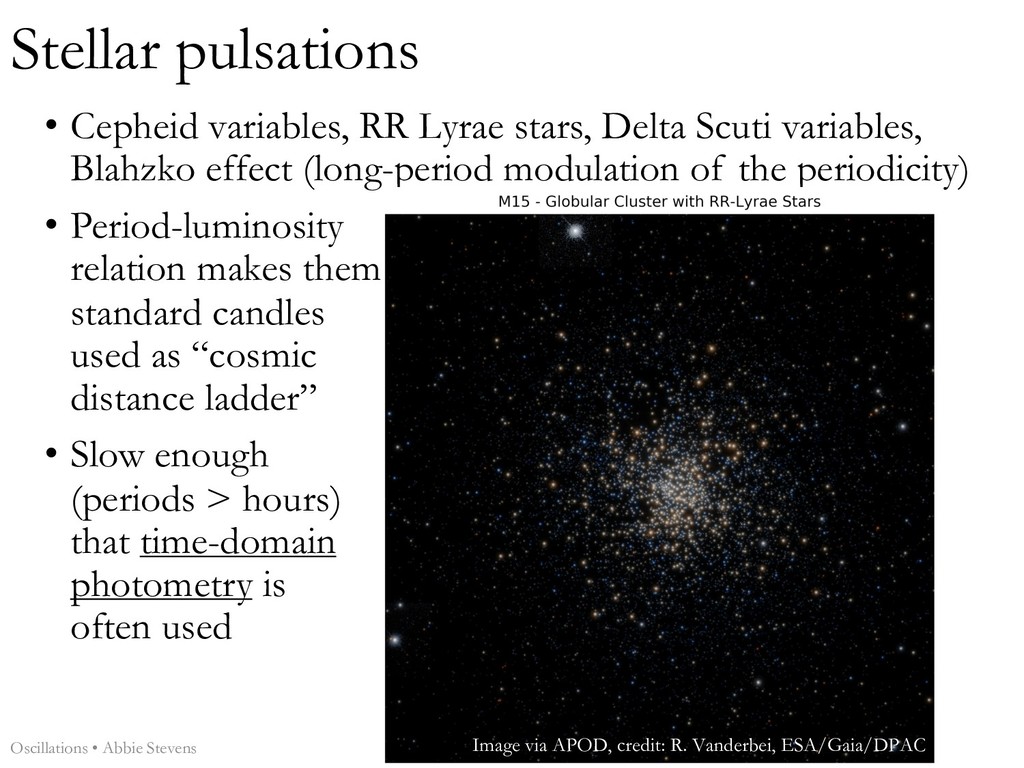
variables, Blahzko effect (long-period modulation of the periodicity) • Period-luminosity relation makes them standard candles used as “cosmic distance ladder” • Slow enough (periods > hours) that time-domain photometry is often used Oscillations • Abbie Stevens Image via APOD, credit: R. Vanderbei, ESA/Gaia/DPAC
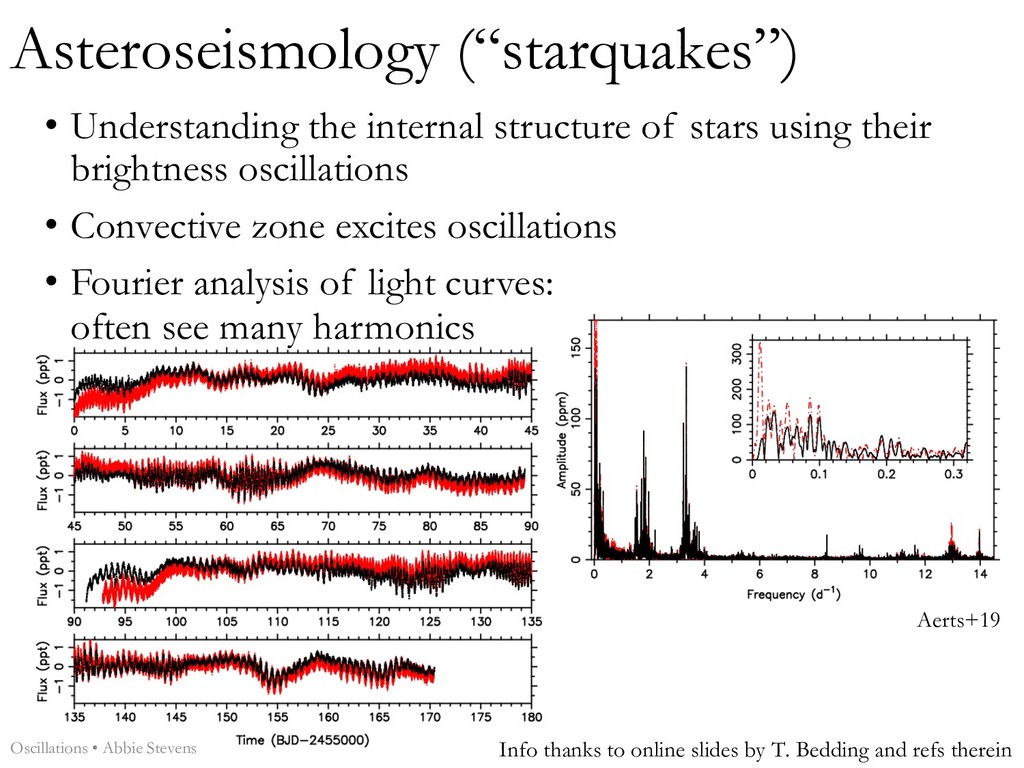
their brightness oscillations • Convective zone excites oscillations • Fourier analysis of light curves: often see many harmonics Oscillations • Abbie Stevens Info thanks to online slides by T. Bedding and refs therein Aerts+19
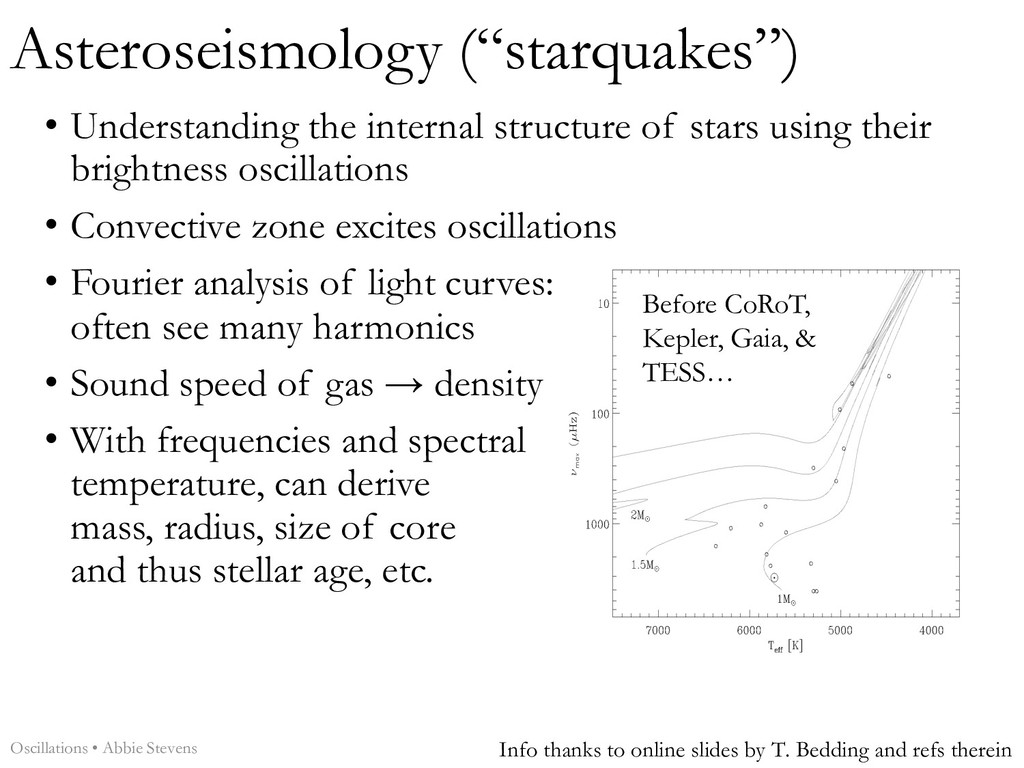
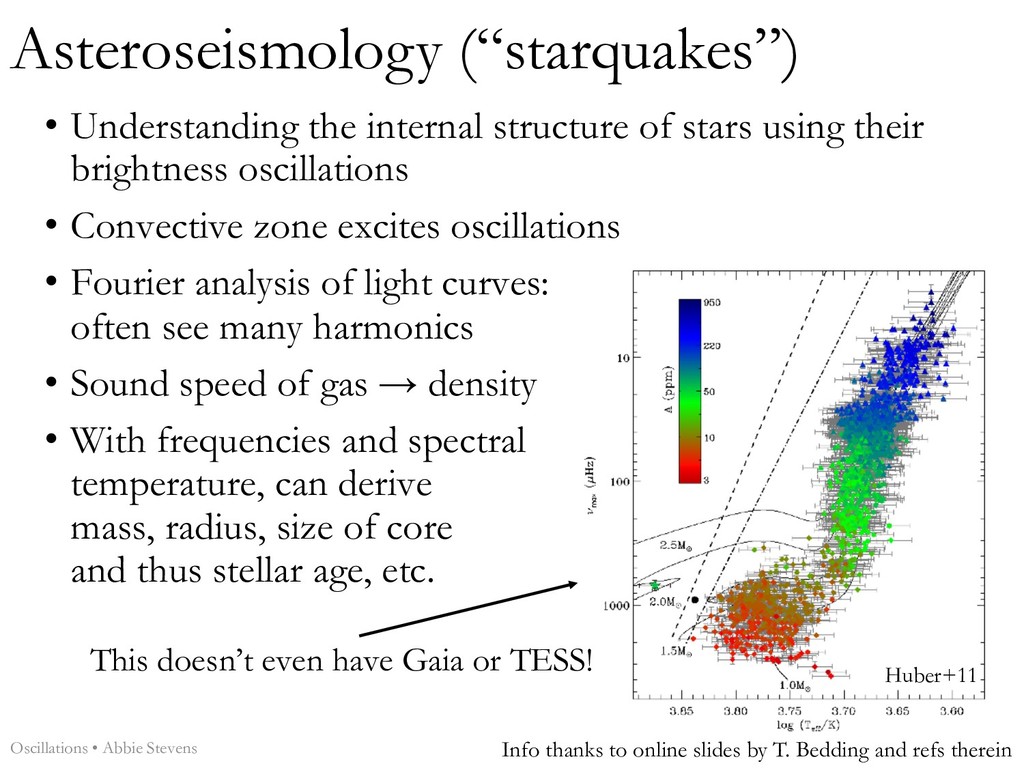
their brightness oscillations • Convective zone excites oscillations • Fourier analysis of light curves: often see many harmonics • Sound speed of gas → density • With frequencies and spectral temperature, can derive mass, radius, size of core and thus stellar age, etc. Oscillations • Abbie Stevens Info thanks to online slides by T. Bedding and refs therein figure by Daniel Huber a few years ago Before CoRoT, Kepler, Gaia, & TESS…
their brightness oscillations • Convective zone excites oscillations • Fourier analysis of light curves: often see many harmonics • Sound speed of gas → density • With frequencies and spectral temperature, can derive mass, radius, size of core and thus stellar age, etc. Oscillations • Abbie Stevens Info thanks to online slides by T. Bedding and refs therein figure by Daniel Huber a few years ago Before CoRoT, Kepler, Gaia, & TESS… Huber+11 This doesn’t even have Gaia or TESS!
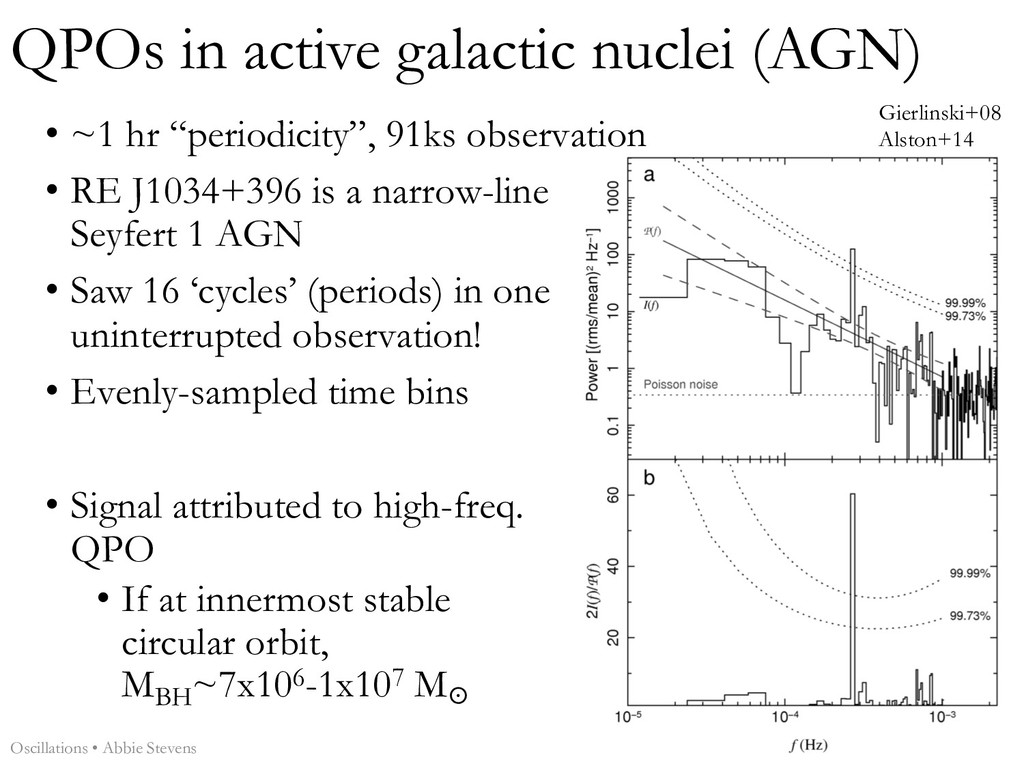
Gierlinski+08 Alston+14 • ~1 hr “periodicity”, 91ks observation • RE J1034+396 is a narrow-line Seyfert 1 AGN • Saw 16 ‘cycles’ (periods) in one uninterrupted observation! • Evenly-sampled time bins • Signal attributed to high-freq. QPO • If at innermost stable circular orbit, MBH ~7x10⁶-1x10⁷ M☉
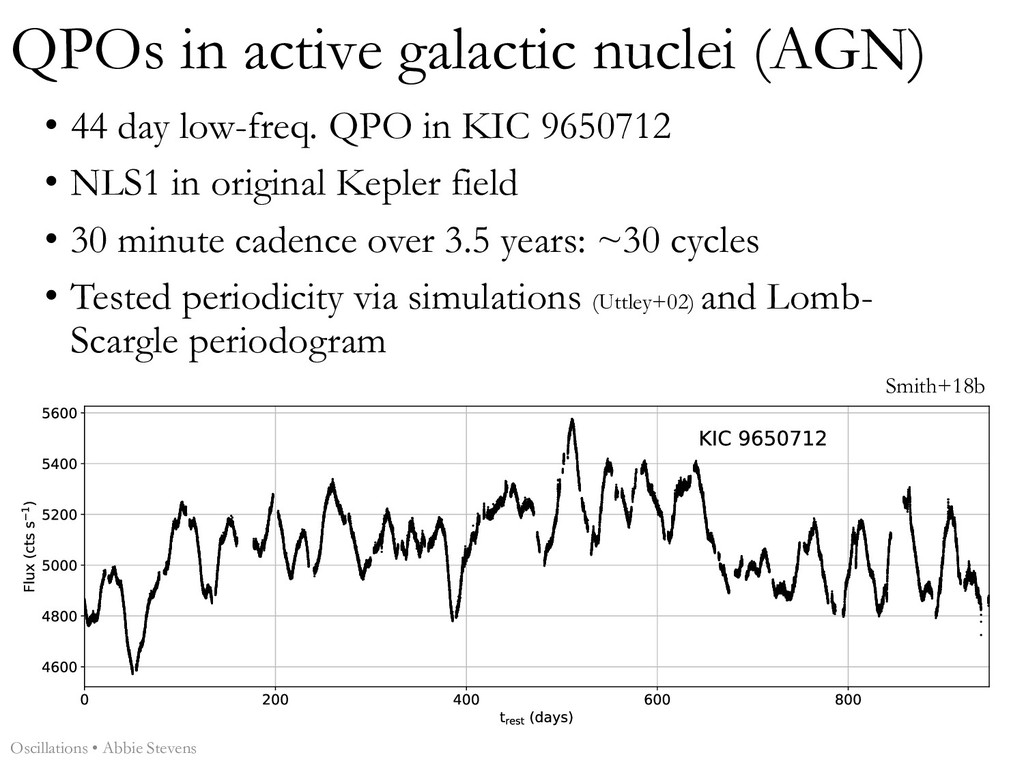
in original Kepler field • 30 minute cadence over 3.5 years: ~30 cycles • Tested periodicity via simulations (Uttley+02) and Lomb- Scargle periodogram Oscillations • Abbie Stevens Smith+18b QPOs in active galactic nuclei (AGN)
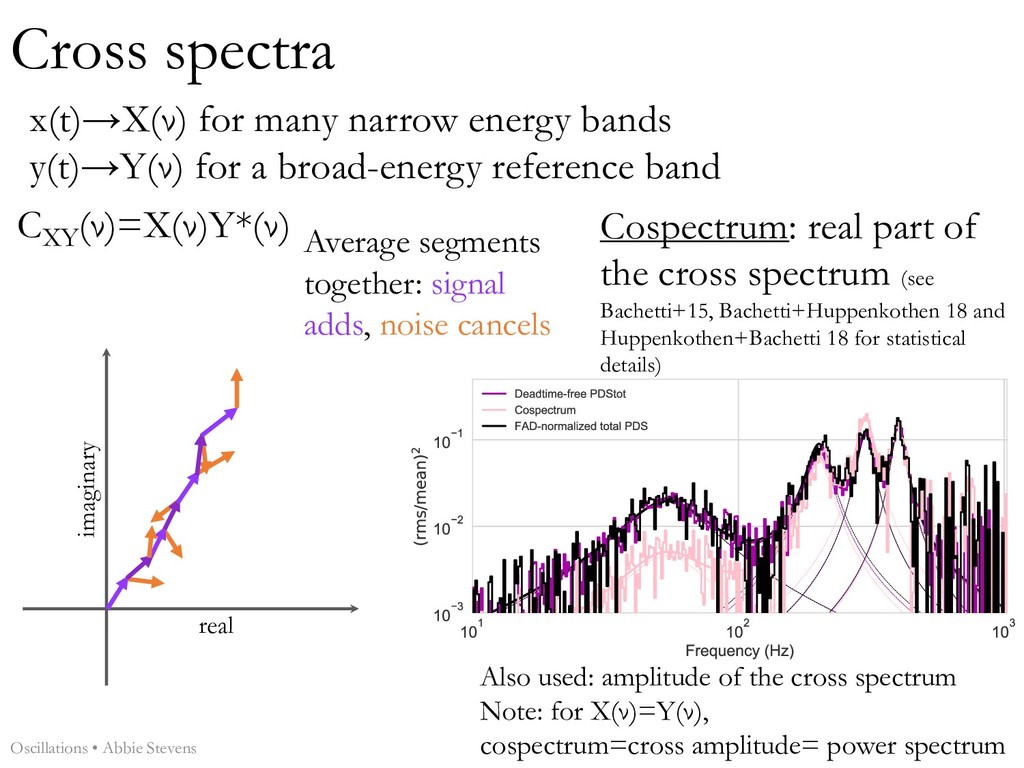
a broad-energy reference band real imaginary Average segments together: signal adds, noise cancels CXY (ν)=X(ν)Y*(ν) Cospectrum: real part of the cross spectrum (see Bachetti+15, Bachetti+Huppenkothen 18 and Huppenkothen+Bachetti 18 for statistical details) Also used: amplitude of the cross spectrum Note: for X(ν)=Y(ν), cospectrum=cross amplitude= power spectrum Oscillations • Abbie Stevens
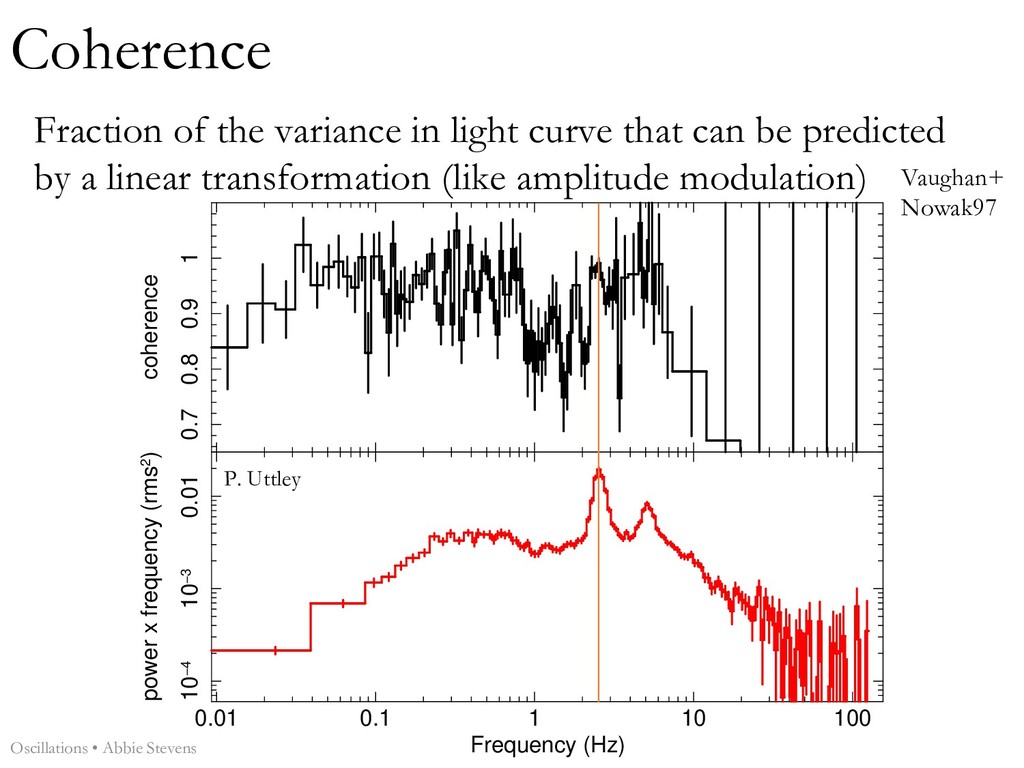
100 10−4 10−3 0.01 power x frequency (rms2) Frequency (Hz) Fraction of the variance in light curve that can be predicted by a linear transformation (like amplitude modulation) P. Uttley Oscillations • Abbie Stevens Vaughan+ Nowak97
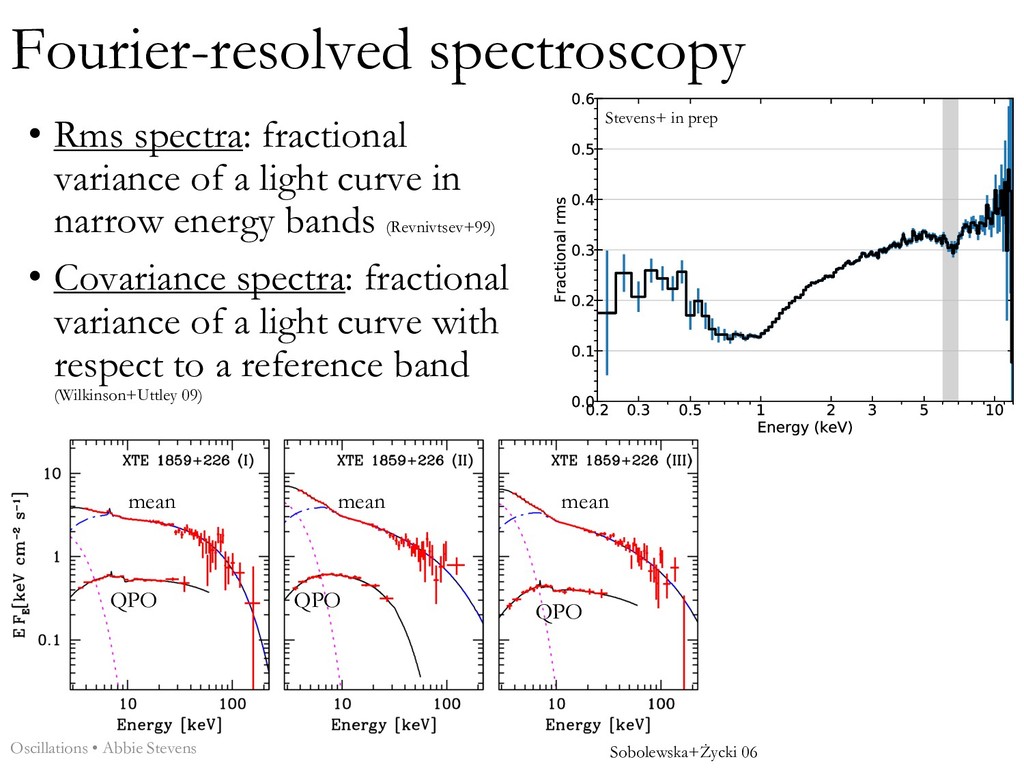
curve in narrow energy bands (Revnivtsev+99) • Covariance spectra: fractional variance of a light curve with respect to a reference band (Wilkinson+Uttley 09) Stevens+ in prep mean QPO mean mean QPO QPO Sobolewska+Życki 06 Oscillations • Abbie Stevens
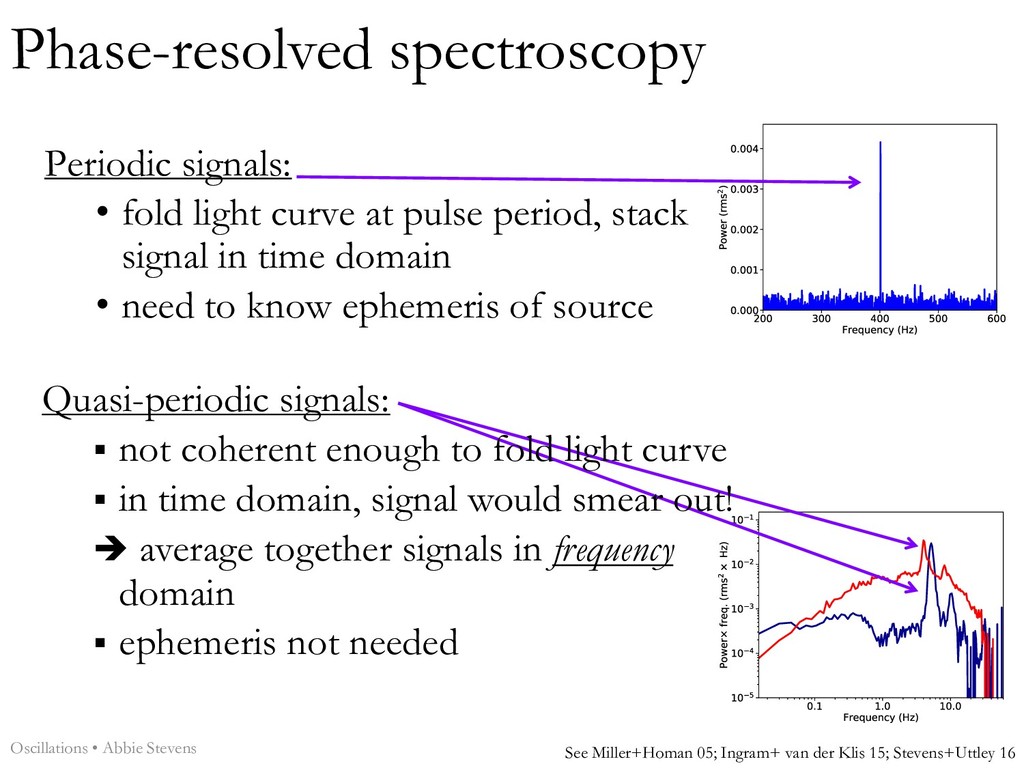
period, stack signal in time domain • need to know ephemeris of source See Miller+Homan 05; Ingram+ van der Klis 15; Stevens+Uttley 16 Oscillations • Abbie Stevens Quasi-periodic signals: § not coherent enough to fold light curve § in time domain, signal would smear out! è average together signals in frequency domain § ephemeris not needed
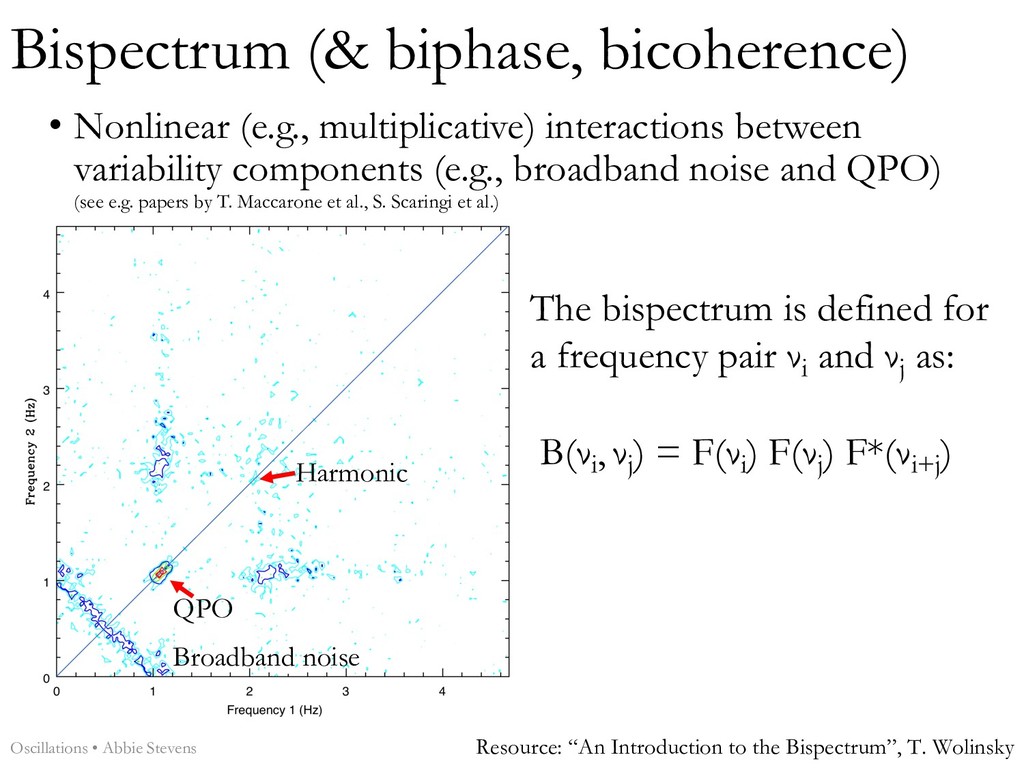
variability components (e.g., broadband noise and QPO) (see e.g. papers by T. Maccarone et al., S. Scaringi et al.) QPO Harmonic Broadband noise Oscillations • Abbie Stevens Resource: “An Introduction to the Bispectrum”, T. Wolinsky The bispectrum is defined for a frequency pair νi and νj as: B(νi , νj ) = F(νi ) F(νj ) F*(νi+j )
package • Stingray: Python library of analysis tools • HENDRICS: shell scripting interface • DAVE: graphical user interface • Tutorials in Jupyter(/iPython) notebooks • github.com/StingraySoftware • Leads: D. Huppenkothen, M. Bachetti, A.L. Stevens, S. Migliari, P. Balm • Google Summer of Code students: S. Sharma (‘18); O. Hammad and H. Rashid (‘17); U. Khan, H. Mishra, and D. Sodhi (‘16) • Other major contributors: E. Martinez Ribeiro, R. Valles Signals in time series • Abbie Stevens → Now published: Huppenkothen et al. 2019, ApJ, in press!
• Power spectra, cross spectra, bispectra • Lag-frequency & lag-energy spectra • Rms & covariance spectra • Coherence, cross-correlation • Handles GTIs, pulsar & QPO searches • Phase-resolved spectroscopy of QPOs • Simulator, modeling • Well-tested on X-ray timing data (RXTE, NuSTAR, XMM, some NICER); also used by a few people for radio timing Signals in time series • Abbie Stevens