Southeast Asia Region Samuel Mamauag1, Adrian Chester Balingit1, Laurence Robles1, and Reniel Cabral2 1Marine Environment and Resources Foundation, Inc., Marine Science Institute, University of the Philippines - Diliman 2University of California-Santa Barbara, CA, USA SIMSEA Workshop - 19 November 2014 Microtel, UP Technohub
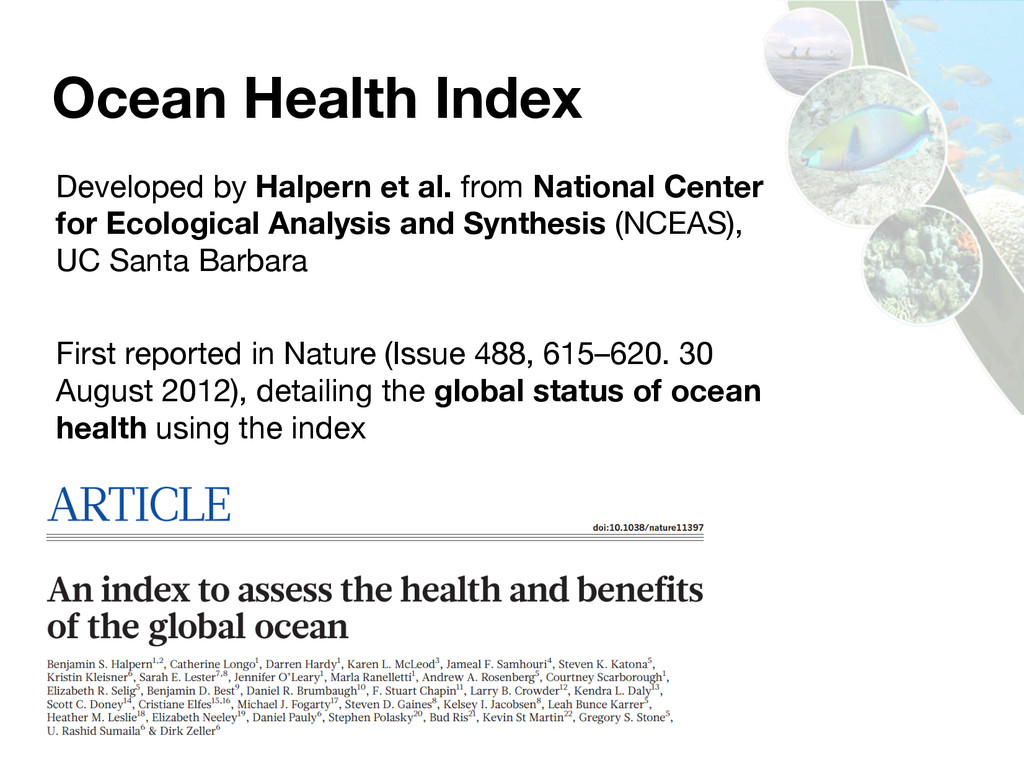
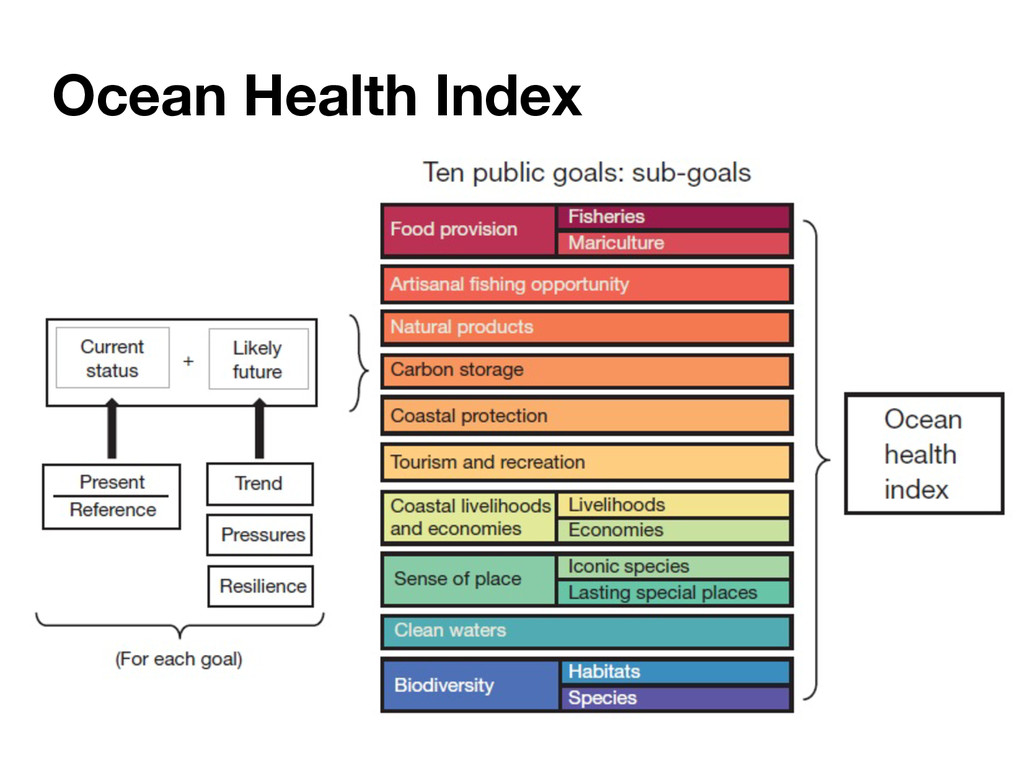
Analysis and Synthesis (NCEAS), UC Santa Barbara First reported in Nature (Issue 488, 615–620. 30 August 2012), detailing the global status of ocean health using the index Ocean Health Index
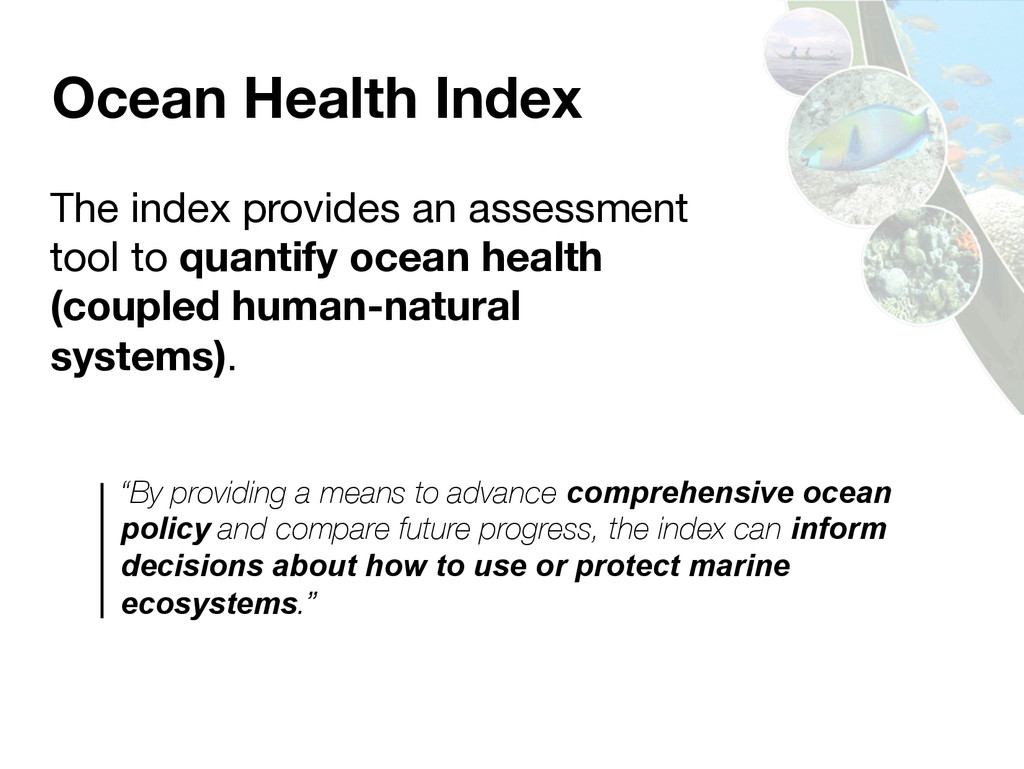
ocean policy and compare future progress, the index can inform decisions about how to use or protect marine ecosystems.” The index provides an assessment tool to quantify ocean health (coupled human-natural systems).
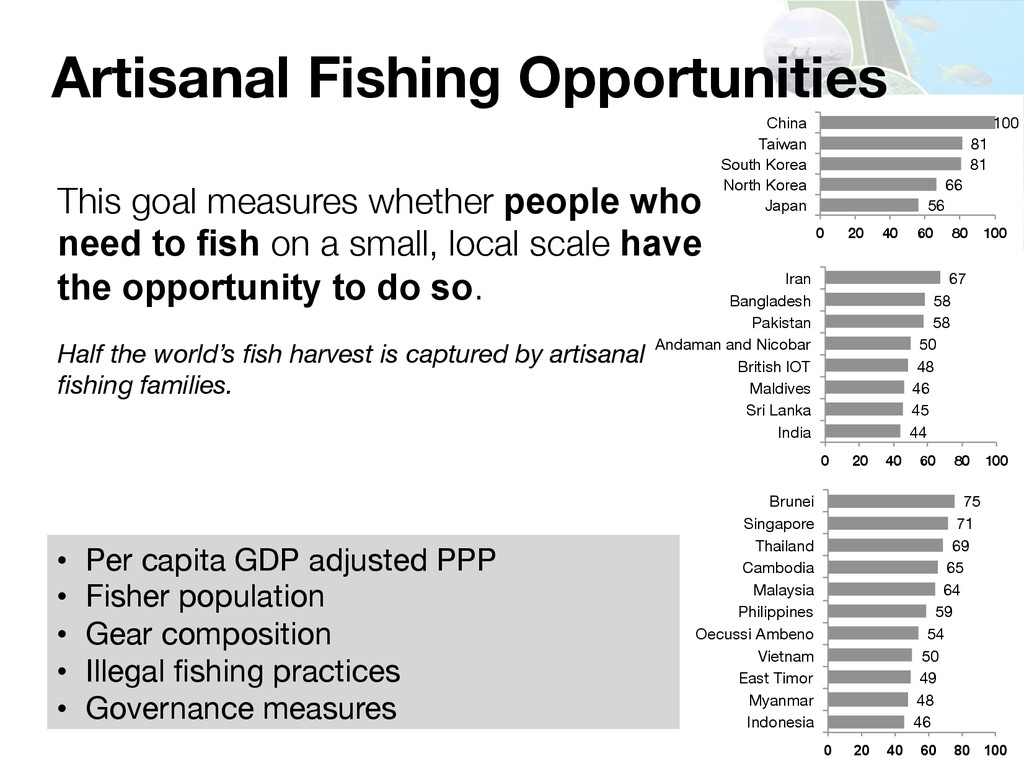
100 Japan North Korea South Korea Taiwan China 44 45 46 48 50 58 58 67 0 20 40 60 80 100 India Sri Lanka Maldives British IOT Andaman and Nicobar Pakistan Bangladesh Iran Artisanal Fishing Opportunities • Per capita GDP adjusted PPP • Fisher population • Gear composition • Illegal fishing practices • Governance measures This goal measures whether people who need to fish on a small, local scale have the opportunity to do so. Half the world’s fish harvest is captured by artisanal fishing families. 46 48 49 50 54 59 64 65 69 71 75 0 20 40 60 80 100 Indonesia Myanmar East Timor Vietnam Oecussi Ambeno Philippines Malaysia Cambodia Thailand Singapore Brunei
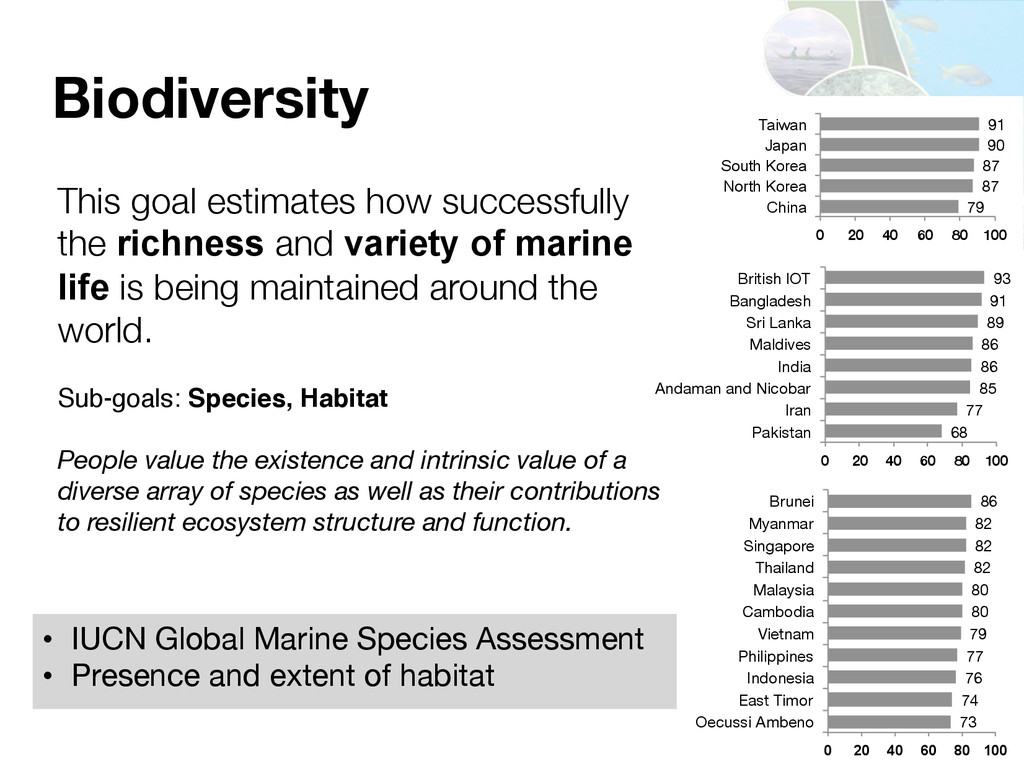
40 60 80 100 Pakistan Iran Andaman and Nicobar India Maldives Sri Lanka Bangladesh British IOT Biodiversity This goal estimates how successfully the richness and variety of marine life is being maintained around the world. Sub-goals: Species, Habitat People value the existence and intrinsic value of a diverse array of species as well as their contributions to resilient ecosystem structure and function. • IUCN Global Marine Species Assessment • Presence and extent of habitat 73 74 76 77 79 80 80 82 82 82 86 0 20 40 60 80 100 Oecussi Ambeno East Timor Indonesia Philippines Vietnam Cambodia Malaysia Thailand Singapore Myanmar Brunei 79 87 87 90 91 0 20 40 60 80 100 China North Korea South Korea Japan Taiwan
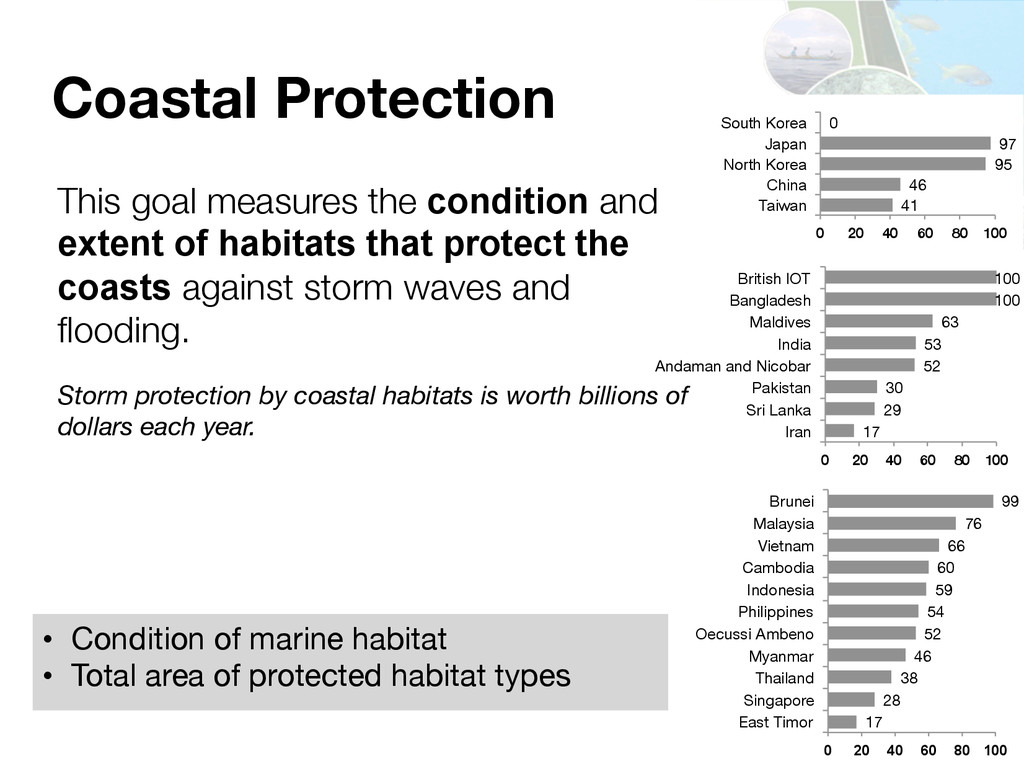
40 60 80 100 Iran Sri Lanka Pakistan Andaman and Nicobar India Maldives Bangladesh British IOT Coastal Protection This goal measures the condition and extent of habitats that protect the coasts against storm waves and flooding. Storm protection by coastal habitats is worth billions of dollars each year. • Condition of marine habitat • Total area of protected habitat types 17 28 38 46 52 54 59 60 66 76 99 0 20 40 60 80 100 East Timor Singapore Thailand Myanmar Oecussi Ambeno Philippines Indonesia Cambodia Vietnam Malaysia Brunei 41 46 95 97 0 0 20 40 60 80 100 Taiwan China North Korea Japan South Korea
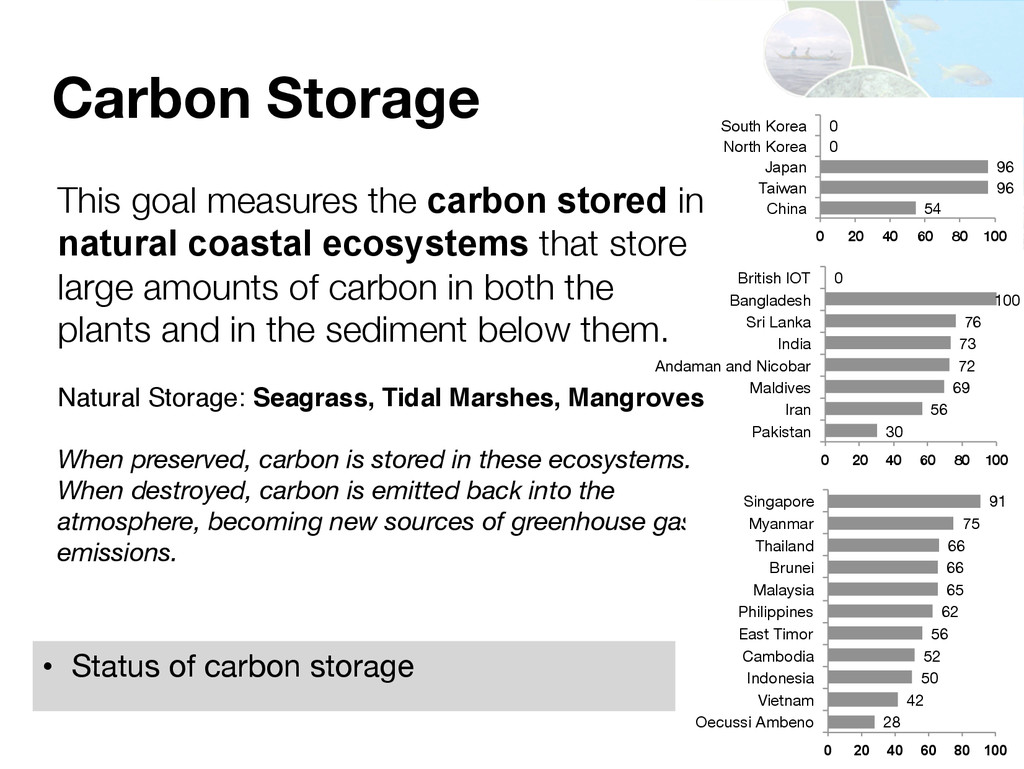
40 60 80 100 Pakistan Iran Maldives Andaman and Nicobar India Sri Lanka Bangladesh British IOT Carbon Storage This goal measures the carbon stored in natural coastal ecosystems that store large amounts of carbon in both the plants and in the sediment below them. Natural Storage: Seagrass, Tidal Marshes, Mangroves When preserved, carbon is stored in these ecosystems. When destroyed, carbon is emitted back into the atmosphere, becoming new sources of greenhouse gas emissions. • Status of carbon storage 28 42 50 52 56 62 65 66 66 75 91 0 20 40 60 80 100 Oecussi Ambeno Vietnam Indonesia Cambodia East Timor Philippines Malaysia Brunei Thailand Myanmar Singapore 54 96 96 0 0 0 20 40 60 80 100 China Taiwan Japan North Korea South Korea
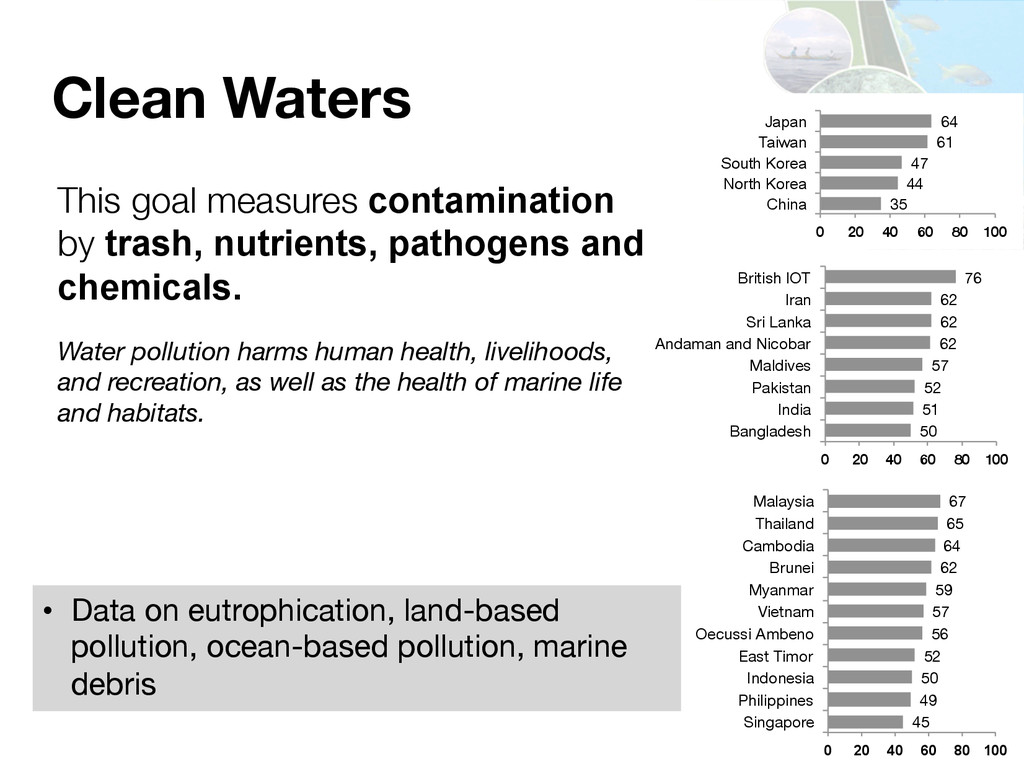
40 60 80 100 Bangladesh India Pakistan Maldives Andaman and Nicobar Sri Lanka Iran British IOT Clean Waters This goal measures contamination by trash, nutrients, pathogens and chemicals. Water pollution harms human health, livelihoods, and recreation, as well as the health of marine life and habitats. • Data on eutrophication, land-based pollution, ocean-based pollution, marine debris 45 49 50 52 56 57 59 62 64 65 67 0 20 40 60 80 100 Singapore Philippines Indonesia East Timor Oecussi Ambeno Vietnam Myanmar Brunei Cambodia Thailand Malaysia 35 44 47 61 64 0 20 40 60 80 100 China North Korea South Korea Taiwan Japan
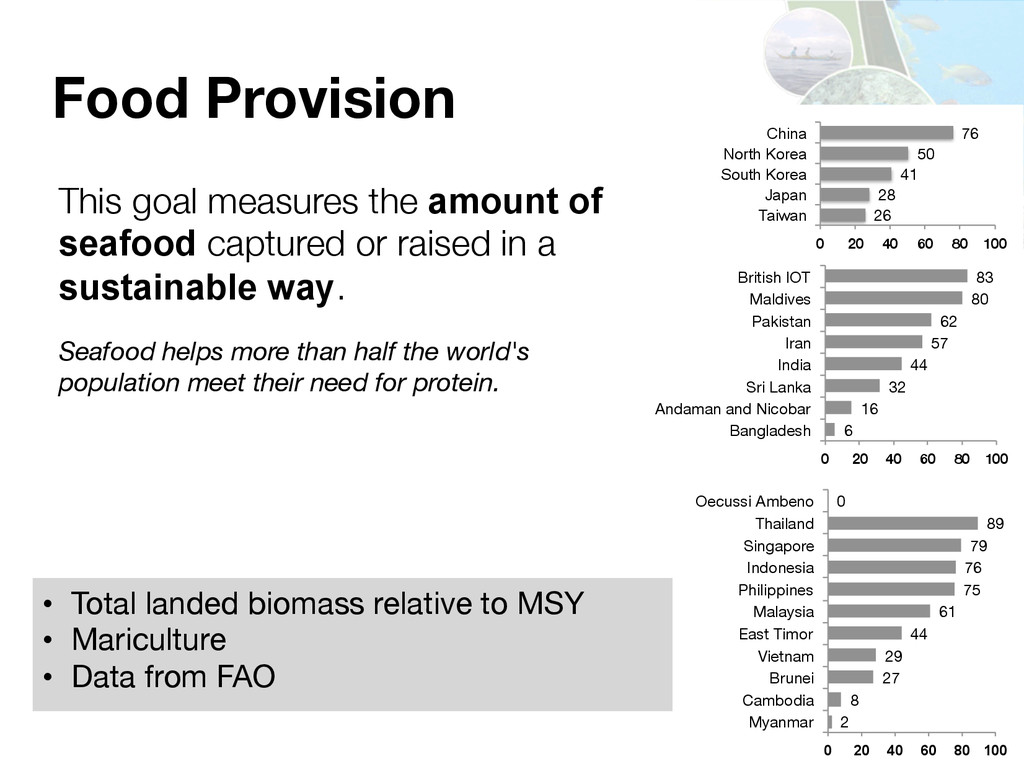
40 60 80 100 Bangladesh Andaman and Nicobar Sri Lanka India Iran Pakistan Maldives British IOT Food Provision This goal measures the amount of seafood captured or raised in a sustainable way. Seafood helps more than half the world's population meet their need for protein. • Total landed biomass relative to MSY • Mariculture • Data from FAO 2 8 27 29 44 61 75 76 79 89 0 0 20 40 60 80 100 Myanmar Cambodia Brunei Vietnam East Timor Malaysia Philippines Indonesia Singapore Thailand Oecussi Ambeno 26 28 41 50 76 0 20 40 60 80 100 Taiwan Japan South Korea North Korea China
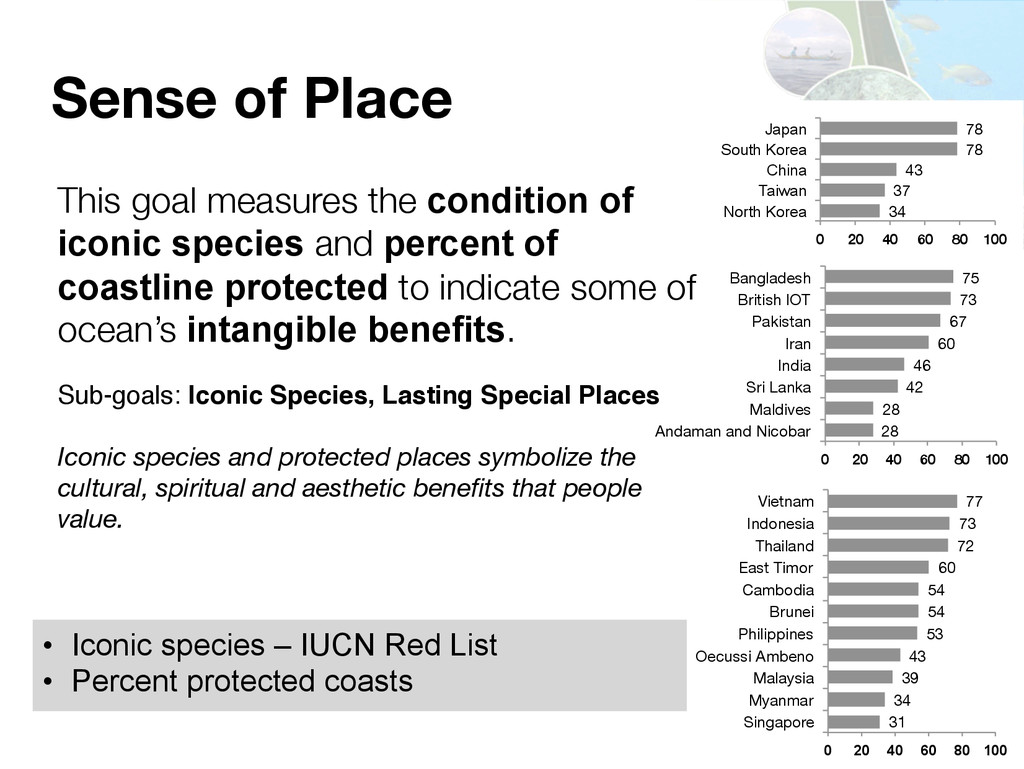
77 0 20 40 60 80 100 Singapore Myanmar Malaysia Oecussi Ambeno Philippines Brunei Cambodia East Timor Thailand Indonesia Vietnam 28 28 42 46 60 67 73 75 0 20 40 60 80 100 Andaman and Nicobar Maldives Sri Lanka India Iran Pakistan British IOT Bangladesh Sense of Place This goal measures the condition of iconic species and percent of coastline protected to indicate some of ocean’s intangible benefits. Sub-goals: Iconic Species, Lasting Special Places Iconic species and protected places symbolize the cultural, spiritual and aesthetic benefits that people value. • Iconic species – IUCN Red List • Percent protected coasts 34 37 43 78 78 0 20 40 60 80 100 North Korea Taiwan China South Korea Japan
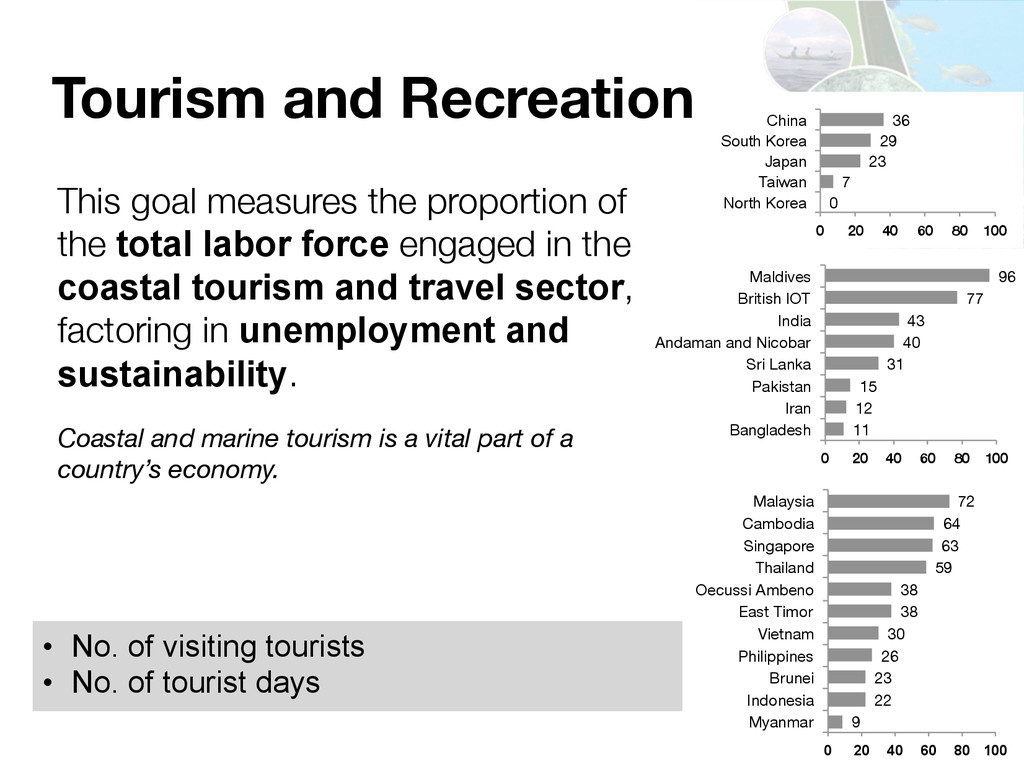
40 60 80 100 Bangladesh Iran Pakistan Sri Lanka Andaman and Nicobar India British IOT Maldives Tourism and Recreation This goal measures the proportion of the total labor force engaged in the coastal tourism and travel sector, factoring in unemployment and sustainability. Coastal and marine tourism is a vital part of a country’s economy. • No. of visiting tourists • No. of tourist days 9 22 23 26 30 38 38 59 63 64 72 0 20 40 60 80 100 Myanmar Indonesia Brunei Philippines Vietnam East Timor Oecussi Ambeno Thailand Singapore Cambodia Malaysia 0 7 23 29 36 0 20 40 60 80 100 North Korea Taiwan Japan South Korea China
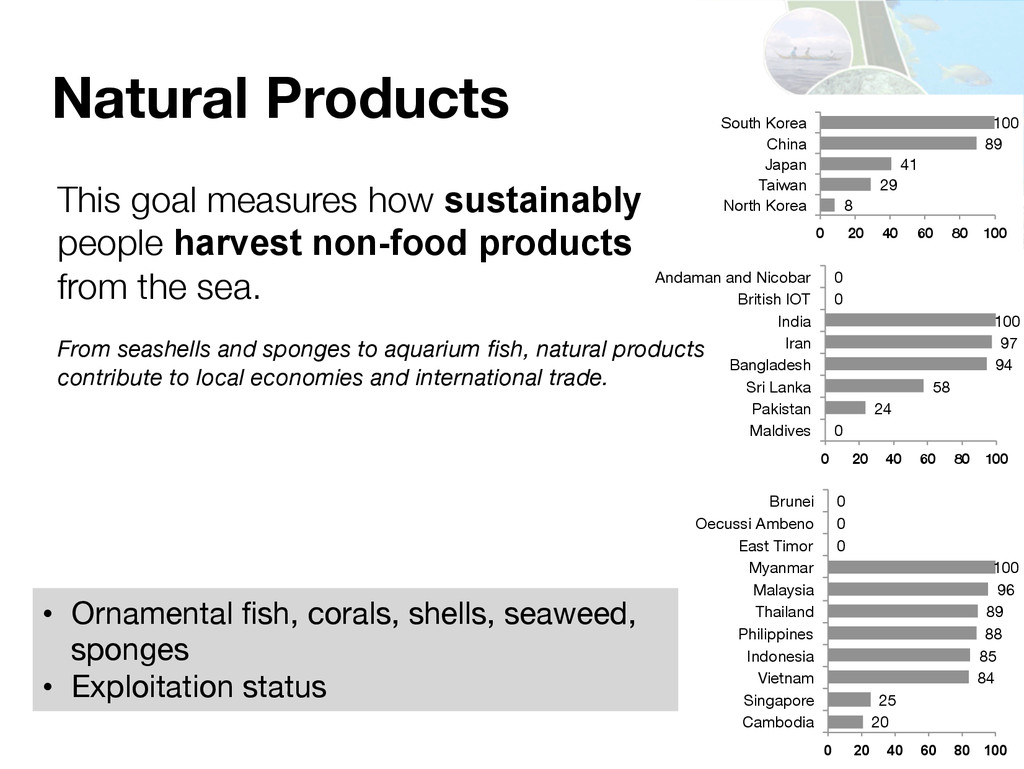
40 60 80 100 Maldives Pakistan Sri Lanka Bangladesh Iran India British IOT Andaman and Nicobar Natural Products This goal measures how sustainably people harvest non-food products from the sea. From seashells and sponges to aquarium fish, natural products contribute to local economies and international trade. • Ornamental fish, corals, shells, seaweed, sponges • Exploitation status 20 25 84 85 88 89 96 100 0 0 0 0 20 40 60 80 100 Cambodia Singapore Vietnam Indonesia Philippines Thailand Malaysia Myanmar East Timor Oecussi Ambeno Brunei 8 29 41 89 100 0 20 40 60 80 100 North Korea Taiwan Japan China South Korea
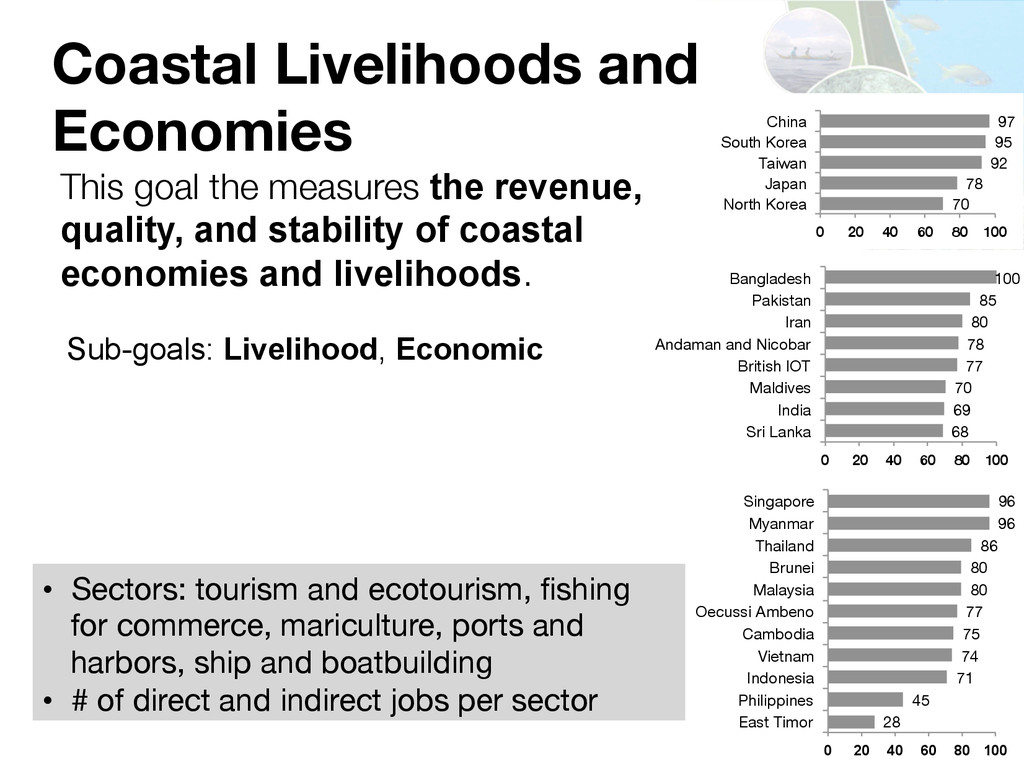
100 North Korea Japan Taiwan South Korea China Coastal Livelihoods and Economies This goal the measures the revenue, quality, and stability of coastal economies and livelihoods. Sub-goals: Livelihood, Economic • Sectors: tourism and ecotourism, fishing for commerce, mariculture, ports and harbors, ship and boatbuilding • # of direct and indirect jobs per sector 68 69 70 77 78 80 85 100 0 20 40 60 80 100 Sri Lanka India Maldives British IOT Andaman and Nicobar Iran Pakistan Bangladesh 28 45 71 74 75 77 80 80 86 96 96 0 20 40 60 80 100 East Timor Philippines Indonesia Vietnam Cambodia Oecussi Ambeno Malaysia Brunei Thailand Myanmar Singapore
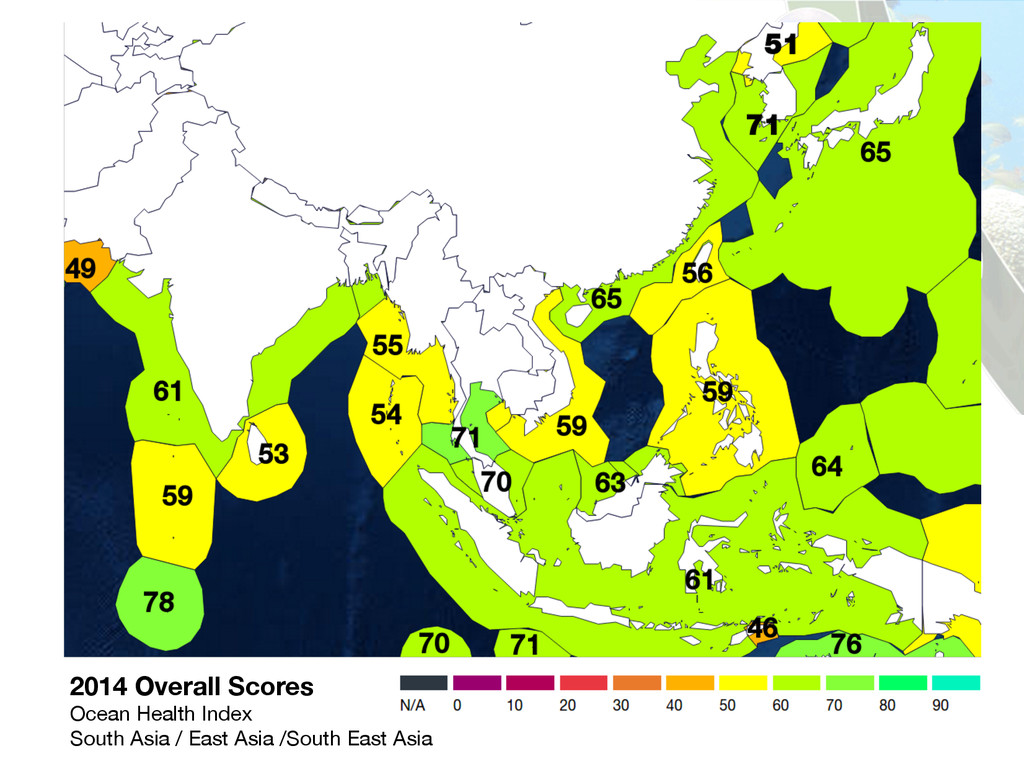
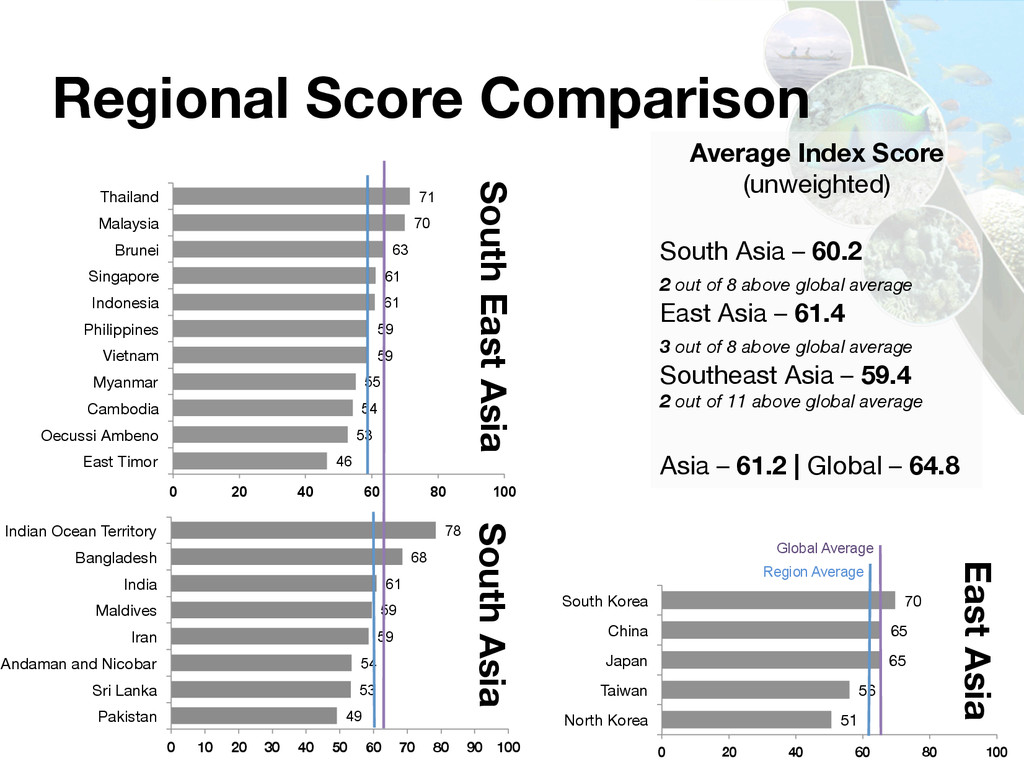
71 0 20 40 60 80 100 East Timor Oecussi Ambeno Cambodia Myanmar Vietnam Philippines Indonesia Singapore Brunei Malaysia Thailand 49 53 54 59 59 61 68 78 0 10 20 30 40 50 60 70 80 90 100 Pakistan Sri Lanka Andaman and Nicobar Iran Maldives India Bangladesh h Indian Ocean Territory South East Asia South Asia Average Index Score (unweighted) South Asia – 60.2 2 out of 8 above global average East Asia – 61.4 3 out of 8 above global average Southeast Asia – 59.4 2 out of 11 above global average Asia – 61.2 | Global – 64.8 Global Average Regional Score Comparison 51 56 65 65 70 0 20 40 60 80 100 North Korea Taiwan Japan China South Korea East Asia Region Average
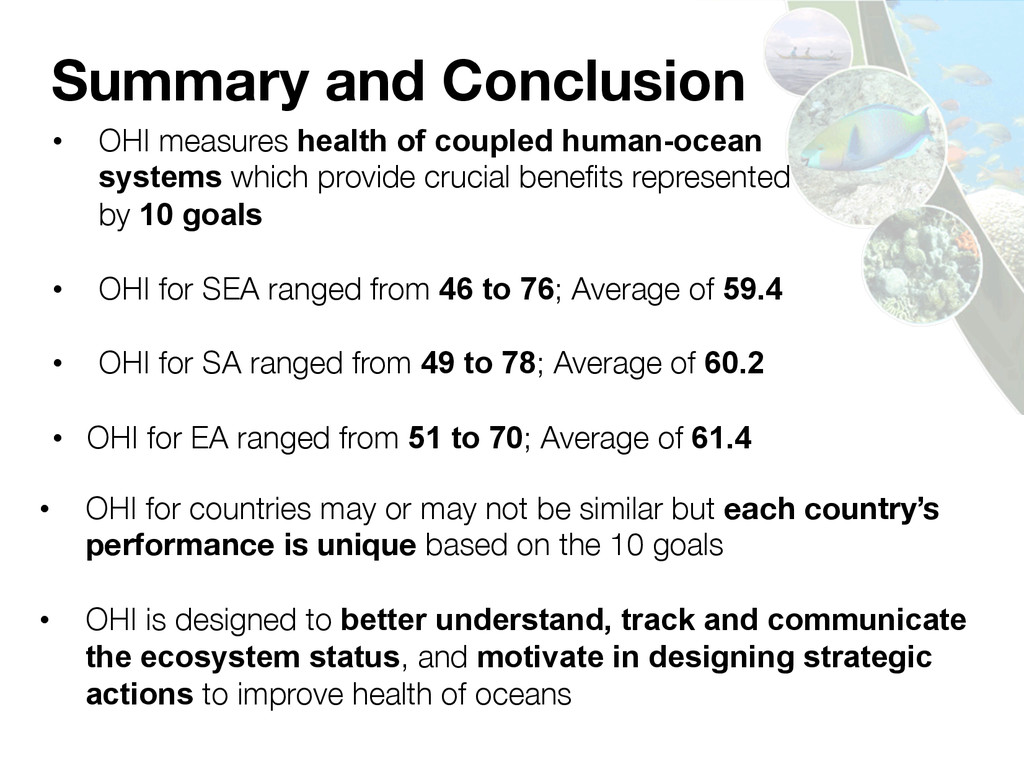
crucial benefits represented by 10 goals • OHI for SEA ranged from 46 to 76; Average of 59.4 • OHI for SA ranged from 49 to 78; Average of 60.2 • OHI for EA ranged from 51 to 70; Average of 61.4 Summary and Conclusion • OHI for countries may or may not be similar but each country’s performance is unique based on the 10 goals • OHI is designed to better understand, track and communicate the ecosystem status, and motivate in designing strategic actions to improve health of oceans
South and Southeast Asia Region Samuel Mamauag1, Adrian Chester Balingit1, Laurence Robles1, and Reniel Cabral2 1Marine Environment and Resources Foundation, Inc., Marine Science Institute, University of the Philippines - Diliman 2University of California-Santa Barbara, CA, USA