Upgrade to Pro
— share decks privately, control downloads, hide ads and more …
Speaker Deck
Features
Speaker Deck
PRO
Sign in
Sign up for free
Search
Search
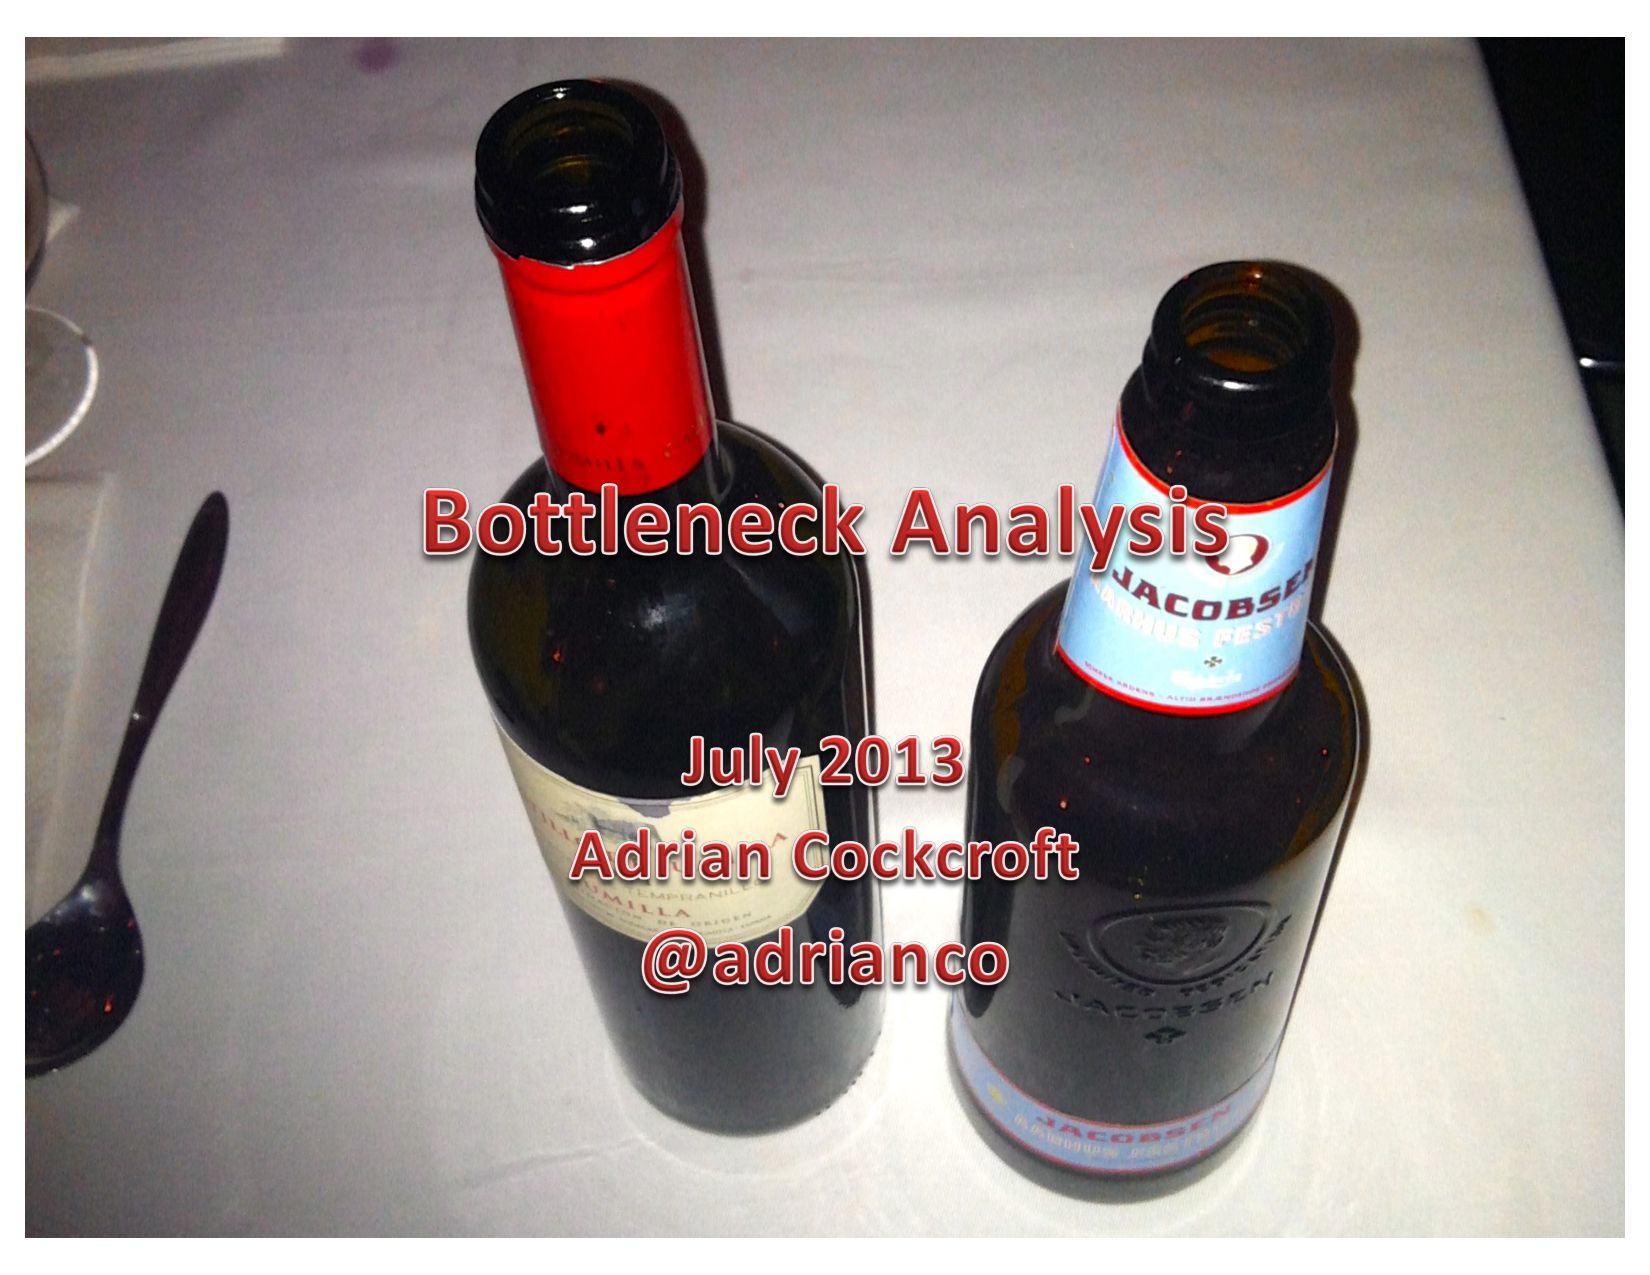
Bottleneck Analysis - GOTO 2012
Search
Adrian Cockcroft
October 03, 2024
Technology
33
0
Share
Embed
Copy iframe code
Copy JS code
Copy link
Start on current slide
Bottleneck Analysis - GOTO 2012
Adrian Cockcroft
October 03, 2024
More Decks by Adrian Cockcroft
See All by Adrian Cockcroft
SC03 Sun Microsystems Keynote
adrianco
0
250
HPC Interconnect Technologies in 2004
adrianco
0
86
Microservices Workshop All Topics Deck 2016
adrianco
0
34k
Cloud Native
adrianco
1
460
Patterns for Continuous Delivery, Reactive, High Availability, DevOps & Cloud Native Open Source with NetflixOSS
adrianco
13
4.1k
Other Decks in Technology
See All in Technology
クラウドを使う側から、作る側へ / 大吉祥寺.pm 2026前夜祭
fujiwara3
4
1.1k
Kaggleで成長するために意識したこと
prgckwb
2
440
AI時代の開発生産性を捉え直す — 経営と現場をつなぐ「開発組織のオブザーバビリティ」— / AI Dev Ex Conference 2026
tkyowa
1
1.3k
インシデント事例と パッケージの全量解析に学ぶ ソフトウェアサプライチェーンの守り方 / supply-chain-attack-defense
flatt_security
0
880
Webアプリ認証の全体像 / The Big Picture of Web App Authentication
kitano_yuichi
1
410
そのドキュメント、自動化しませんか?
yuksew
1
410
AIコード生成×サプライチェーン攻撃 — PHPが直面する“二重の信頼問題
shinyasaita
0
450
ここは地獄!つらい朝会を体験することで、チームとしてのより良い振る舞いに気づくワークショップ / The stand-up meeting from hell in the game industry
scrummasudar
0
210
AI Coding Agent時代のcdk-nagガードレール 〜組織ルールを強制CIで守り抜く設計の挑戦〜
mhrtech
3
500
Alphaモジュール使っていいのかい!?いけないのかい!?どっちなんだいっ!?
watany
1
320
AI時代のPlaywright活用(システムテストを自動化する ー 実行エンジンにPla ywrightを選んだ理由)
ynisqa1988
2
930
AI時代のYAGNI:「爆速で無駄になった機能」からの学び / 20260720 Naoki Takahashi
shift_evolve
PRO
3
520
Featured
See All Featured
Visual Storytelling: How to be a Superhuman Communicator
reverentgeek
2
590
個人開発の失敗を避けるイケてる考え方 / tips for indie hackers
panda_program
123
22k
エンジニアに許された特別な時間の終わり
watany
108
250k
Tips & Tricks on How to Get Your First Job In Tech
honzajavorek
1
620
Sharpening the Axe: The Primacy of Toolmaking
bcantrill
46
2.9k
Practical Tips for Bootstrapping Information Extraction Pipelines
honnibal
25
2k
ReactJS: Keep Simple. Everything can be a component!
pedronauck
666
130k
Sam Torres - BigQuery for SEOs
techseoconnect
PRO
0
440
Visualizing Your Data: Incorporating Mongo into Loggly Infrastructure
mongodb
49
10k
Understanding Cognitive Biases in Performance Measurement
bluesmoon
32
3k
It's Worth the Effort
3n
188
29k
コードの90%をAIが書く世界で何が待っているのか / What awaits us in a world where 90% of the code is written by AI
rkaga
62
45k
Transcript
None
None
None
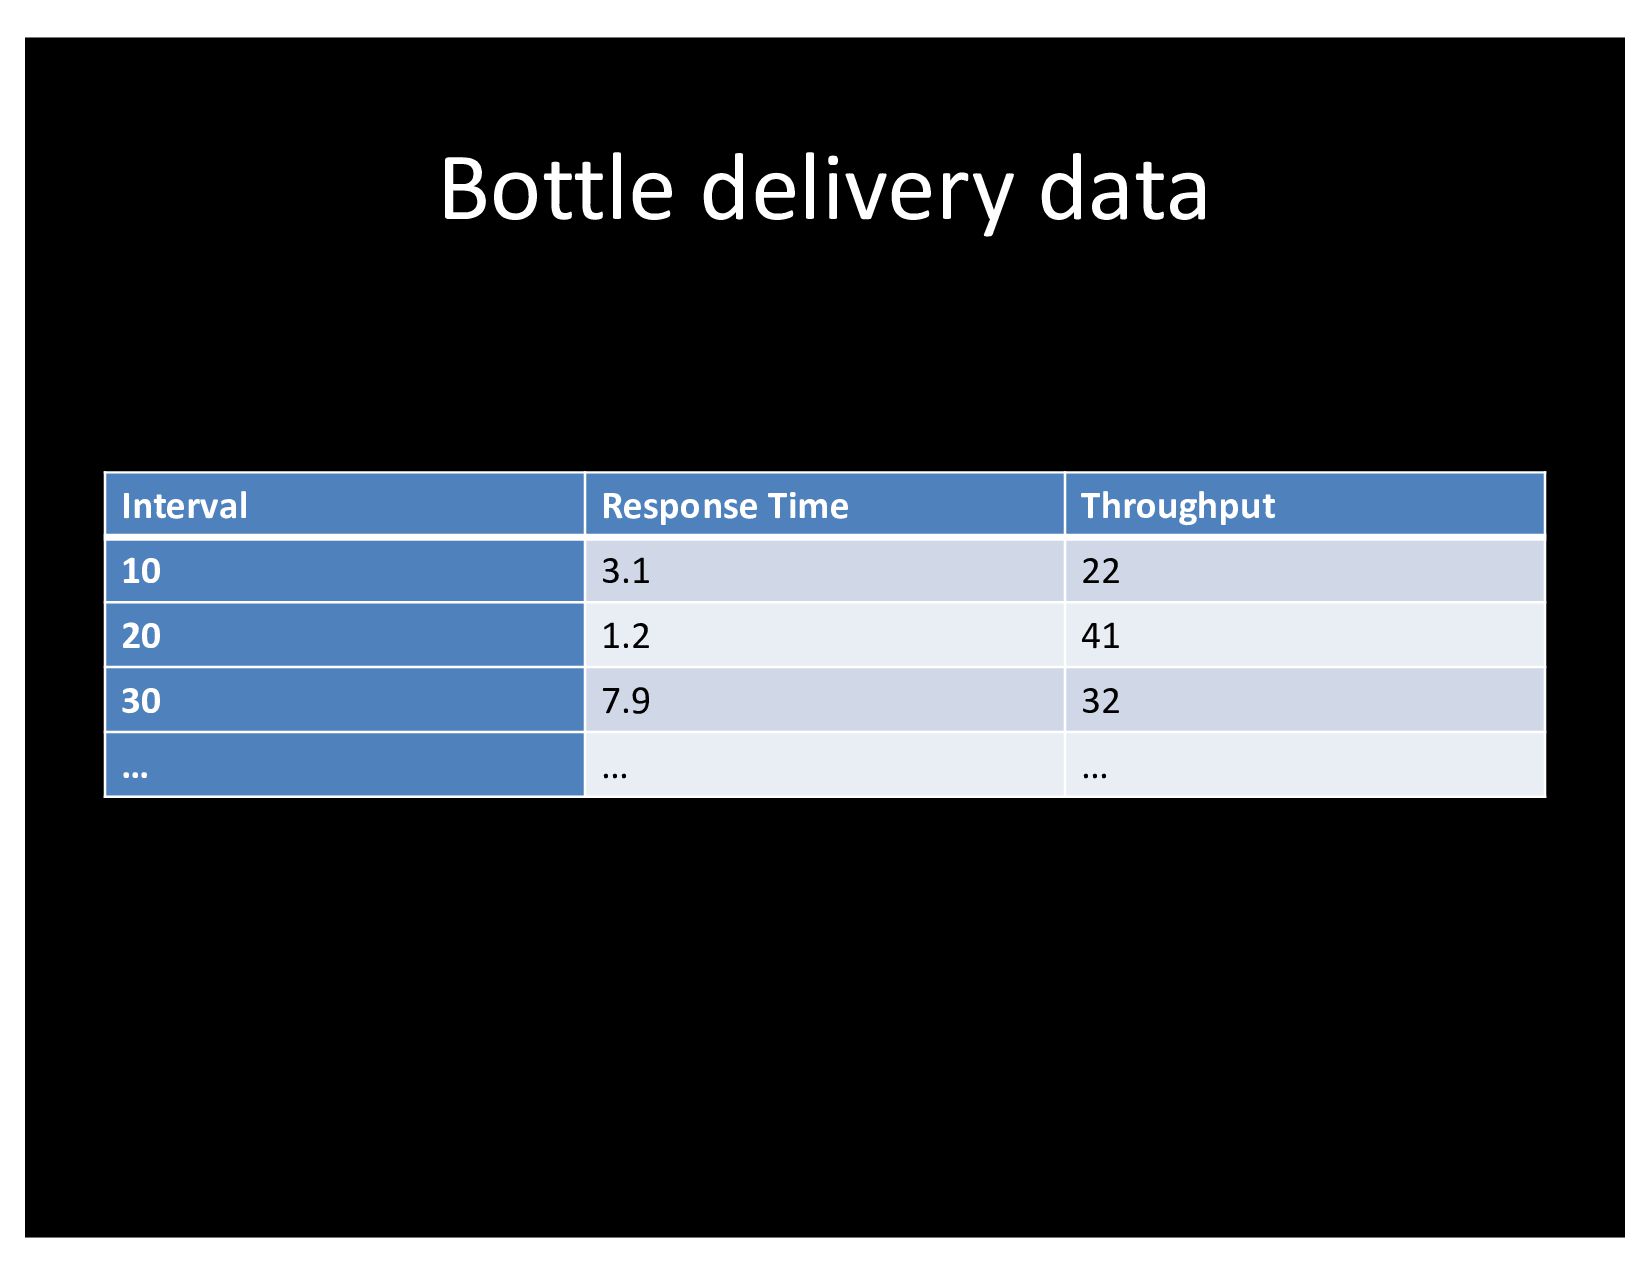
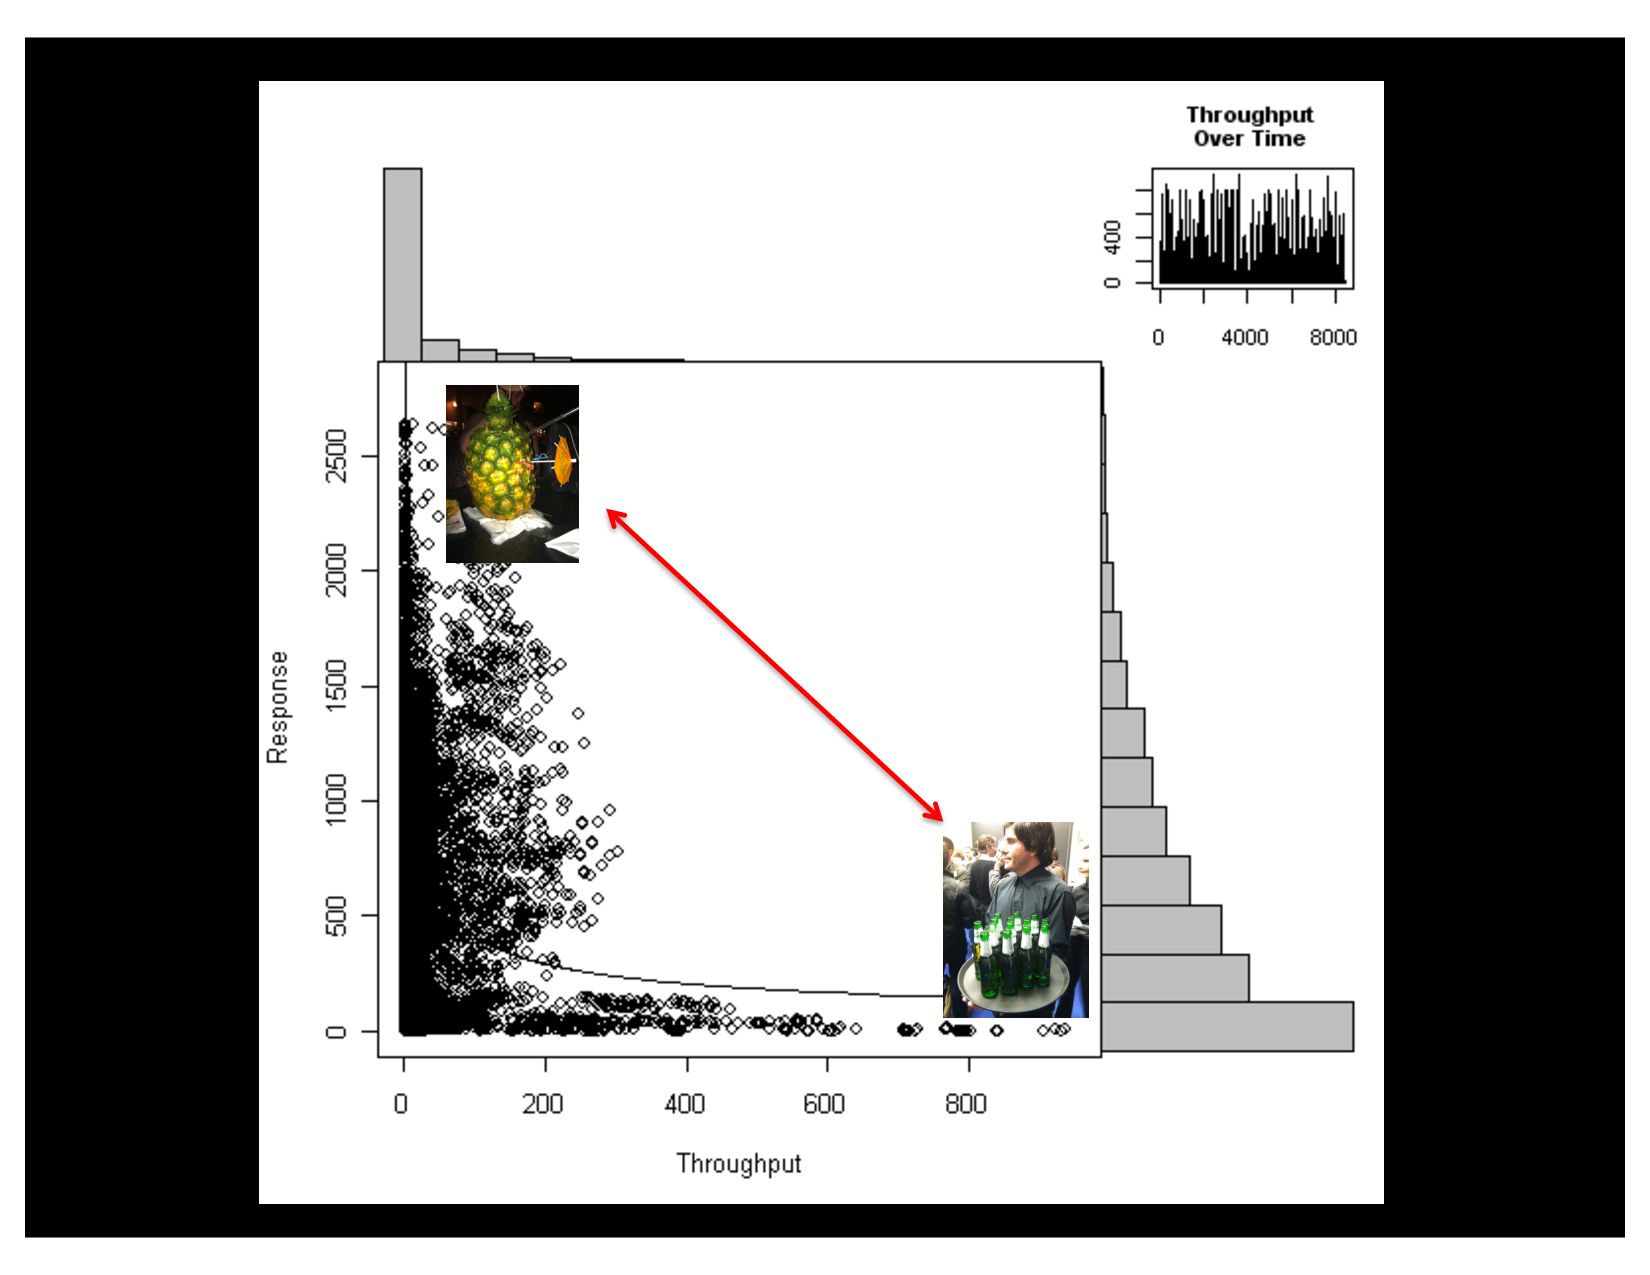
Bottle delivery data Interval Response Time Throughput 10 3.1 22
20 1.2 41 30 7.9 32 … … …
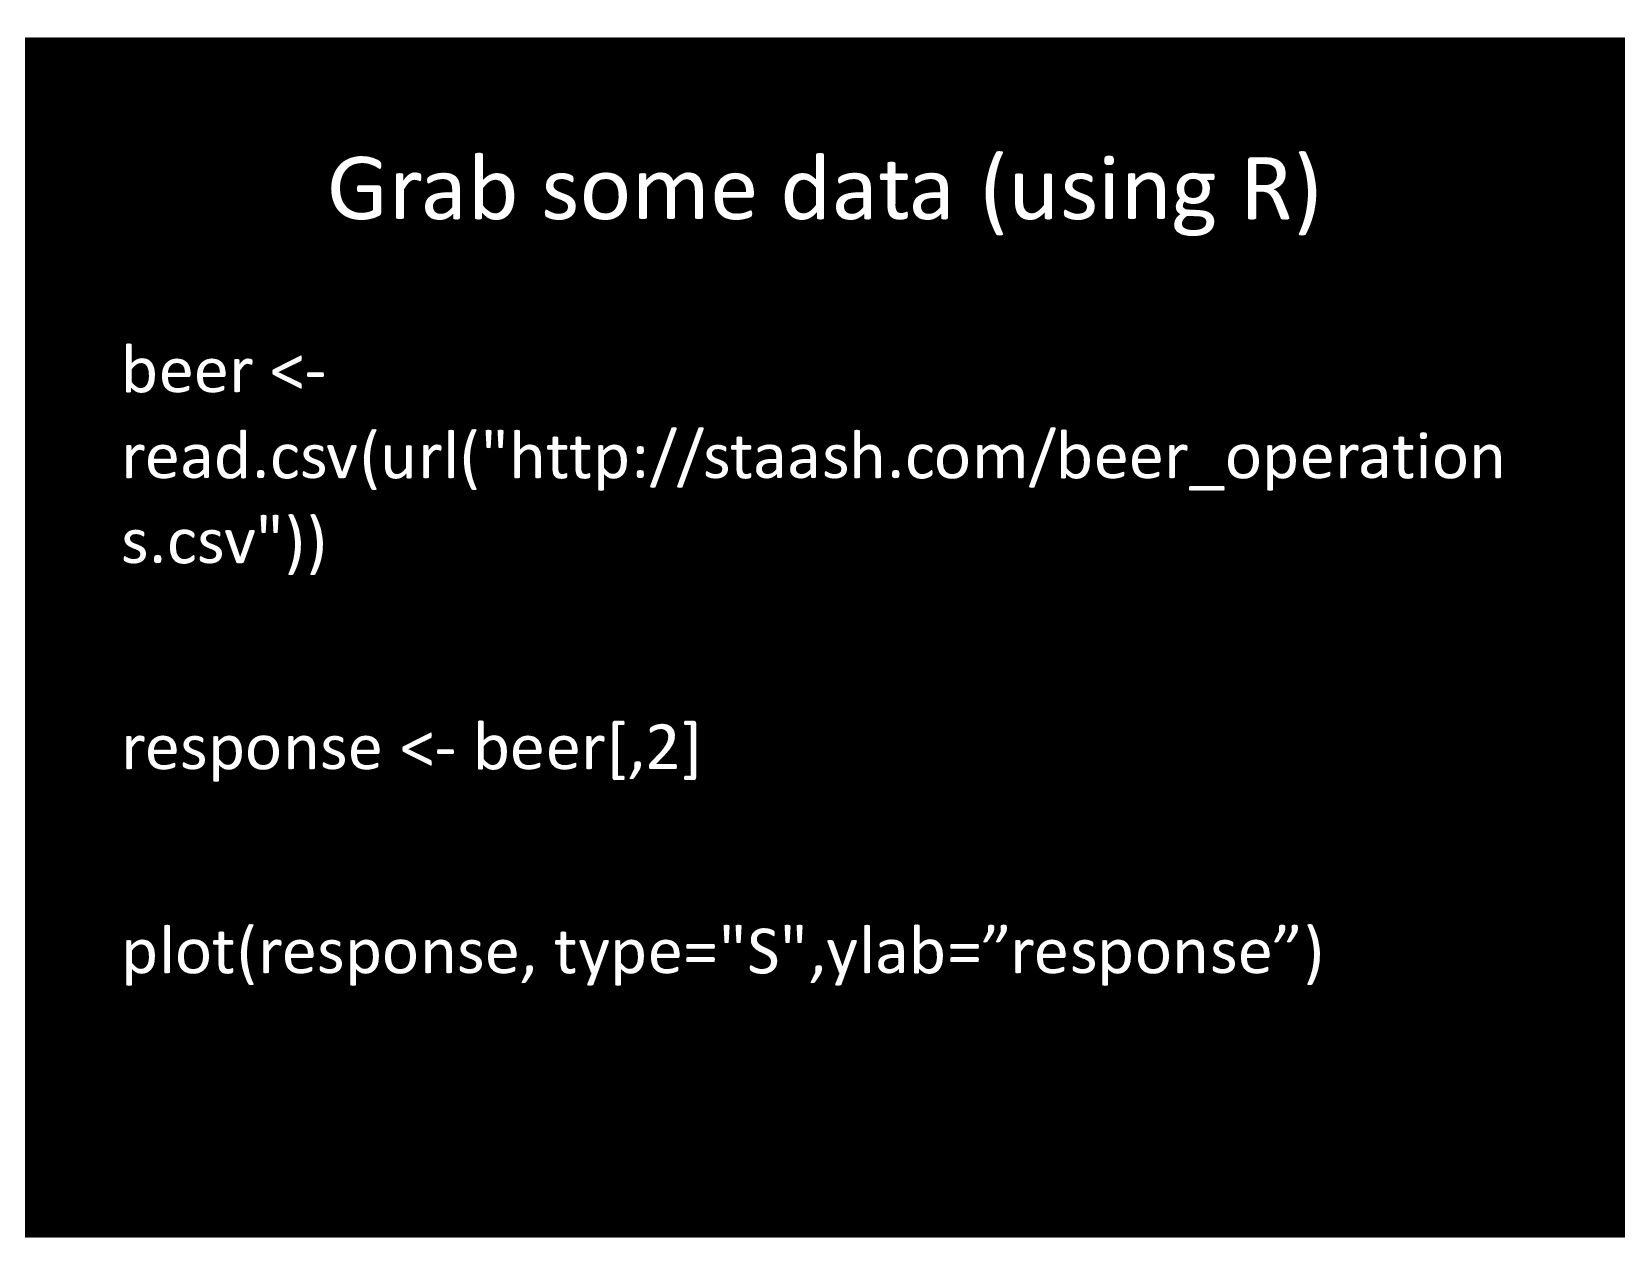
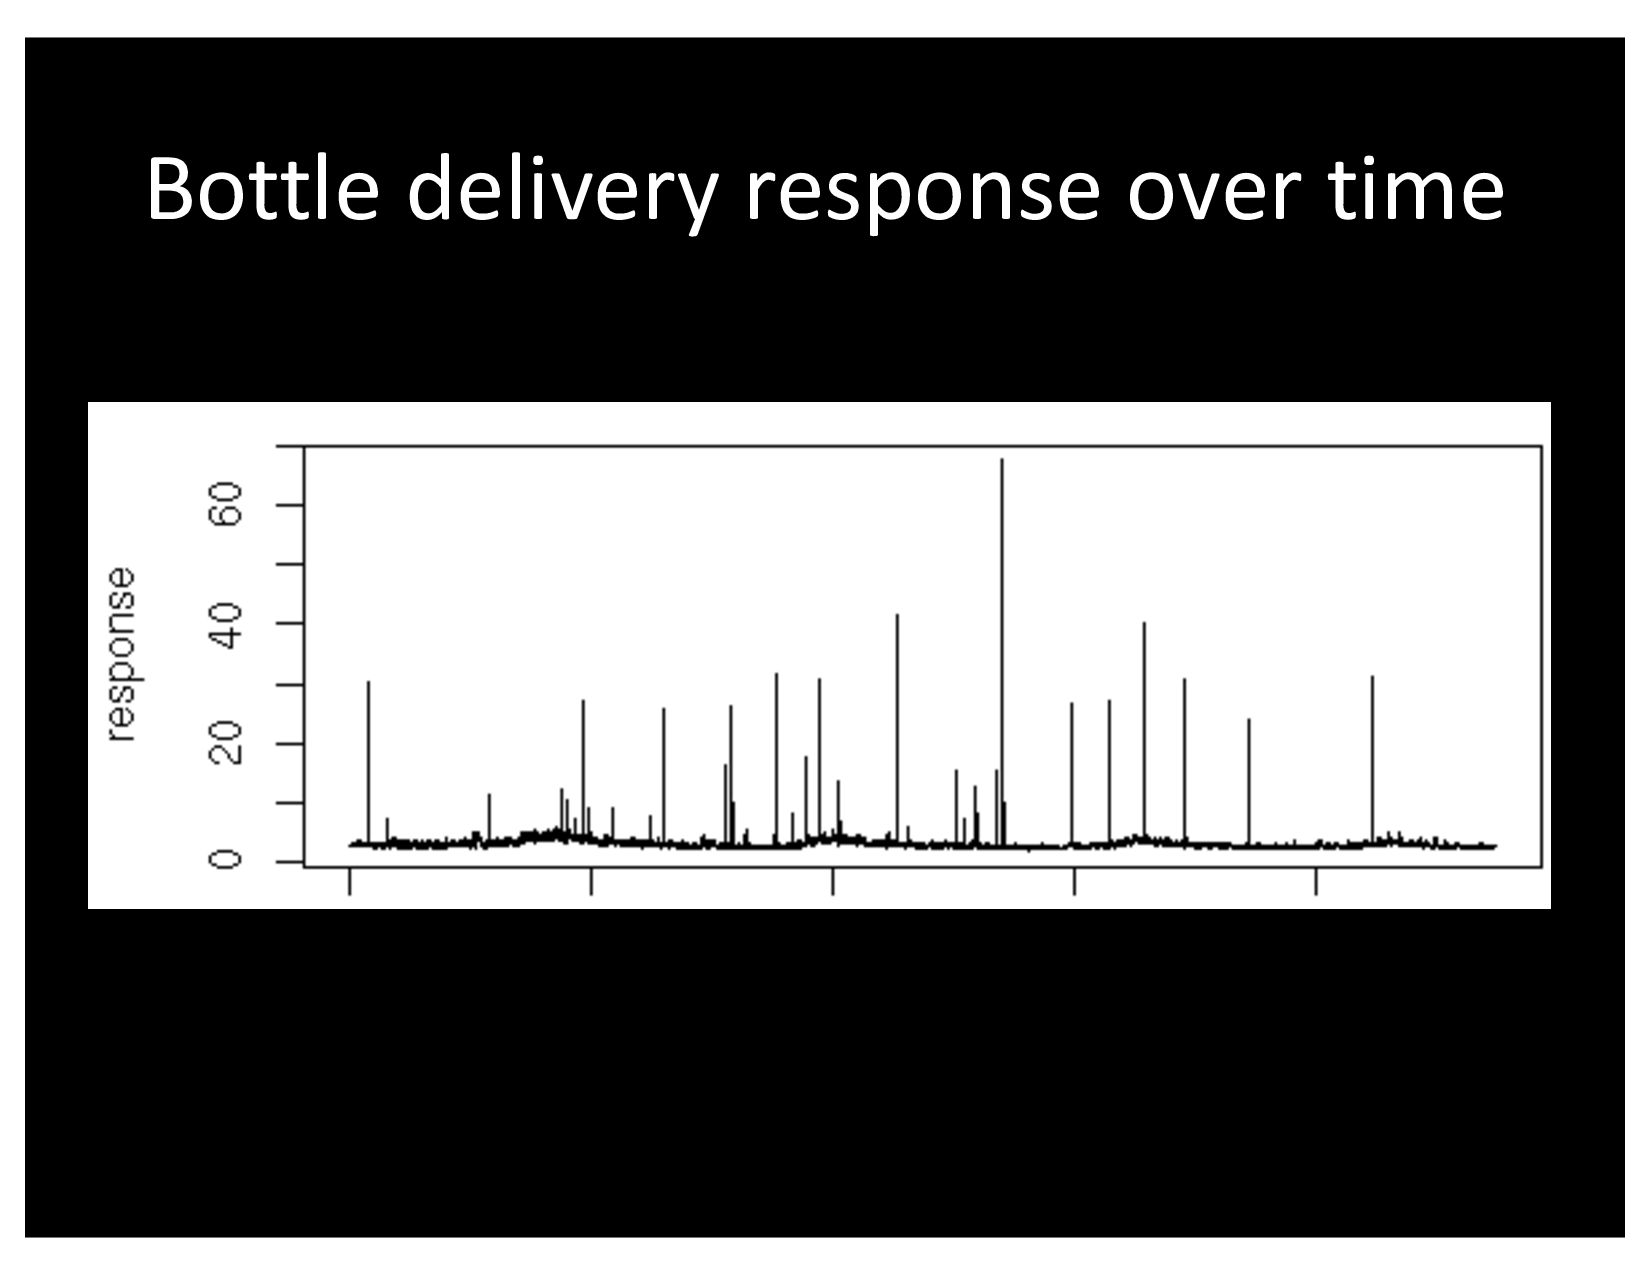
Grab some data (using R) beer <- read.csv(url("http://staash.com/beer_operation s.csv")) response
<- beer[,2] plot(response, type="S",ylab=”response”)
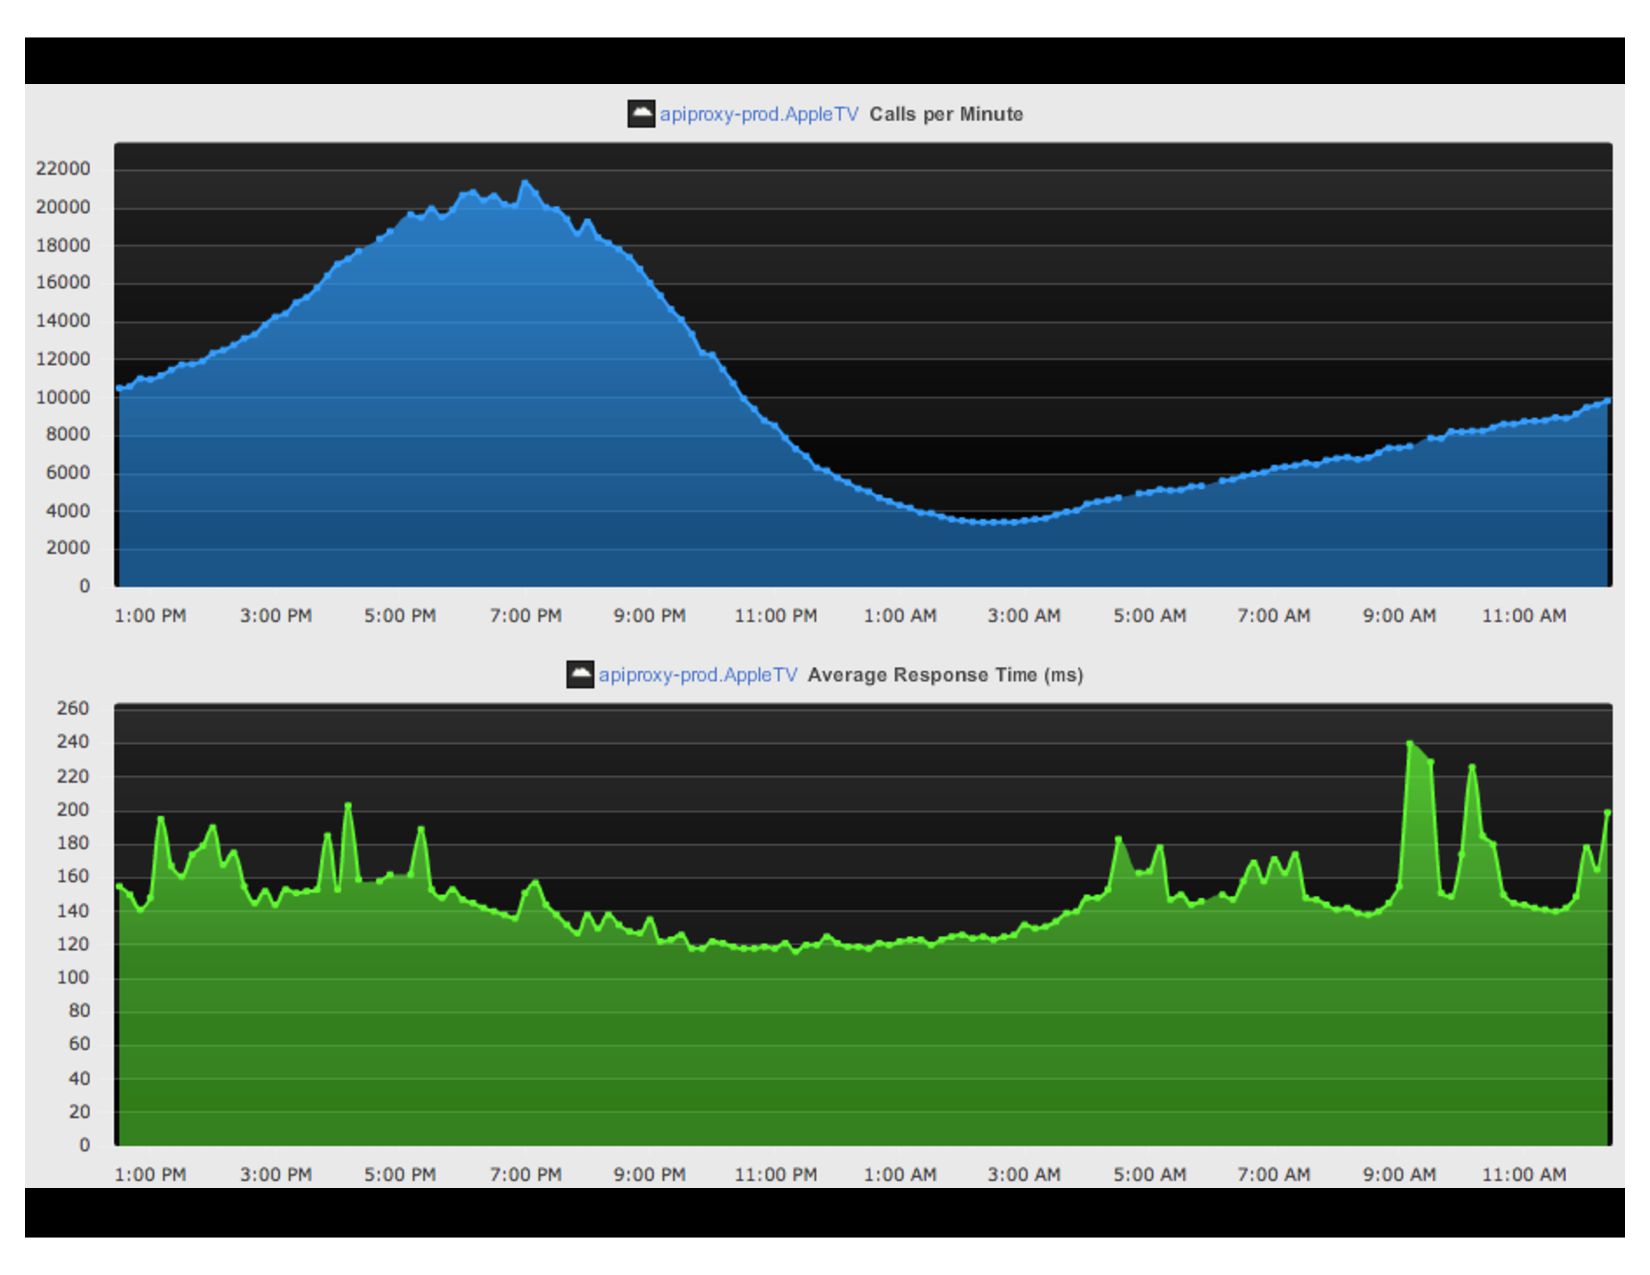
Bottle delivery response over time
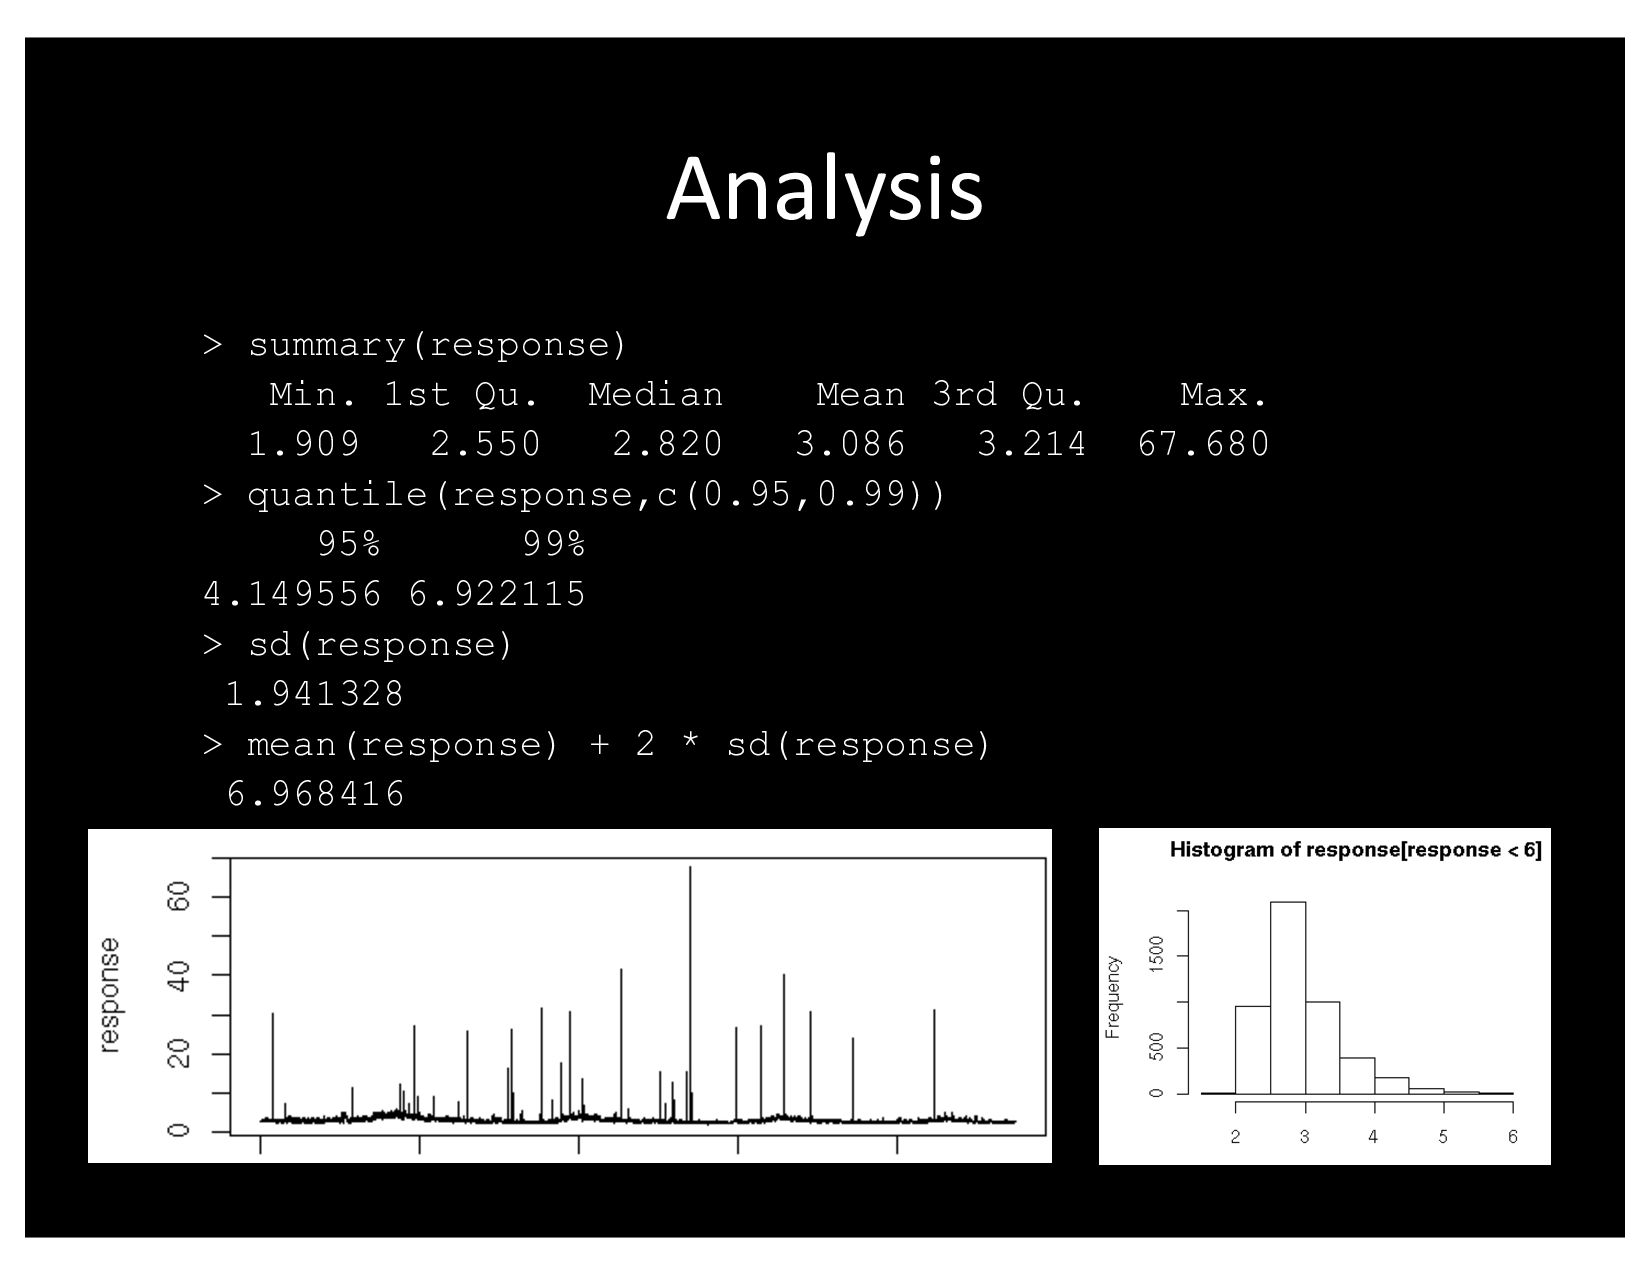
Analysis > summary(response) Min. 1st Qu. Median Mean 3rd Qu.
Max. 1.909 2.550 2.820 3.086 3.214 67.680 > quantile(response,c(0.95,0.99)) 95% 99% 4.149556 6.922115 > sd(response) 1.941328 > mean(response) + 2 * sd(response) 6.968416
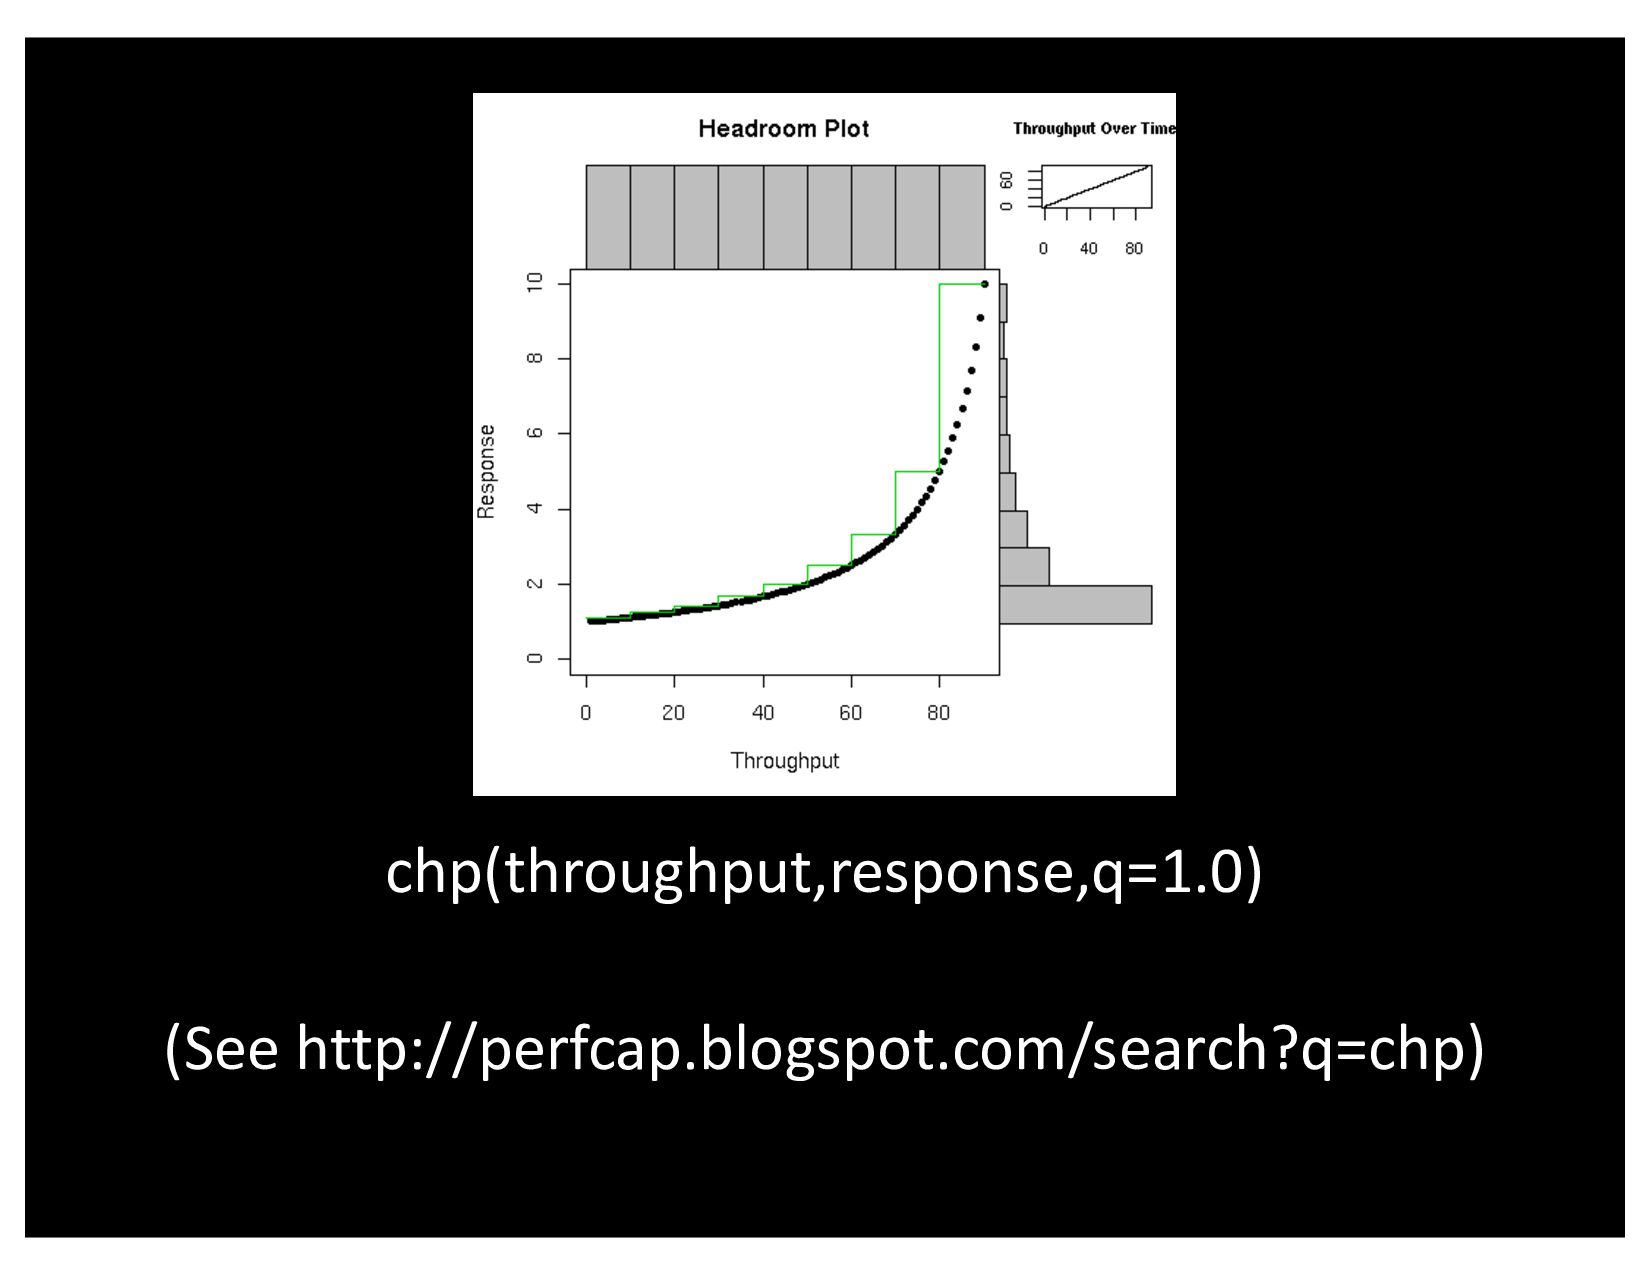
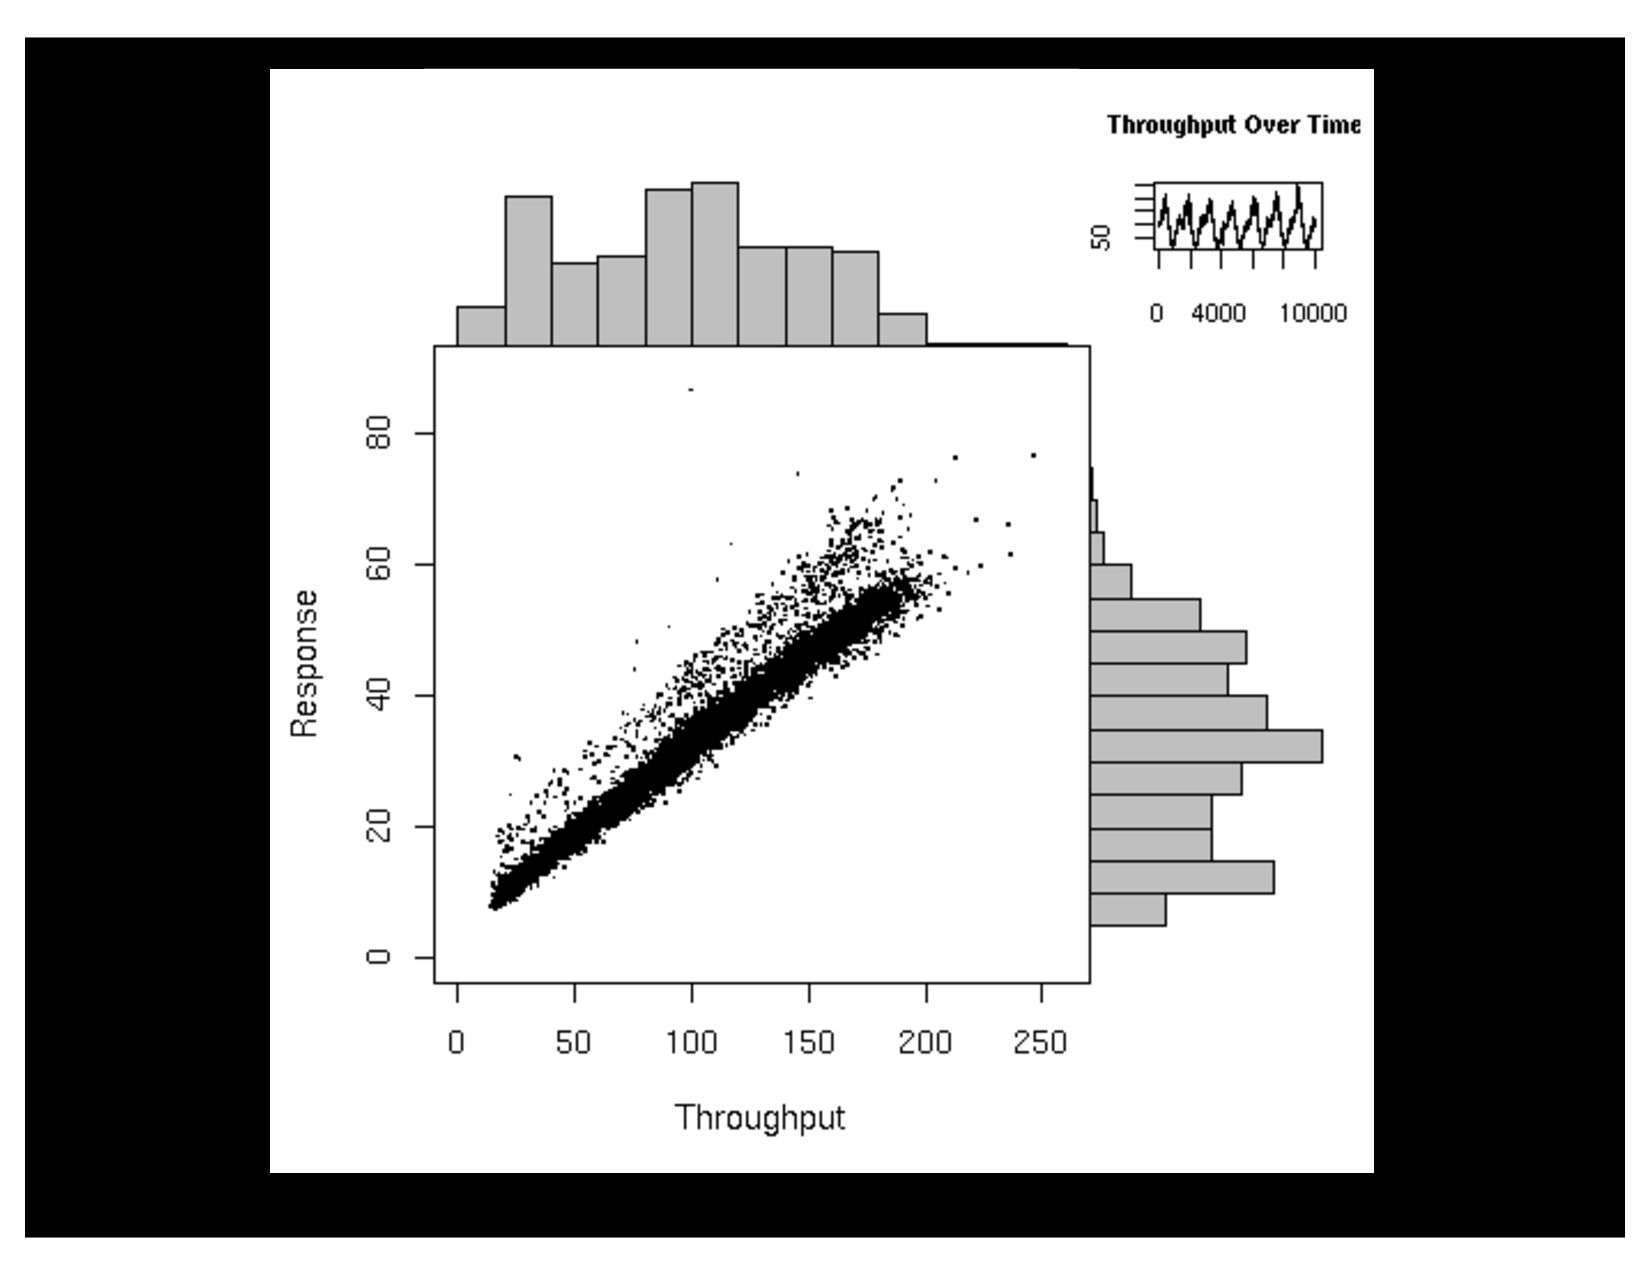
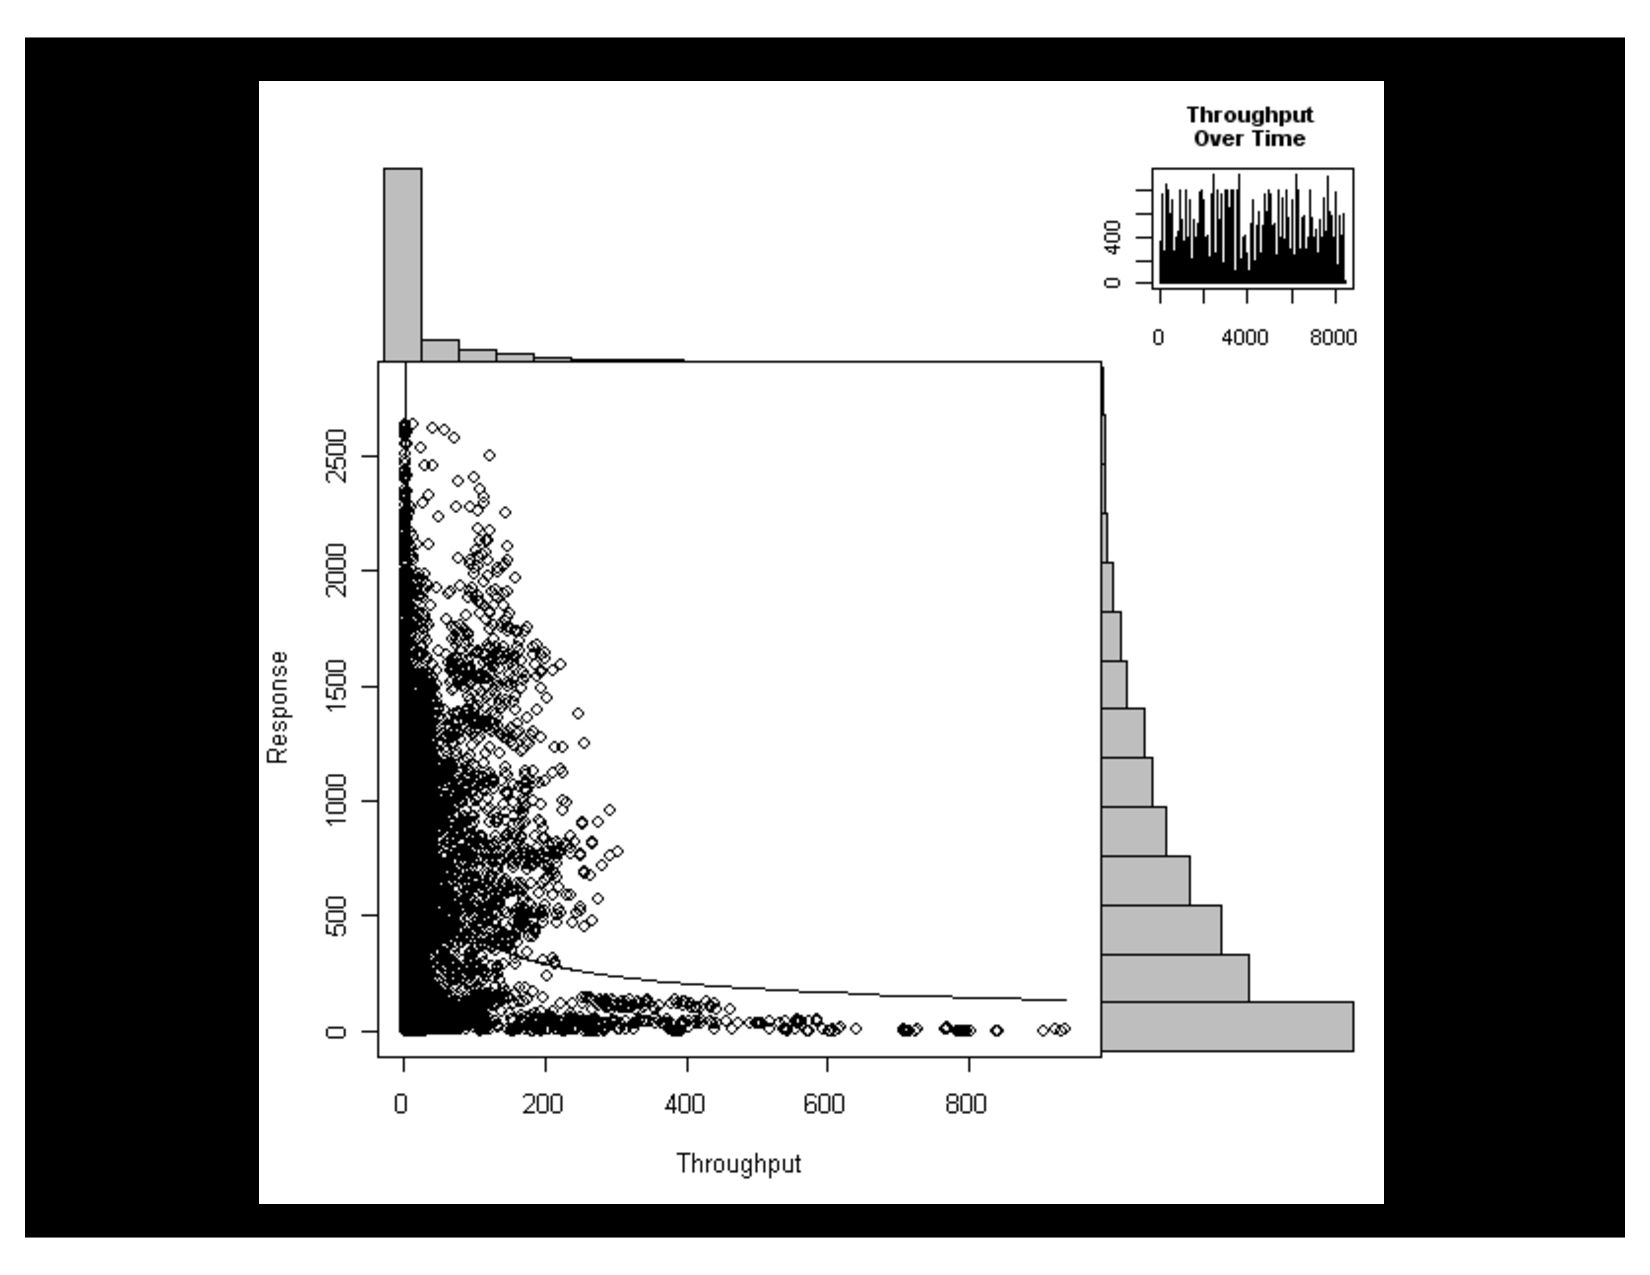
chp(throughput,response,q=1.0) (See http://perfcap.blogspot.com/search?q=chp)
None
None
None
None
None
None
None
None
None
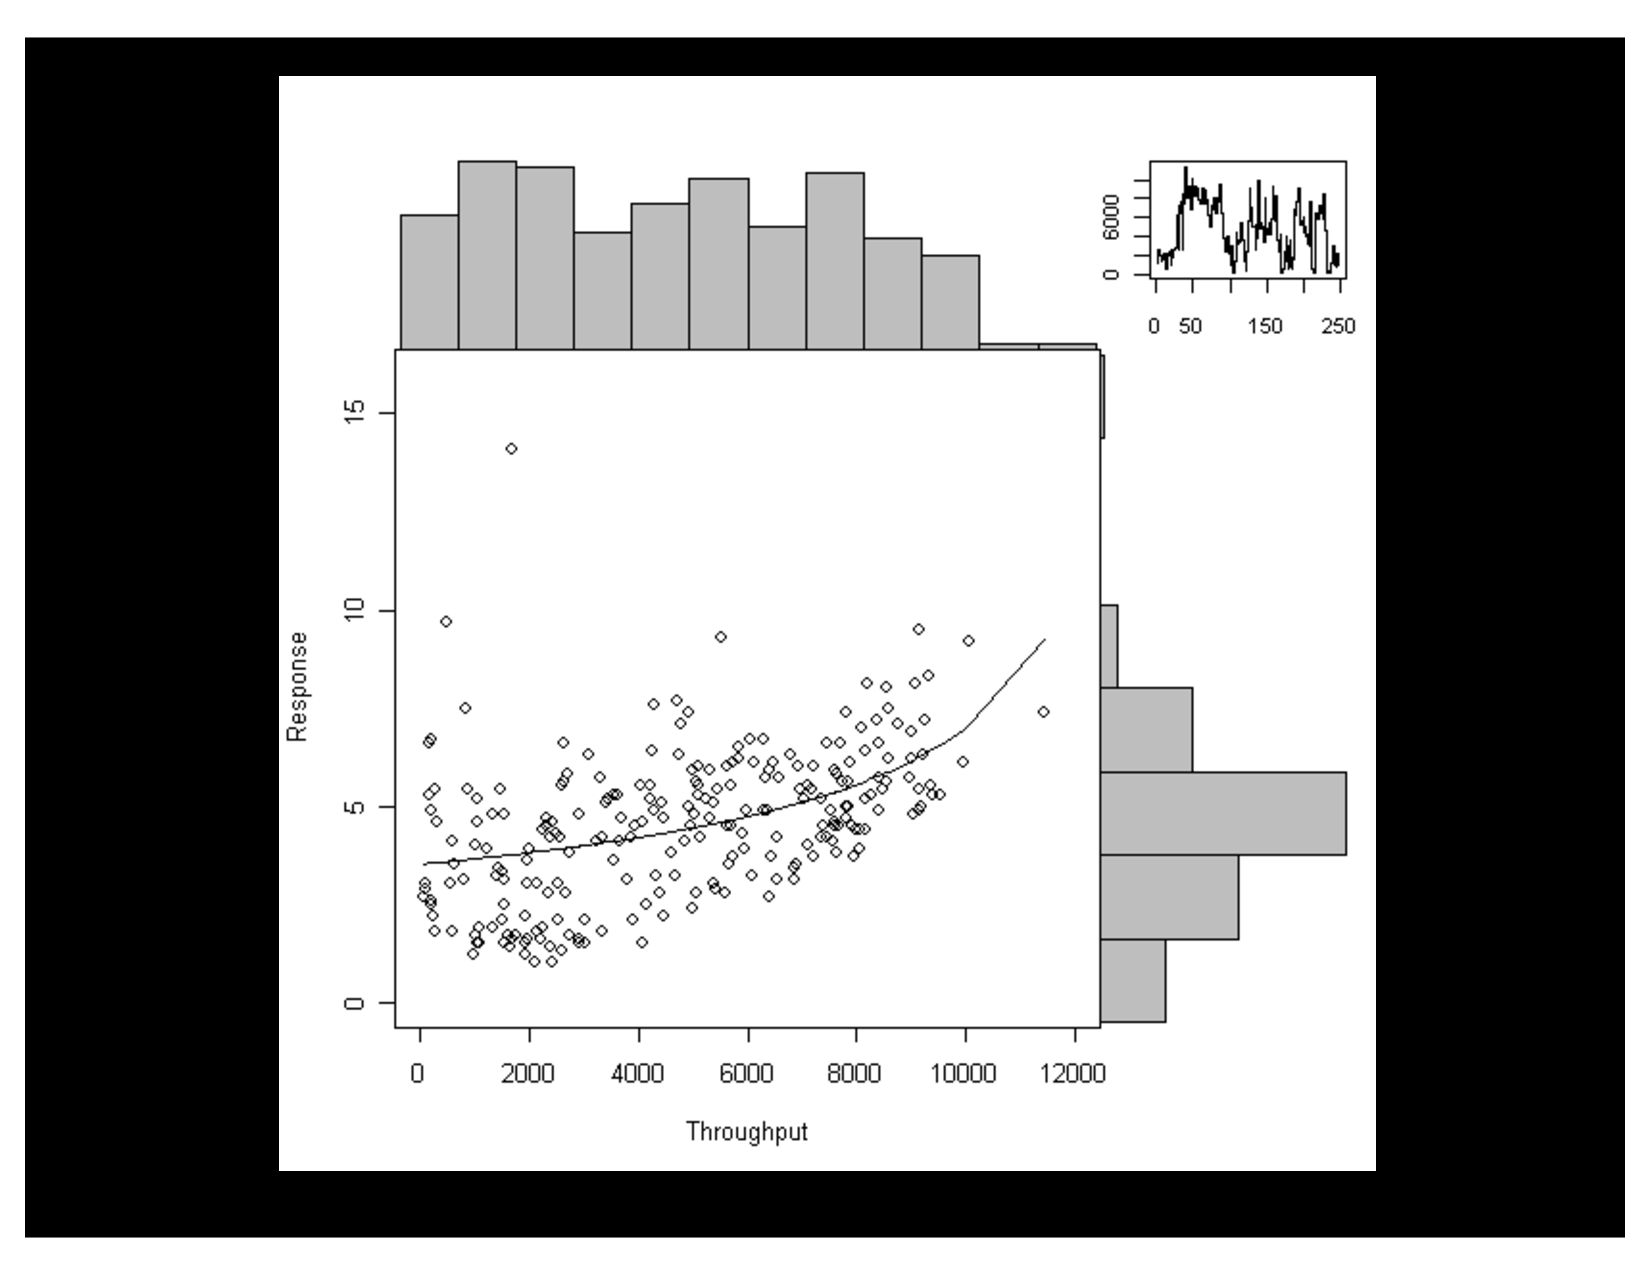
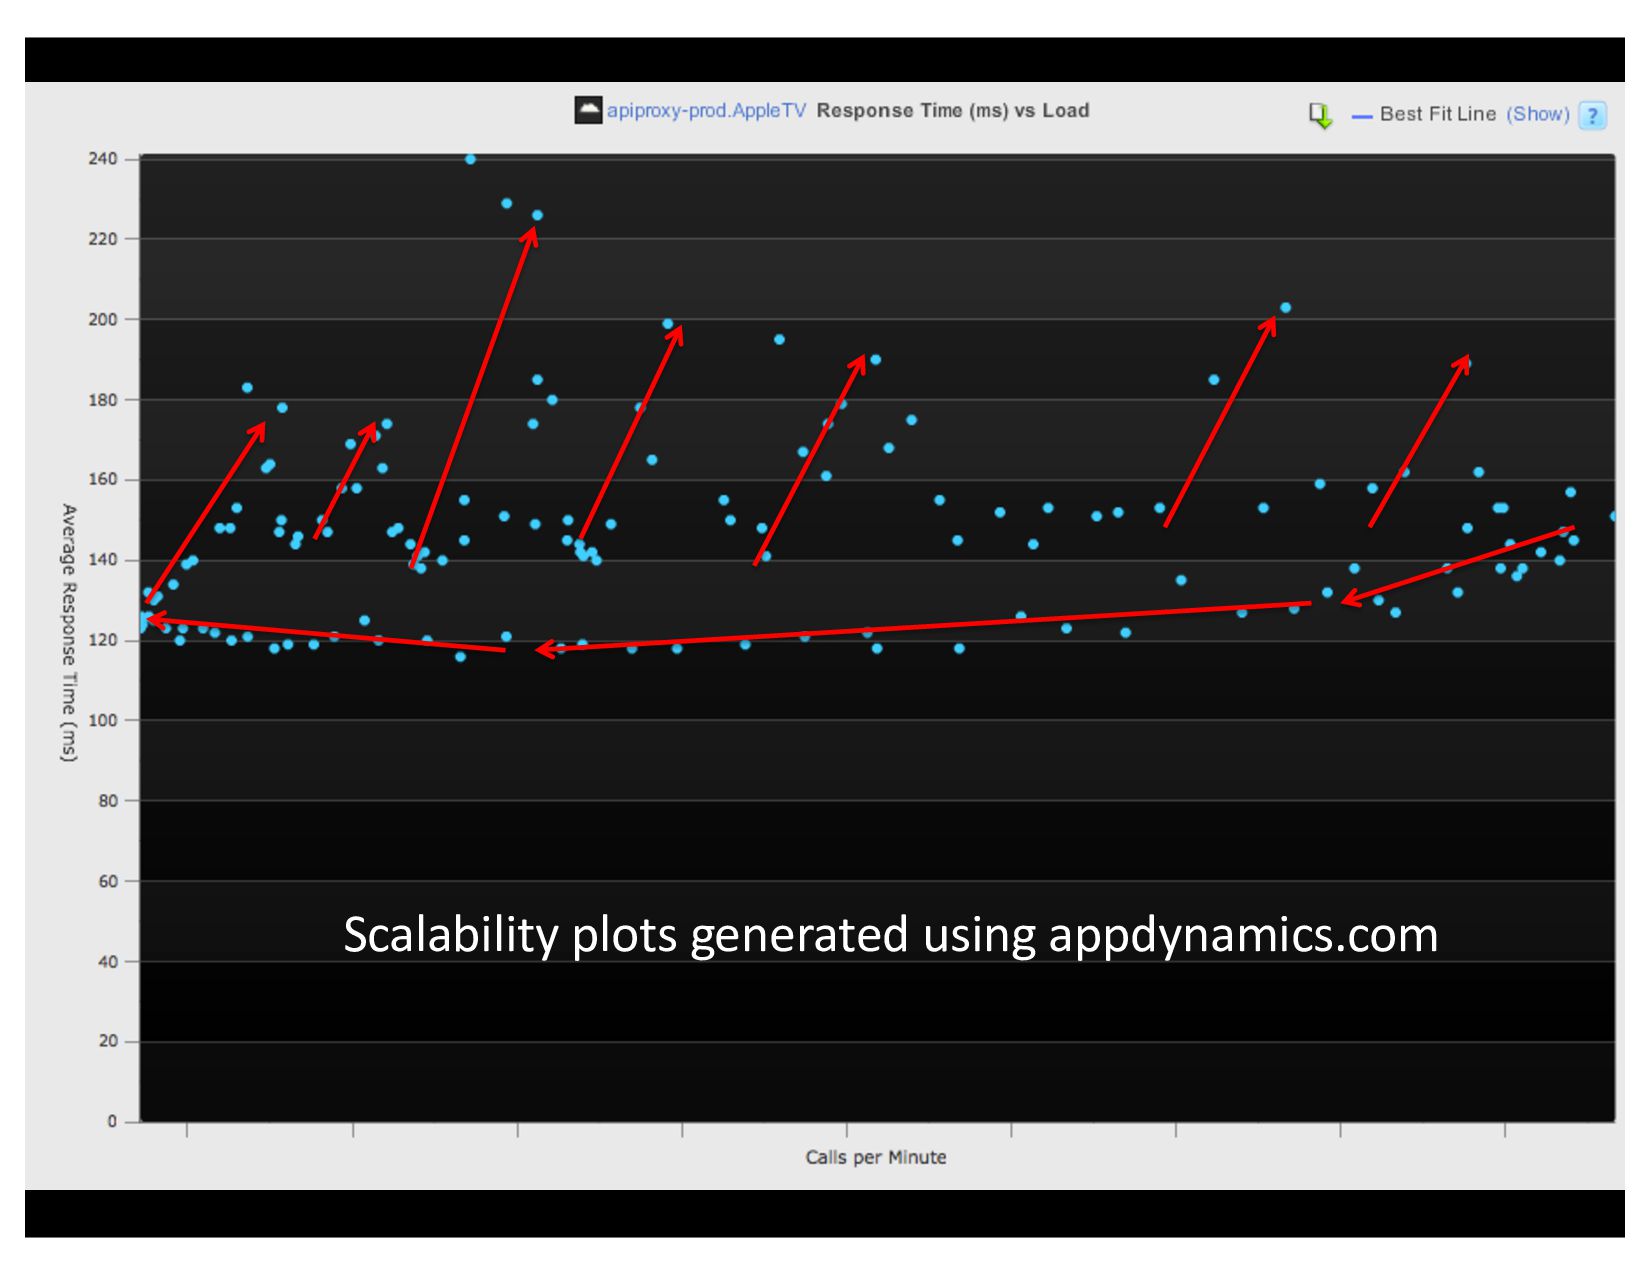
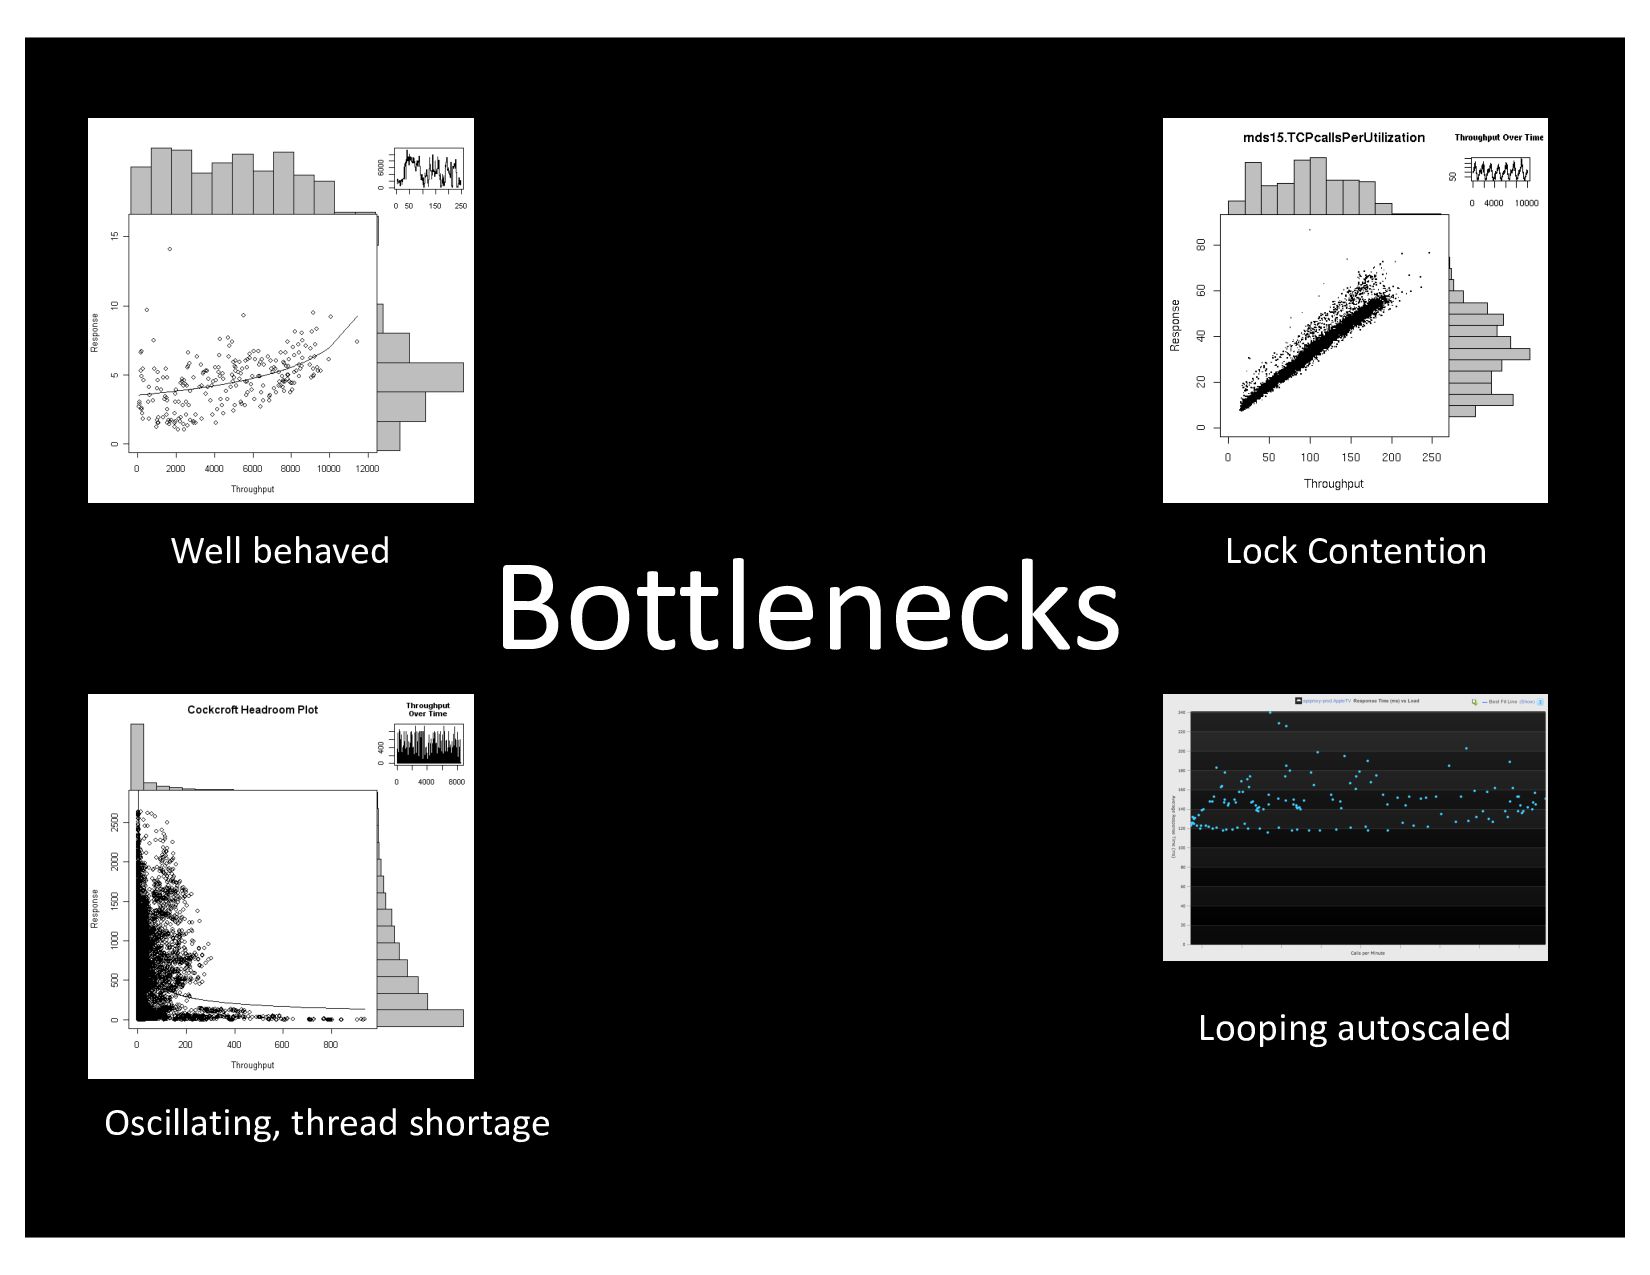
Scalability plots generated using appdynamics.com
Well behaved Lock Contention Oscillating, thread shortage Looping autoscaled Bottlenecks
http://perfcap.blogspot.com/search?q=chp @adrianco