Upgrade to Pro
— share decks privately, control downloads, hide ads and more …
Speaker Deck
Features
Speaker Deck
PRO
Sign in
Sign up for free
Search
Search
Meetup 18 avril 2017 Visualisation de données ...
Search
visualisation de données
April 19, 2017
Technology
40
0
Share
Embed
Copy iframe code
Copy JS code
Copy link
Start on current slide
Meetup 18 avril 2017 Visualisation de données Toulouse
news
visualisation de données
April 19, 2017
More Decks by visualisation de données
See All by visualisation de données
Arabesque : Explorer et visualiser facilement vos flux géo-localisés sur le web
alaino
0
390
Meetup TDV - 4/02/21 -Valoriser les données très hétérogènes d'Open Street Map
alaino
0
360
Optimisation des prix : Techniques et Visualisation
alaino
0
310
Mobiliscope
alaino
0
300
CREER DES CARTES AVEC QGIS ET DES OPEN DATA
alaino
0
490
The Vistorian & the Bertifier
alaino
0
700
La représentation des données en neuroscience cognitive
alaino
0
460
La représentation des données en neuroscience cognitive
alaino
0
400
Histoire de dataviz -(Eugénie Clement)
alaino
0
350
Other Decks in Technology
See All in Technology
コンテナ・K8s研修【MIXI 26新卒技術研修】
mixi_engineers
PRO
1
400
システム監視を 「システムを監視するだけ」で 終わらせないために
seiud
0
130
データベース研修【MIXI 26新卒技術研修】
mixi_engineers
PRO
1
500
Oracle Base Database Service 技術詳細
oracle4engineer
PRO
15
110k
DevOps Agentで運用判断をチーム資産にする ~Agent InstructionsとAgent Skillを継続的に育てる~
fujioka6789
0
130
AWS環境のセキュリティ不安を解消した企業事例 ~よくある課題と対策を一挙公開~
asanoharuki
0
220
「待ち時間」の消滅と「自我消耗」の加速:生成AI時代のエンジニアを救うメンタル・リソース管理
poropinai1966
0
250
事業成長とAI活用を止めないデータ基盤アーキテクチャの設計思想
hiracky16
0
750
文字起こし基盤の信頼性
abnoumaru
0
150
データ活用研修 データマネジメント【MIXI 26新卒技術研修】
mixi_engineers
PRO
4
620
書籍セキュアAPIについて
riiimparm
0
360
モバイル研修【MIXI 26新卒技術研修】
mixi_engineers
PRO
1
260
Featured
See All Featured
From Legacy to Launchpad: Building Startup-Ready Communities
dugsong
0
270
Money Talks: Using Revenue to Get Sh*t Done
nikkihalliwell
0
420
Leveraging Curiosity to Care for An Aging Population
cassininazir
1
430
Save Time (by Creating Custom Rails Generators)
garrettdimon
PRO
32
4k
The Spectacular Lies of Maps
axbom
PRO
1
870
AI: The stuff that nobody shows you
jnunemaker
PRO
9
850
How to Think Like a Performance Engineer
csswizardry
28
2.7k
Max Prin - Stacking Signals: How International SEO Comes Together (And Falls Apart)
techseoconnect
PRO
0
330
Claude Code のすすめ
schroneko
67
230k
Amusing Abliteration
ianozsvald
1
240
How To Speak Unicorn (iThemes Webinar)
marktimemedia
1
520
Fashionably flexible responsive web design (full day workshop)
malarkey
408
67k
Transcript
MeetupVisualisation des données Toulouse 18 Avril 2017 News Lightning talks
• Les visualisations du mois • Pourquoi il ne faudrait jamais utiliser les radar plots ? (Christophe Bontemps) • La datavisualization avec P5.js (Alain Ottenheimer) • Visualiser la trésorerie (Alain Roan) Reporté
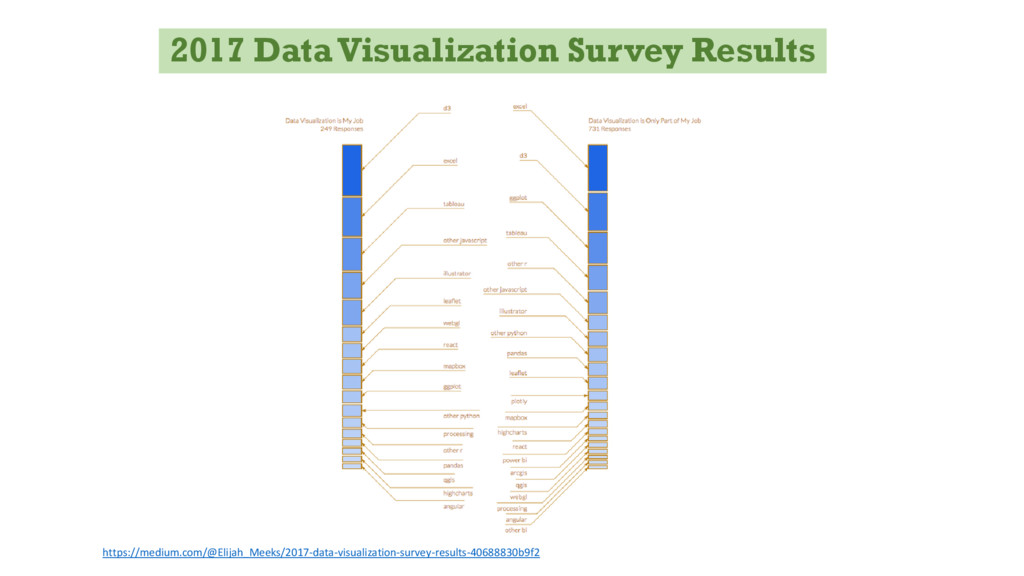
https://medium.com/@Elijah_Meeks/2017-data-visualization-survey-results-40688830b9f2 2017 Data Visualization Survey Results
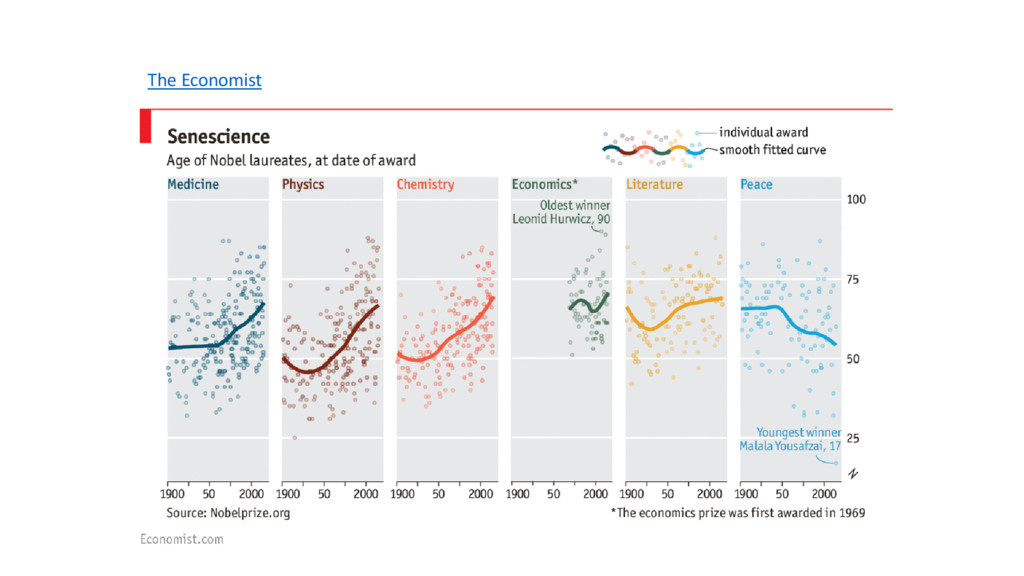
The Economist
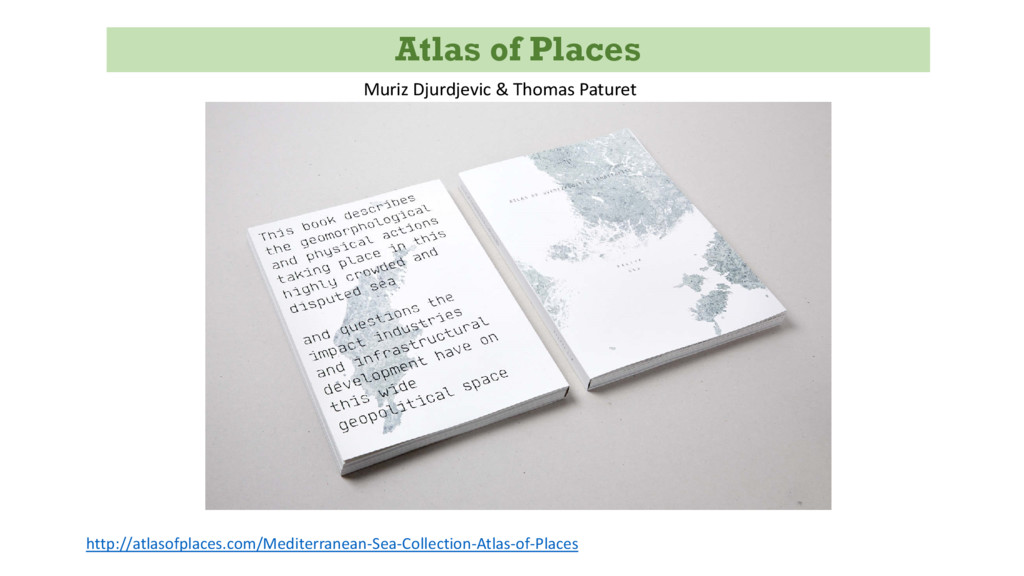
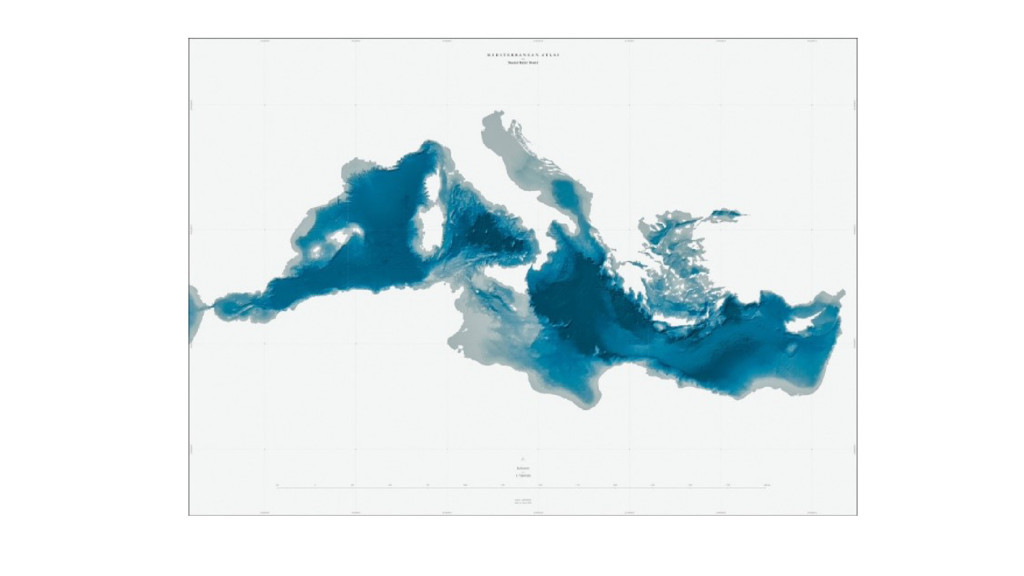
Atlas of Places http://atlasofplaces.com/Mediterranean-Sea-Collection-Atlas-of-Places Muriz Djurdjevic & Thomas Paturet
None
None
None