Upgrade to Pro — share decks privately, control downloads, hide ads and more …

The Vistorian & the Bertifier

The Vistorian & the Bertifier

Comment visualiser les réseaux dans l’espace et dans le temps ?
Comment voir des tables ? The Bertifier

visualisation de données

January 10, 2019
Tweet

More Decks by visualisation de données

Other Decks in Science

Transcript

  1. The Vistorian The Bertifier Conclusion Références
    The Vistorian & the Bertifier :
    Two online tools for visualizing
    Networks and Tables
    Christophe Bontemps
    Toulouse School of Economics, INRA
    @Xtophe_Bontemps

    View Slide

  2. The Vistorian The Bertifier Conclusion Références
    ABOUT ME & MY JOB
    Econometrician @INRA & Toulouse School of Economics

    View Slide

  3. The Vistorian The Bertifier Conclusion Références
    ABOUT ME & MY JOB
    Econometrician @INRA & Toulouse School of Economics
    R useR ! (Local organizer of useR! 2019)

    View Slide

  4. The Vistorian The Bertifier Conclusion Références
    ABOUT ME & MY JOB
    Econometrician @INRA & Toulouse School of Economics
    R useR ! (Local organizer of useR! 2019)
    Teach Data Visualisation & other stuff (Economics,
    statistics)

    View Slide

  5. The Vistorian The Bertifier Conclusion Références
    ABOUT ME & MY JOB
    Econometrician @INRA & Toulouse School of Economics
    R useR ! (Local organizer of useR! 2019)
    Teach Data Visualisation & other stuff (Economics,
    statistics)

    View Slide

  6. The Vistorian The Bertifier Conclusion Références
    ABOUT ME & MY JOB
    Econometrician @INRA & Toulouse School of Economics
    R useR ! (Local organizer of useR! 2019)
    Teach Data Visualisation & other stuff (Economics,
    statistics)
    Co-organiser of the Toulouse Dataviz Meetup

    View Slide

  7. The Vistorian The Bertifier Conclusion Références
    [- THE VISTORIAN -]
    Visualizing :
    Dynamic, Multivariate, and Geographic Networks

    View Slide

  8. The Vistorian The Bertifier Conclusion Références
    [- THE VISTORIAN -]
    Visualizing :
    Dynamic, Multivariate, and Geographic Networks

    View Slide

  9. The Vistorian The Bertifier Conclusion Références
    [- THE VISTORIAN -]
    Visualizing :
    Dynamic, Multivariate, and Geographic Networks

    View Slide

  10. The Vistorian The Bertifier Conclusion Références
    [- THE VISTORIAN -]
    Visualizing :
    Dynamic, Multivariate, and Geographic Networks

    View Slide

  11. The Vistorian The Bertifier Conclusion Références
    [- THE VISTORIAN -]
    Visualizing :
    Dynamic, Multivariate, and Geographic Networks

    View Slide

  12. The Vistorian The Bertifier Conclusion Références
    [- THE VISTORIAN -]
    Visualizing :
    Dynamic, Multivariate, and Geographic Networks

    View Slide

  13. The Vistorian The Bertifier Conclusion Références
    [- THE VISTORIAN -]
    Another great tool from the AVIZ team @INRIA
    Related papers : Bach et al. (2015) , Molinero et al. (2017)
    This presentation is largely inspired by Benjamin Bach’s tutorial :
    https://github.com/networkcube/networkcube/wiki.

    View Slide

  14. The Vistorian The Bertifier Conclusion Références
    VISUALIZING DYNAMIC, MULTIVARIATE, AND
    GEOGRAPHIC NETWORKS
    Network type of data :

    View Slide

  15. The Vistorian The Bertifier Conclusion Références
    VISUALIZING DYNAMIC, MULTIVARIATE, AND
    GEOGRAPHIC NETWORKS
    Network type of data :
    Sender → receiver

    View Slide

  16. The Vistorian The Bertifier Conclusion Références
    VISUALIZING DYNAMIC, MULTIVARIATE, AND
    GEOGRAPHIC NETWORKS
    Network type of data :
    Sender → receiver
    Spatial type of data :

    View Slide

  17. The Vistorian The Bertifier Conclusion Références
    VISUALIZING DYNAMIC, MULTIVARIATE, AND
    GEOGRAPHIC NETWORKS
    Network type of data :
    Sender → receiver
    Spatial type of data :
    Location of sender → location receiver

    View Slide

  18. The Vistorian The Bertifier Conclusion Références
    VISUALIZING DYNAMIC, MULTIVARIATE, AND
    GEOGRAPHIC NETWORKS
    Network type of data :
    Sender → receiver
    Spatial type of data :
    Location of sender → location receiver
    Time series data :

    View Slide

  19. The Vistorian The Bertifier Conclusion Références
    VISUALIZING DYNAMIC, MULTIVARIATE, AND
    GEOGRAPHIC NETWORKS
    Network type of data :
    Sender → receiver
    Spatial type of data :
    Location of sender → location receiver
    Time series data :
    Date of the letter

    View Slide

  20. The Vistorian The Bertifier Conclusion Références
    VISUALIZING DYNAMIC, MULTIVARIATE, AND
    GEOGRAPHIC NETWORKS
    Network type of data :
    Sender → receiver
    Spatial type of data :
    Location of sender → location receiver
    Time series data :
    Date of the letter

    View Slide

  21. The Vistorian The Bertifier Conclusion Références
    VISUALIZING NETWORKS
    Node-Link Visualisation

    View Slide

  22. The Vistorian The Bertifier Conclusion Références
    VISUALIZING NETWORKS
    Node-Link Visualisation

    View Slide

  23. The Vistorian The Bertifier Conclusion Références
    VISUALIZING NETWORKS
    Also with an Adjacency Matrix

    View Slide

  24. The Vistorian The Bertifier Conclusion Références
    VISUALIZING NETWORKS
    Also with an Adjacency Matrix

    View Slide

  25. The Vistorian The Bertifier Conclusion Références
    VISUALIZING MULTIVARIATE NETWORKS
    Network representation :

    View Slide

  26. The Vistorian The Bertifier Conclusion Références
    VISUALIZING MULTIVARIATE NETWORKS
    Network representation :

    View Slide

  27. The Vistorian The Bertifier Conclusion Références
    VISUALIZING MULTIVARIATE NETWORKS
    Network representation :
    Time component with multiple sending (different time) :

    View Slide

  28. The Vistorian The Bertifier Conclusion Références
    VISUALIZING MULTIVARIATE NETWORKS
    Network representation :
    Time component with multiple sending (different time) :

    View Slide

  29. The Vistorian The Bertifier Conclusion Références
    VISUALIZING MULTIVARIATE NETWORKS
    Network representation :
    Time component with multiple sending (different time) :

    View Slide

  30. The Vistorian The Bertifier Conclusion Références
    VISUALIZING MULTIVARIATE NETWORKS
    Network representation :
    Time component with multiple sending (different time) :

    View Slide

  31. The Vistorian The Bertifier Conclusion Références
    VISUALIZING MULTIVARIATE NETWORKS
    Network representation :
    Time component with multiple sending (different time) :

    View Slide

  32. The Vistorian The Bertifier Conclusion Références
    VISUALIZING MULTIVARIATE NETWORKS
    Many network representation :

    View Slide

  33. The Vistorian The Bertifier Conclusion Références
    VISUALIZING MULTIVARIATE NETWORKS
    Many network representation :

    View Slide

  34. The Vistorian The Bertifier Conclusion Références
    VISUALIZING MULTIVARIATE NETWORKS
    Many network representation :

    View Slide

  35. The Vistorian The Bertifier Conclusion Références
    VISUALIZING DYNAMIC MULTIVARIATE NETWORKS
    Changes over time ?

    View Slide

  36. The Vistorian The Bertifier Conclusion Références
    VISUALIZING DYNAMIC MULTIVARIATE NETWORKS
    Changes over time ?

    View Slide

  37. The Vistorian The Bertifier Conclusion Références
    VISUALIZING MULTIVARIATE GEOGRAPHICAL
    NETWORKS
    GeoMap Visualization

    View Slide

  38. The Vistorian The Bertifier Conclusion Références
    VISUALIZING MULTIVARIATE GEOGRAPHICAL
    NETWORKS
    GeoMap Visualization

    View Slide

  39. The Vistorian The Bertifier Conclusion Références
    VISUALIZING DYNAMIC MULTIVARIATE
    GEOGRAPHICAL NETWORKS
    Dynamic Ego Network Visualization

    View Slide

  40. The Vistorian The Bertifier Conclusion Références
    VISUALIZING DYNAMIC MULTIVARIATE
    GEOGRAPHICAL NETWORKS
    Dynamic Ego Network Visualization

    View Slide

  41. The Vistorian The Bertifier Conclusion Références
    VISUALIZING DYNAMIC MULTIVARIATE
    GEOGRAPHICAL NETWORKS
    [- Demo -]
    http://vistorian.net/

    View Slide

  42. The Vistorian The Bertifier Conclusion Références
    [- AND NOW... -]

    View Slide

  43. The Vistorian The Bertifier Conclusion Références
    TABLES AND MATRICES : CASE STUDY
    Data with many 0/1 variables :
    Facilities indicators for 16 towns (A-P)
    Cities
    A B C D E F G H I J K L M N O P # Facilities
    0 0 0 0 0 0 0 1 0 0 1 0 0 0 0 0 1 School
    0 1 1 1 0 0 1 0 0 0 0 1 0 0 1 0 2 Agricultural Coop
    0 0 0 0 0 0 0 1 0 0 1 0 0 0 0 0 3 Station
    1 1 0 0 1 1 0 0 1 1 0 0 1 1 0 1 4 School (one class)
    0 1 1 1 0 0 1 0 0 0 0 1 0 0 1 0 5 Vet
    1 1 0 0 1 1 0 0 1 1 0 0 1 1 0 1 6 No doctor
    0 0 0 0 0 0 0 0 0 1 0 0 0 1 0 0 7 No running water
    0 0 1 0 0 0 0 1 0 0 1 0 0 0 0 0 8 Police station
    0 1 1 1 0 0 1 0 0 0 0 1 0 0 1 0 9 Land consolidation
    from Bertin (1977)

    View Slide

  44. The Vistorian The Bertifier Conclusion Références
    [- THE BERTIFIER -]
    "Ordering is visualising"
    Using Bertin (1977) principles, The AVIZ lab has created the
    Bertifier. See also this paper Behrisch et al. (2016) and the R
    package Hahsler et al. (2008).

    View Slide

  45. The Vistorian The Bertifier Conclusion Références
    TABLES AND MATRICES :
    Data with many 0/1 variables :
    Facilities indicators for 16 towns (A-P)
    Bertin (1977)

    View Slide

  46. The Vistorian The Bertifier Conclusion Références
    TABLES AND MATRICES

    View Slide

  47. The Vistorian The Bertifier Conclusion Références
    TABLES AND MATRICES
    Bertin (1977)

    View Slide

  48. The Vistorian The Bertifier Conclusion Références
    TABLES AND MATRICES
    Using Bertin (1977) principles, The AVIZ lab has created the
    Bertifier. See also the R package Hahsler et al. (2008).

    View Slide

  49. The Vistorian The Bertifier Conclusion Références
    ANOTHER NICE STORY TO READ ONLINE

    View Slide

  50. The Vistorian The Bertifier Conclusion Références
    BERTIN’S LEGACY IS GREAT
    These tools are quite unique : free, unique, online, simple,
    helpful, designed for dataviz/science beginners
    Check them out by yourselves...

    View Slide

  51. The Vistorian The Bertifier Conclusion Références
    THANK YOU M. BERTIN !

    View Slide

  52. The Vistorian The Bertifier Conclusion Références
    BOOKS AND REFERENCES
    See also his papers Bertin (1970), Bertin (1973), Bertin (1977),
    Bertin (1979), Bertin (1983), Bertin (1992), Bertin (2000), Bertin
    (2011) and tributes : Perin et al. (2018),...

    View Slide

  53. The Vistorian The Bertifier Conclusion Références
    REFERENCES I
    Bach, B., 
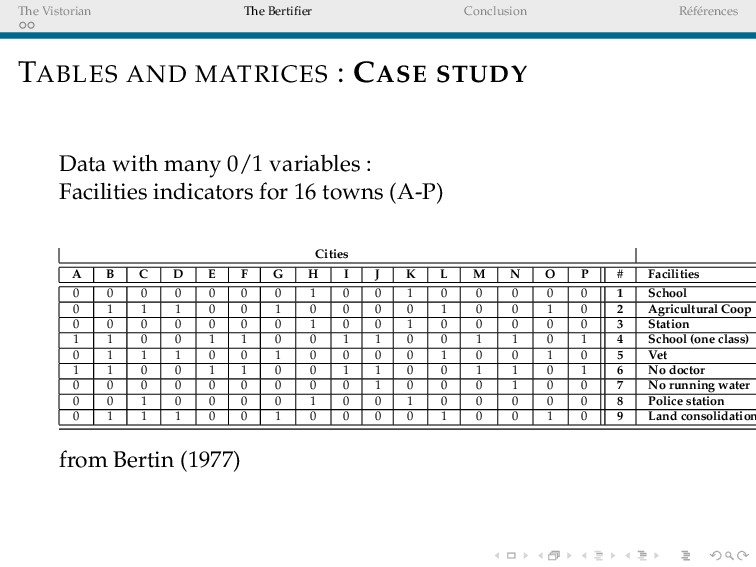
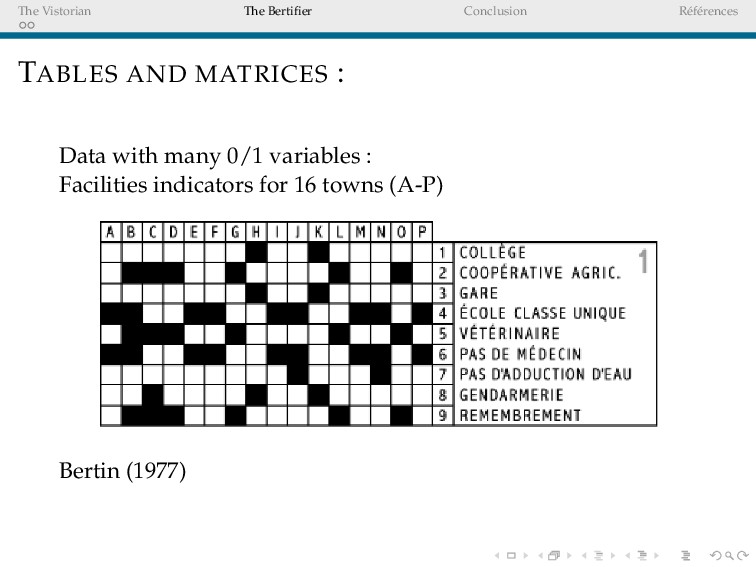
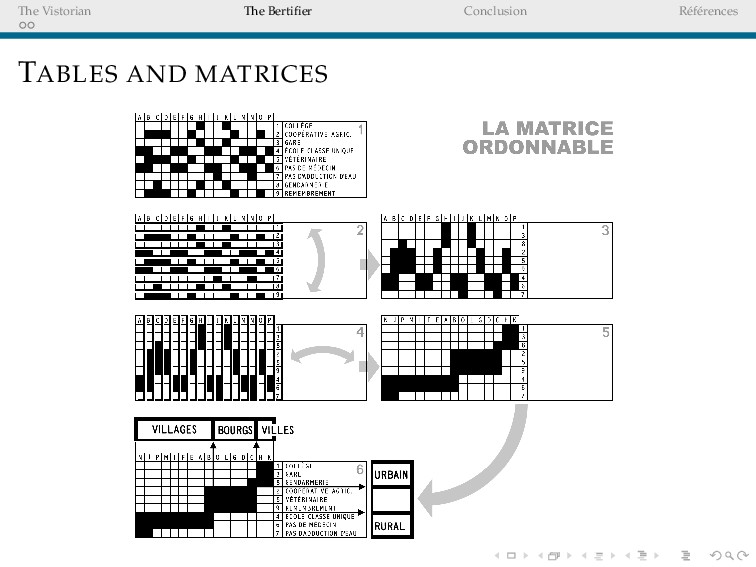
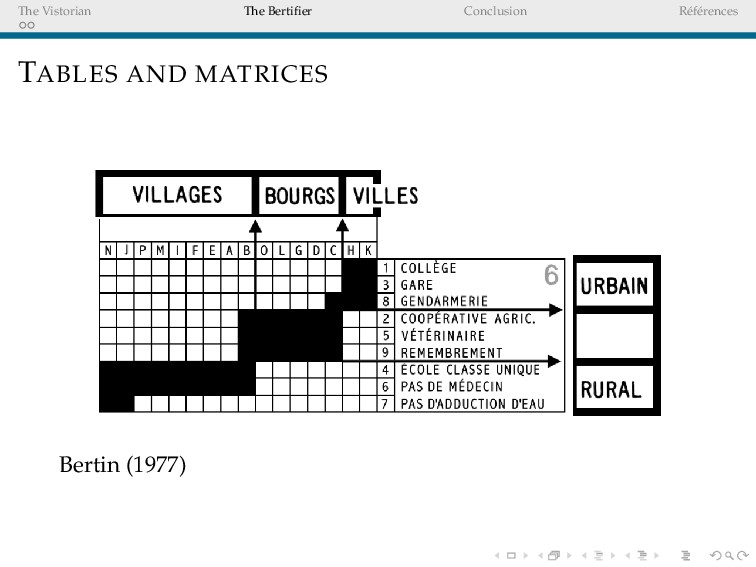
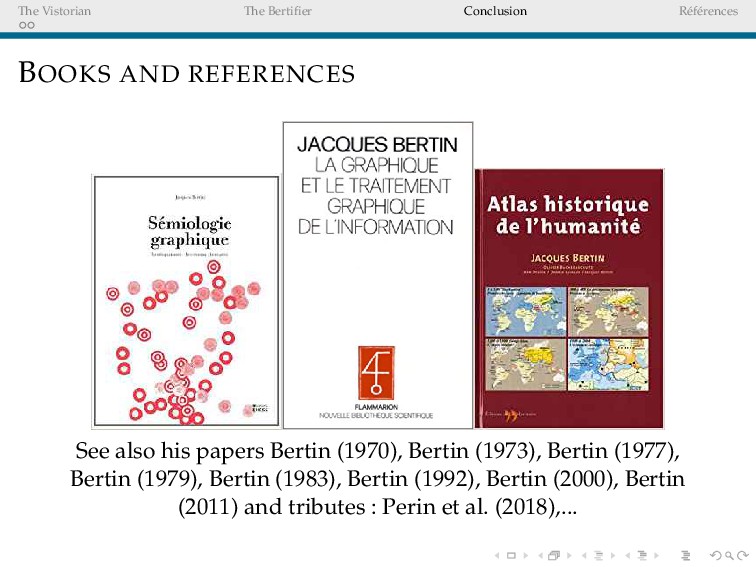
Henry Riche, N., Fernandez, R., Giannisakis, E., Lee, B., and Fekete,
    J.-D. (2015). NetworkCube : Bringing Dynamic Network Visualizations to
    Domain Scientists. Posters of the Conference on Information Visualization
    (InfoVis). Poster.
    Behrisch, M., Bach, B., Henry Riche, N., Schreck, T., and Fekete, J.-D. (2016).
    Matrix Reordering Methods for Table and Network Visualization.
    Computer Graphics Forum, 35 :24.
    Bertin, J. (1970). La graphique. Communications, 15(1).
    Bertin, J. (1973). Sémiologie graphique : Les diagrammes-les réseaux-les
    cartes.
    Bertin, J. (1977). La graphique et le traitement graphique de l’information. Number
    91 (084.21) BER. Flammarion-Paris.
    Bertin, J. (1979). Visual perception and cartographic transcription. World
    cartography, 15 :17–27.
    Bertin, J. (1983). Semiology of graphics, translation from sémilogie graphique
    (1977).

    View Slide

  54. The Vistorian The Bertifier Conclusion Références
    REFERENCES II
    Bertin, J. (1992). La Graphique et le traitement graphique de l’information.
    Flammarion.
    Bertin, J. (2000). Matrix theory ofgraphics. Information Design Journal,
    10(1) :5–19.
    Bertin, J. (2011). Graphics and graphic information processing. Walter de Gruyter.
    Hahsler, M., Hornik, K., and Buchta, C. (2008). Getting things in order : an
    introduction to the r package seriation. Journal of Statistical Software,
    25(3) :1–34.
    Molinero, V. S., Bach, B., Plaisant, C., Dufournaud, N., and Fekete, J.-D.
    (2017). Understanding the use of the vistorian : Complementing logs with
    context mini-questionnaires. In Visualization for the Digital Humanities.
    Perin, C., Fekete, J.-D., and Dragicevic, P. (2018). Jacques Bertin’s Legacy in
    Information Visualization and the Reorderable Matrix. Cartography and
    Geographic Information Science.

    View Slide