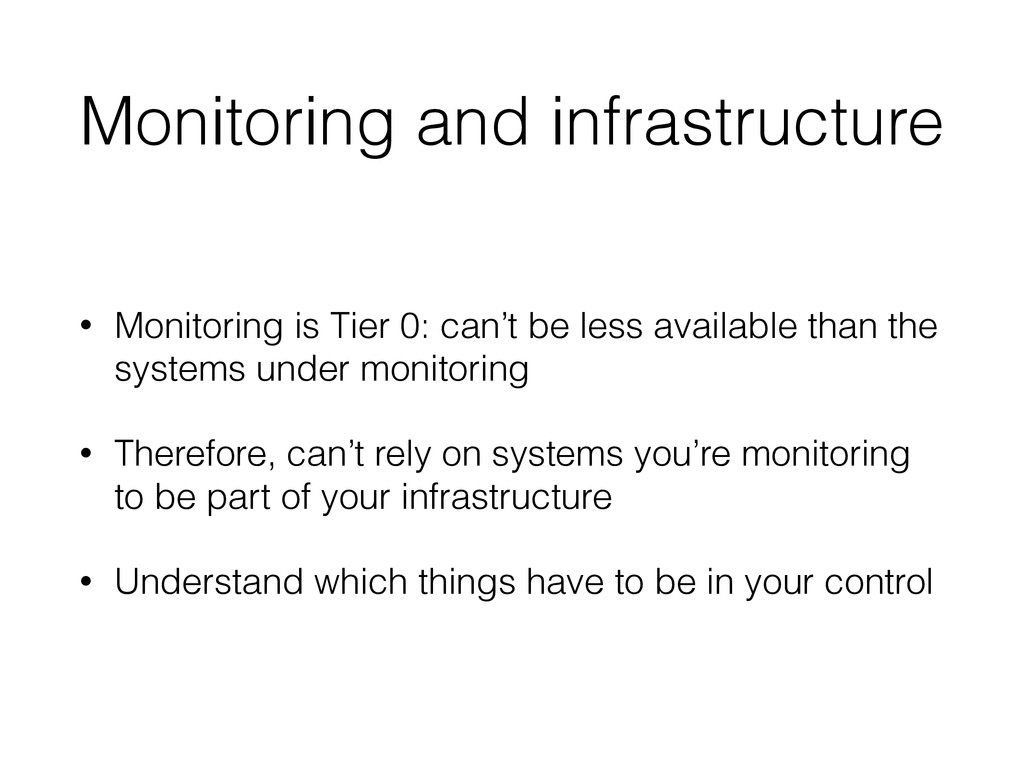
less available than the systems under monitoring • Therefore, can’t rely on systems you’re monitoring to be part of your infrastructure • Understand which things have to be in your control
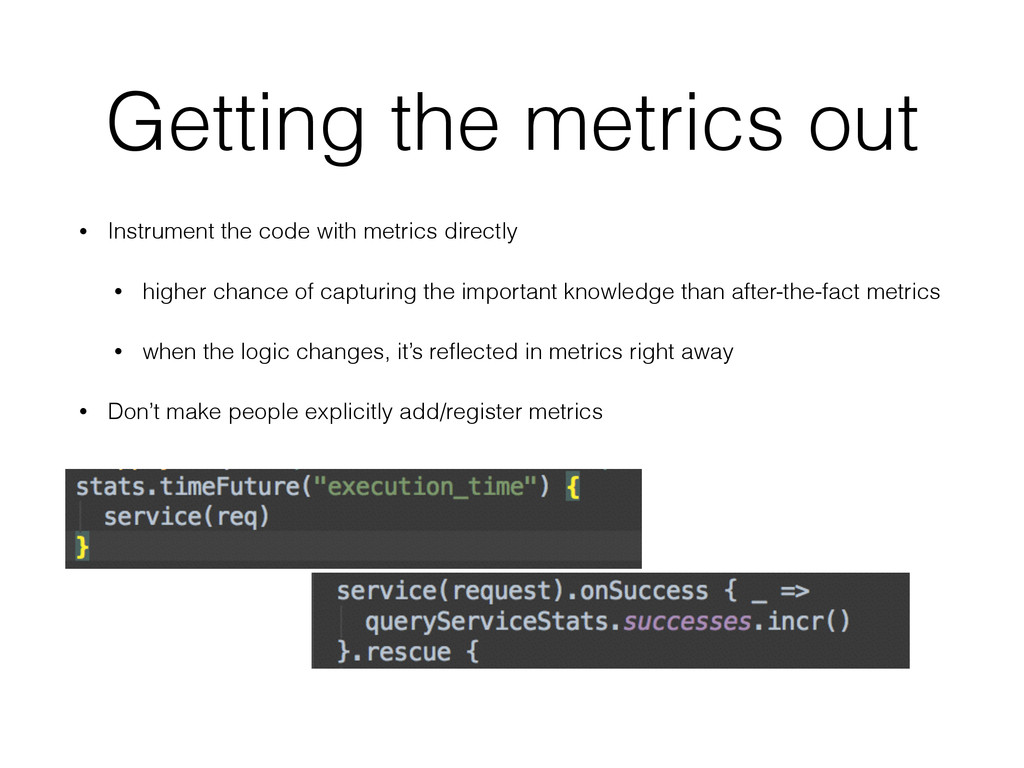
directly • higher chance of capturing the important knowledge than after-the-fact metrics • when the logic changes, it’s reflected in metrics right away • Don’t make people explicitly add/register metrics
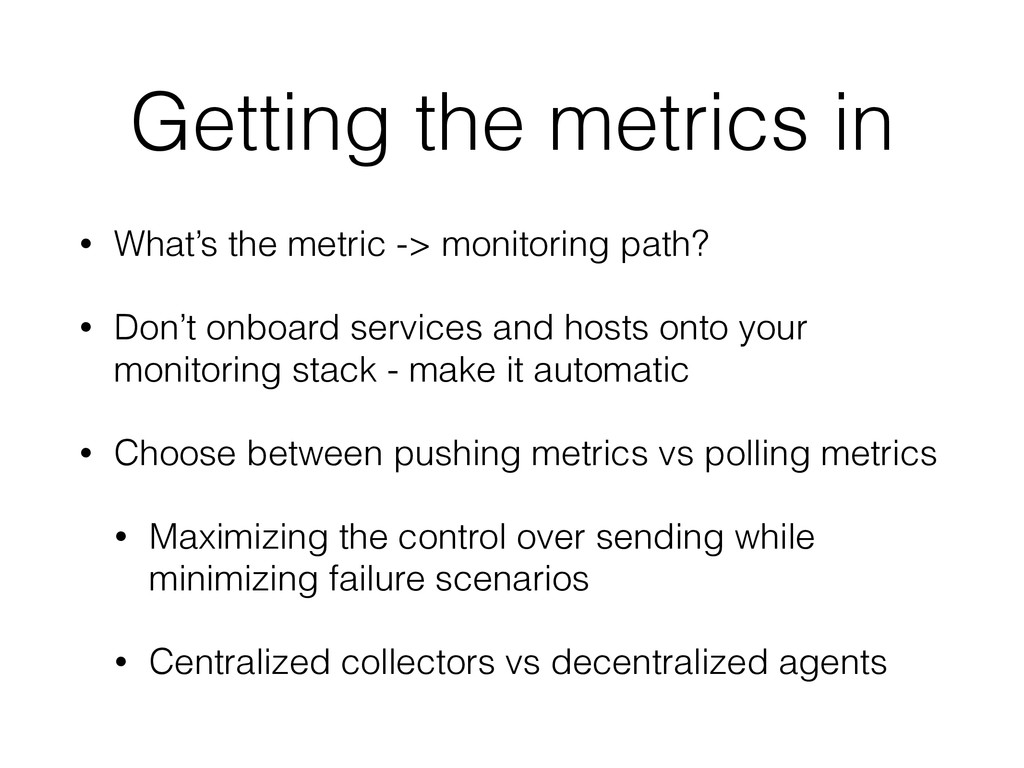
path? • Don’t onboard services and hosts onto your monitoring stack - make it automatic • Choose between pushing metrics vs polling metrics • Maximizing the control over sending while minimizing failure scenarios • Centralized collectors vs decentralized agents
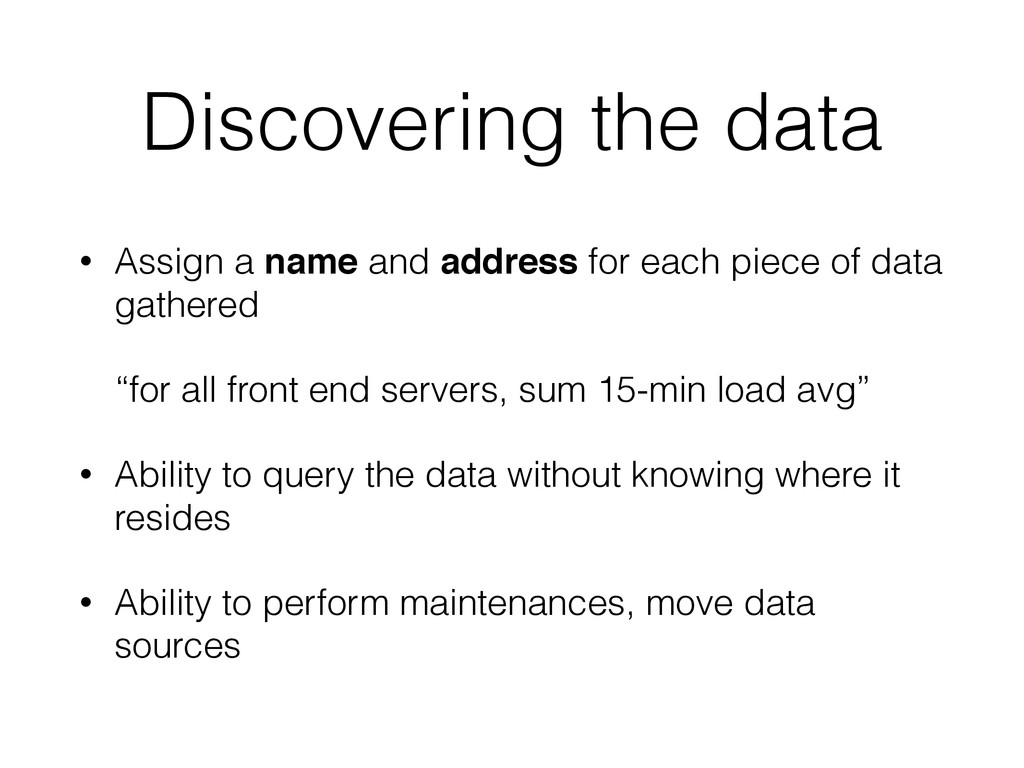
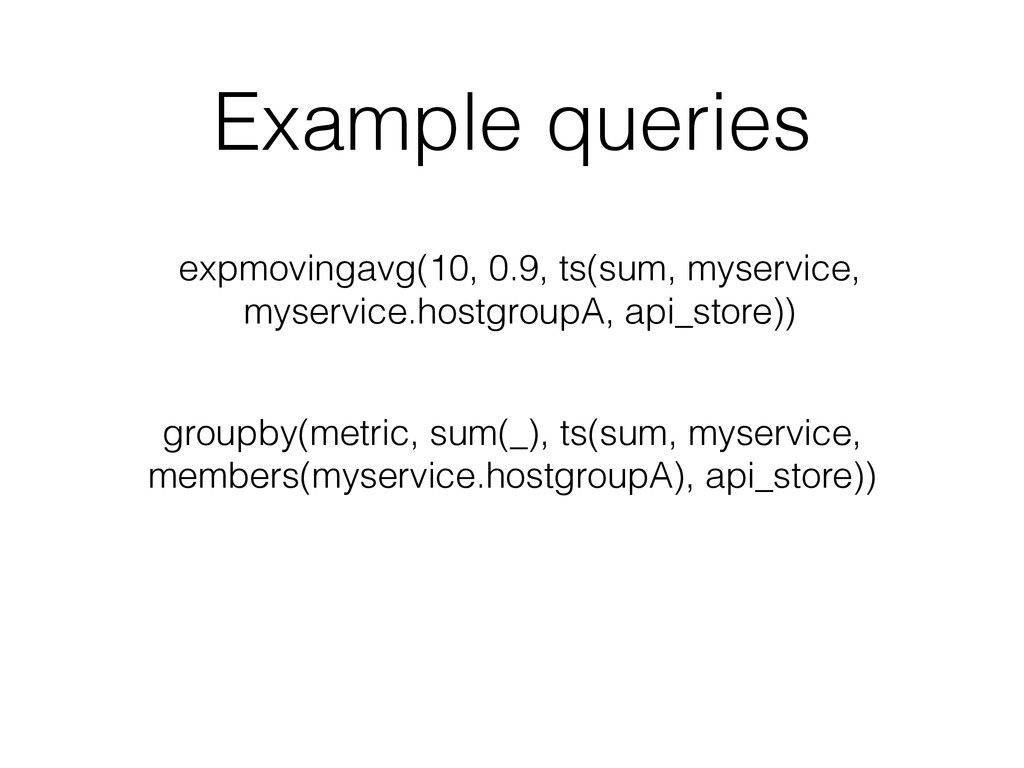
each piece of data gathered “for all front end servers, sum 15-min load avg” • Ability to query the data without knowing where it resides • Ability to perform maintenances, move data sources
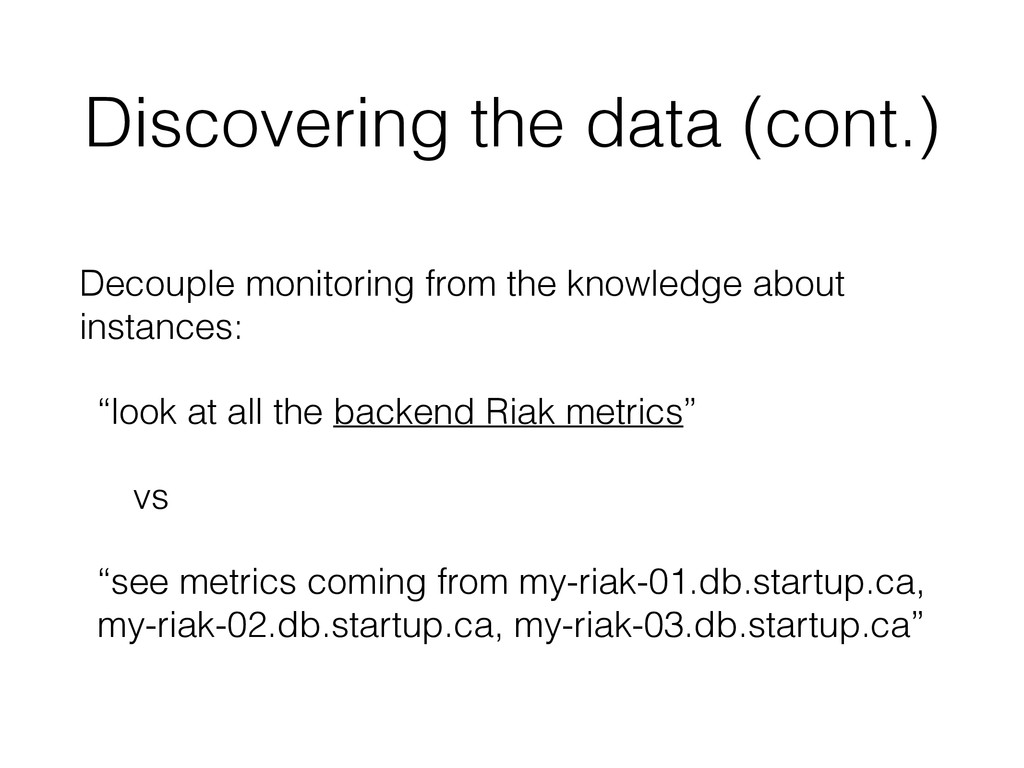
instances: “look at all the backend Riak metrics” vs “see metrics coming from my-riak-01.db.startup.ca, my-riak-02.db.startup.ca, my-riak-03.db.startup.ca”
Doesn’t have to go through the main monitoring path • can stream through WebSockets • can have high-frequency collection • High frequency != low latency • consider store -> batch -> forward
Protect against heavy reads: evaluate per-query costs, kill expensive queries, track hot requests • Protect against heavy writes: impose quotas, prioritize or drop
we’re heading now • Some metrics are more equal than others. If you know which ones that are more important, you can protect them better • At a certain size, you can’t put all of your metrics in one place. Have to isolate for reliability, then federate
the same SLA? Can some be answered in minutes and not seconds? • Can some writes be aggregated offline? Can they be approximated and then improved (e.g. Lambda Architecture model)
• In a metrics-driven organization, how does one discover metrics that matter the most? • In a service-oriented environment, who monitors your dependencies? Who gets paged?
each system separately • Filtering metrics, aggregating metrics on multiple levels adds to complexity • Attempt to consolidate the most important pieces of configuration early on
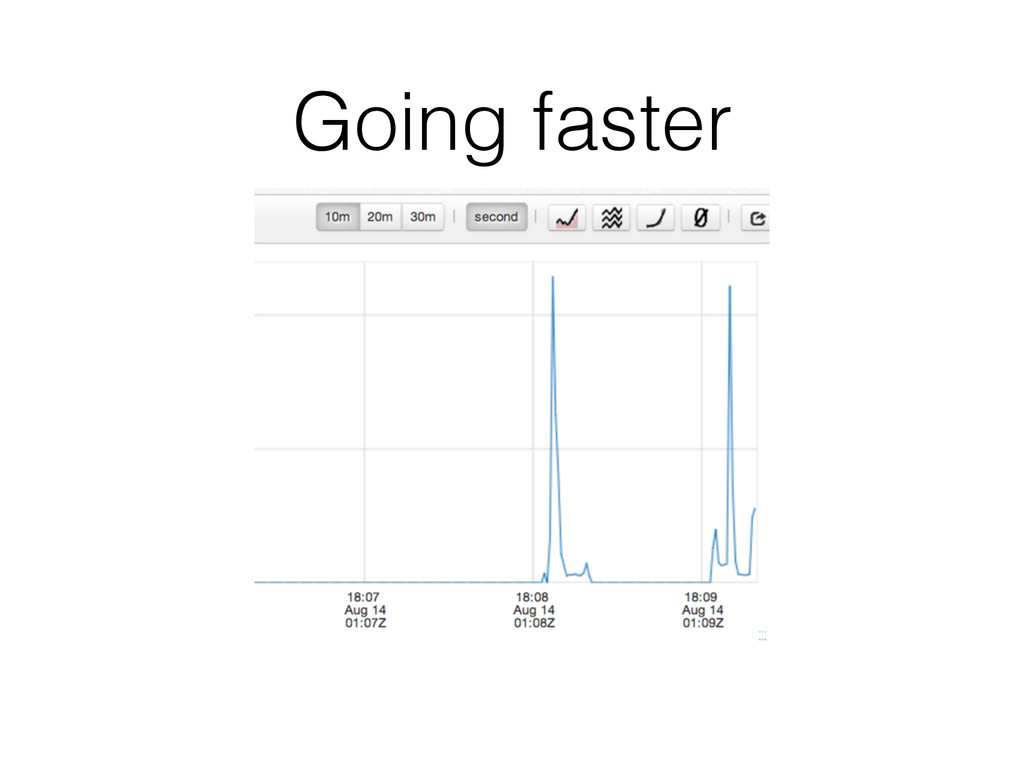
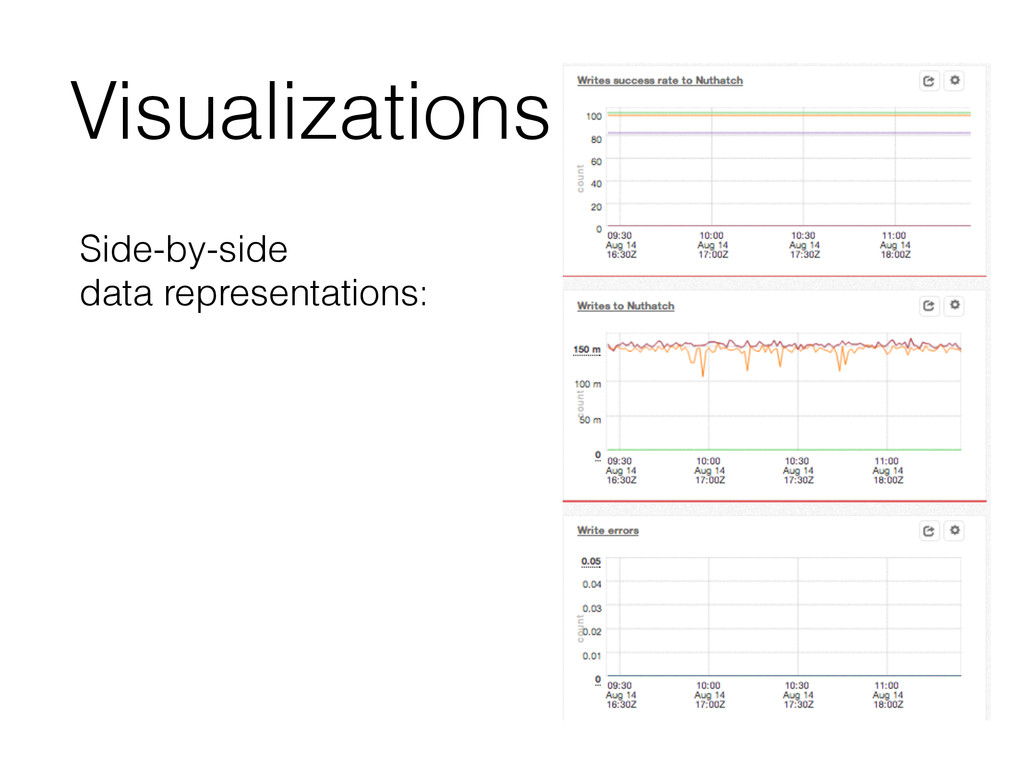
increase reliability of your company’s services • Visualize to reduce cognitive cost • Optimize for the shortest path to get to the data • Make an effort to get to high-frequency data