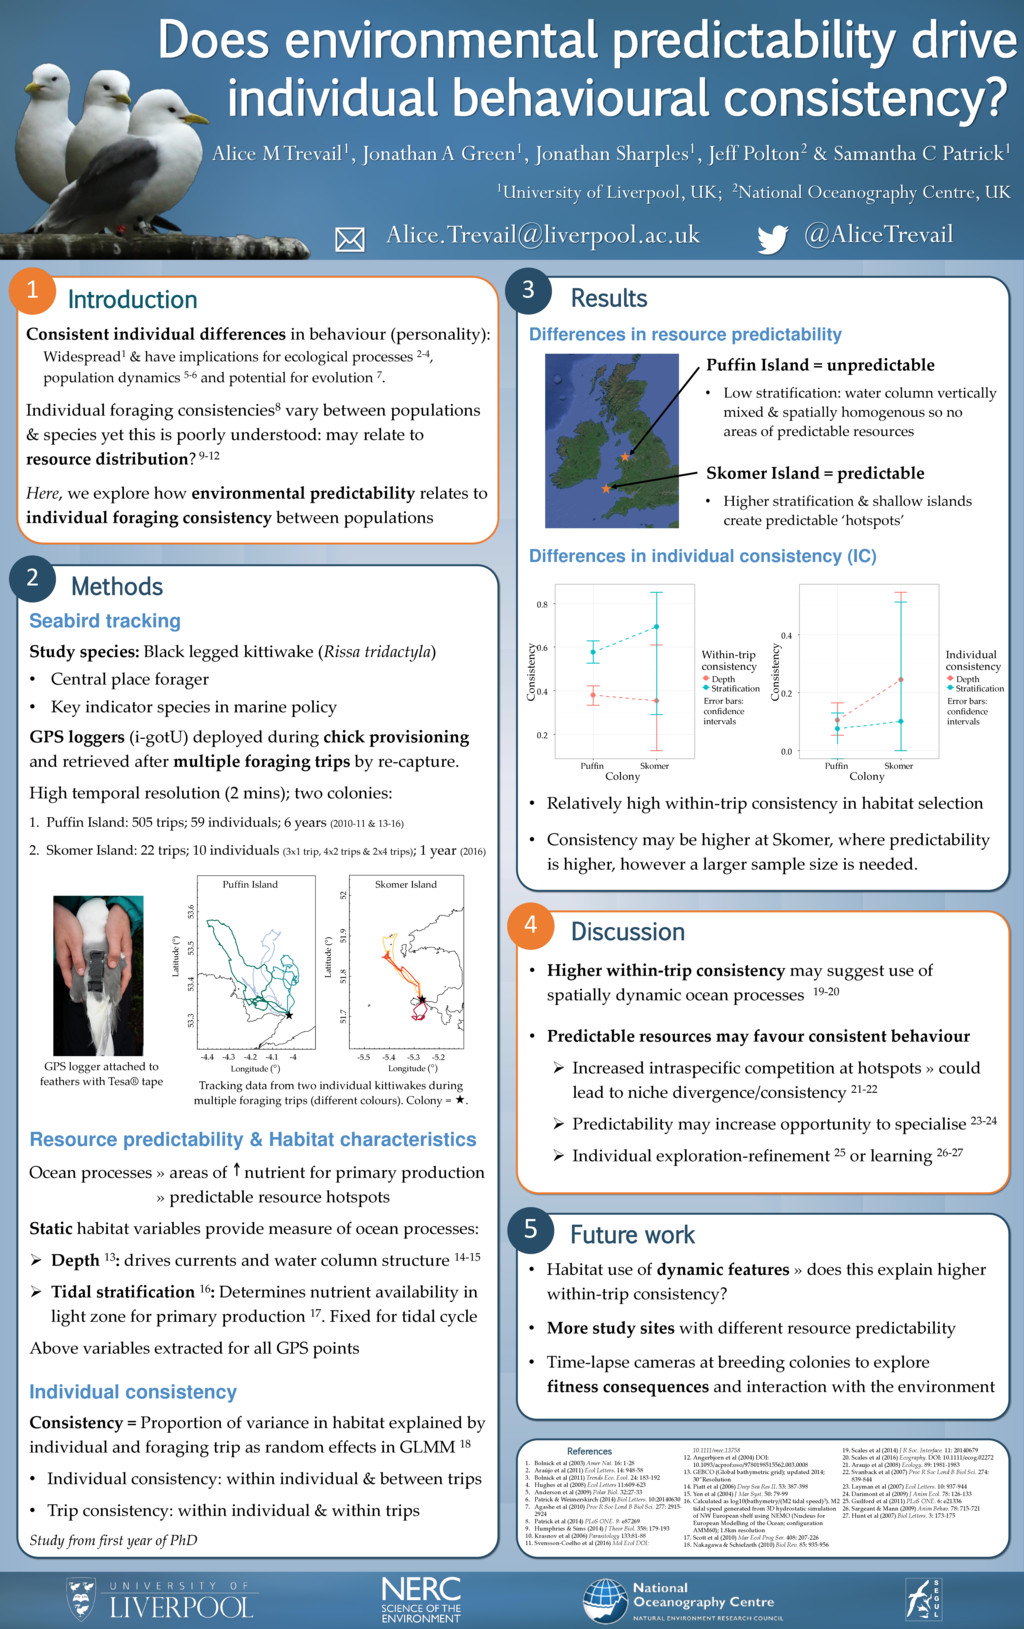
Low stratification: water column vertically mixed & spatially homogenous so no areas of predictable resources Skomer Island = predictable • Higher stratification & shallow islands create predictable ‘hotspots’ Differences in individual consistency (IC) • Relatively high within-trip consistency in habitat selection • Consistency may be higher at Skomer, where predictability is higher, however a larger sample size is needed. 3 Does environmental predictability drive individual behavioural consistency? Alice M Trevail1, Jonathan A Green1, Jonathan Sharples1, Jeff Polton2 & Samantha C Patrick1 1University of Liverpool, UK; 2National Oceanography Centre, UK [email protected] @AliceTrevail Methods Seabird tracking Study species: Black legged kittiwake (Rissa tridactyla) • Central place forager • Key indicator species in marine policy GPS loggers (i-gotU) deployed during chick provisioning and retrieved after multiple foraging trips by re-capture. High temporal resolution (2 mins); two colonies: 1. Puffin Island: 505 trips; 59 individuals; 6 years (2010-11 & 13-16) 2. Skomer Island: 22 trips; 10 individuals (3x1 trip, 4x2 trips & 2x4 trips); 1 year (2016) Resource predictability & Habitat characteristics Ocean processes » areas of nutrient for primary production » predictable resource hotspots Static habitat variables provide measure of ocean processes: Depth 13: drives currents and water column structure 14-15 Tidal stratification 16: Determines nutrient availability in light zone for primary production 17. Fixed for tidal cycle Above variables extracted for all GPS points Individual consistency Consistency = Proportion of variance in habitat explained by individual and foraging trip as random effects in GLMM 18 • Individual consistency: within individual & between trips • Trip consistency: within individual & within trips Study from first year of PhD 2 Future work • Habitat use of dynamic features » does this explain higher within-trip consistency? • More study sites with different resource predictability • Time-lapse cameras at breeding colonies to explore fitness consequences and interaction with the environment References 1. Bolnick et al (2003) Amer Nat. 16: 1-28 2. Araújo et al (2011) Ecol Letters. 14: 948-58 3. Bolnick et al (2011) Trends Eco. Evol. 24: 183-192 4. Hughes et al (2008) Ecol Letters 11:609-623 5. Anderson et al (2009) Polar Biol. 32:27-33 6. Patrick & Weimerskirch (2014) Biol Letters. 10:20140630 7. Agashe et al (2010) Proc R Soc Lond B Biol Sci. 277: 2915- 2924 8. Patrick et al (2014) PLoS ONE. 9: e87269 9. Humphries & Sims (2014) J Theor Biol. 358: 179-193 10. Krasnov et al (2006) Parasitology 133:81-88 11. Svensson-Coelho et al (2016) Mol Ecol DOI: 10.1111/mec.13758 12. Angerbjorn et al (2004) DOI: 10.1093/acprof:oso/9780198515562.003.0008 13. GEBCO (Global bathymetric grid); updated 2014; 30”Resolution 14. Piatt et al (2006) Deep Sea Res II. 53: 387-398 15. Yen et al (2004) J Mar Syst. 50: 79-99 16. Calculated as log10(bathymetry/(M2 tidal speed)3). M2 tidal speed generated from 3D hydrostatic simulation of NW European shelf using NEMO (Nucleus for European Modelling of the Ocean; configuration AMM60); 1.8km resolution 17. Scott et al (2010) Mar Ecol Prog Ser. 408: 207-226 18. Nakagawa & Schielzeth (2010) Biol Rev. 85: 935-956 19. Scales et al (2014) J R Soc. Interface. 11: 20140679 20. Scales et al (2016) Ecography. DOI: 10.1111/ecog.02272 21. Araujo et al (2008) Ecology. 89: 1981-1983 22. Svanback et al (2007) Proc R Soc Lond B Biol Sci. 274: 839-844 23. Layman et al (2007) Ecol Letters. 10: 937-944 24. Darimont et al (2009) J Anim Ecol. 78: 126-133 25. Guilford et al (2011) PLoS ONE. 6: e21336 26. Sargeant & Mann (2009) Anim Behav. 78: 715-721 27. Hunt et al (2007) Biol Letters. 3: 173-175 Discussion • Higher within-trip consistency may suggest use of spatially dynamic ocean processes 19-20 • Predictable resources may favour consistent behaviour Increased intraspecific competition at hotspots » could lead to niche divergence/consistency 21-22 Predictability may increase opportunity to specialise 23-24 Individual exploration-refinement 25 or learning 26-27 4 5 Tracking data from two individual kittiwakes during multiple foraging trips (different colours). Colony = . GPS logger attached to feathers with Tesa® tape -5.5 -5.4 -5.3 -5.2 51.7 51.8 51.9 52 Longitude (°) Latitude (°) Skomer Island -4.4 -4.3 -4.2 -4.1 -4 53.3 53.4 53.5 53.6 Longitude (°) Latitude (°) Puffin Island Introduction Consistent individual differences in behaviour (personality): Widespread1 & have implications for ecological processes 2-4, population dynamics 5-6 and potential for evolution 7. Individual foraging consistencies8 vary between populations & species yet this is poorly understood: may relate to resource distribution? 9-12 Here, we explore how environmental predictability relates to individual foraging consistency between populations 1 0.0 0.2 0.4 Puffin Skomer Colony Consistency Individual consistency Depth Stratification 0.2 0.4 0.6 0.8 Puffin Skomer Colony Consistency Within-trip consistency Depth Stratification Error bars: confidence intervals Error bars: confidence intervals