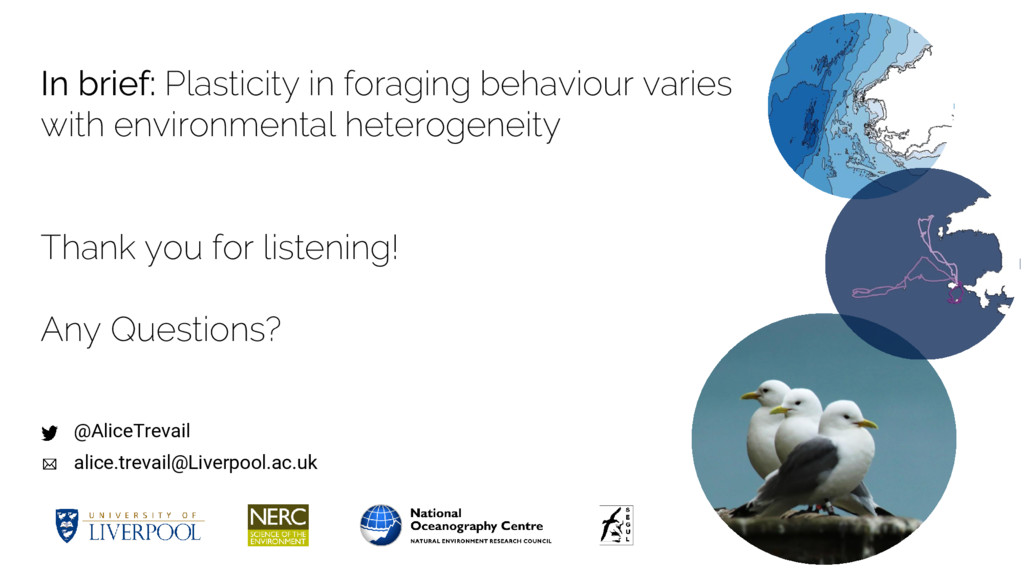
Talk at the Easter conference of the Association for the Study of Animal Behaviour, Liverpool, April 2017. Here we show that plasticity in behaviour varies with environmental heterogeneity.
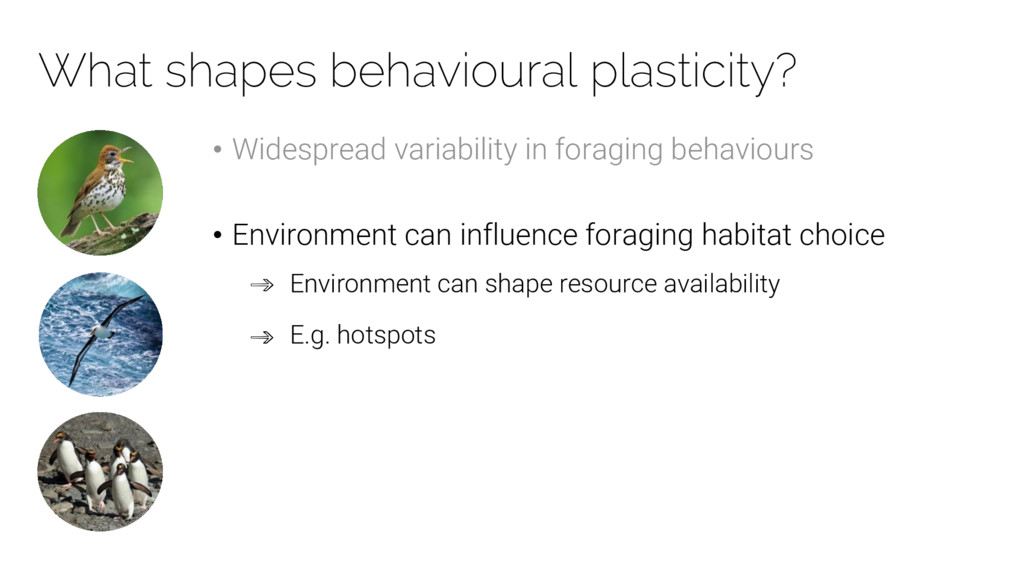
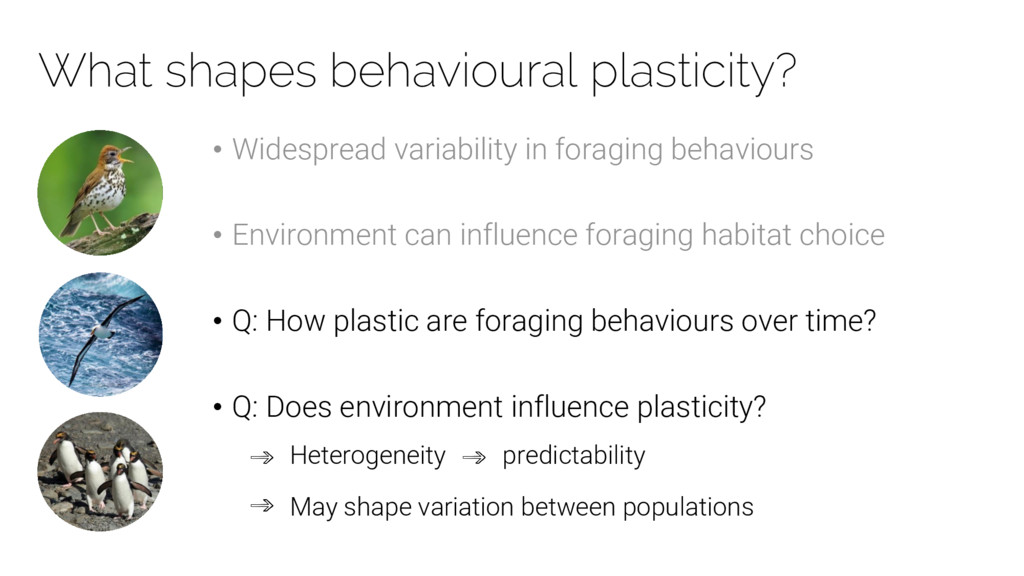
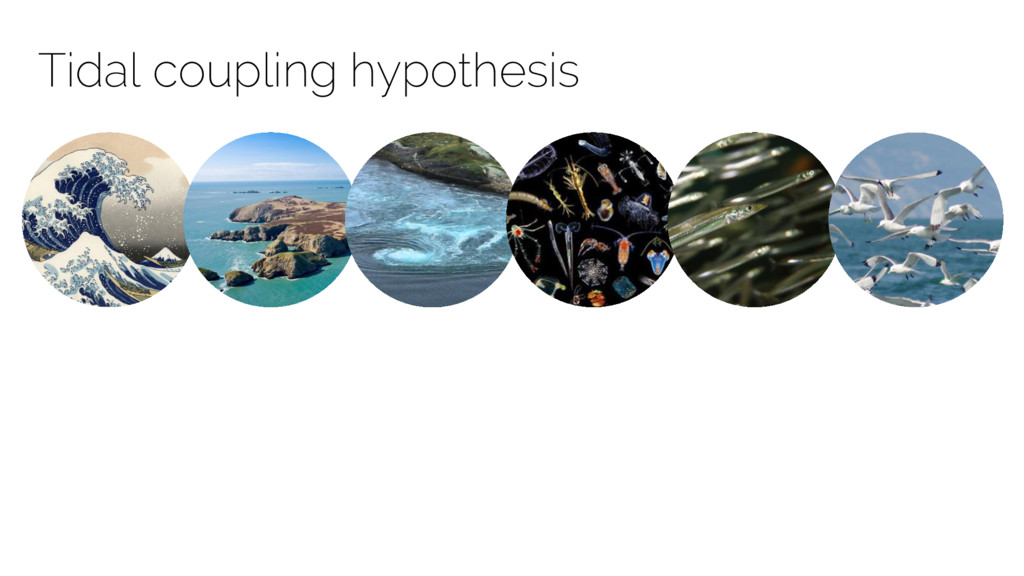
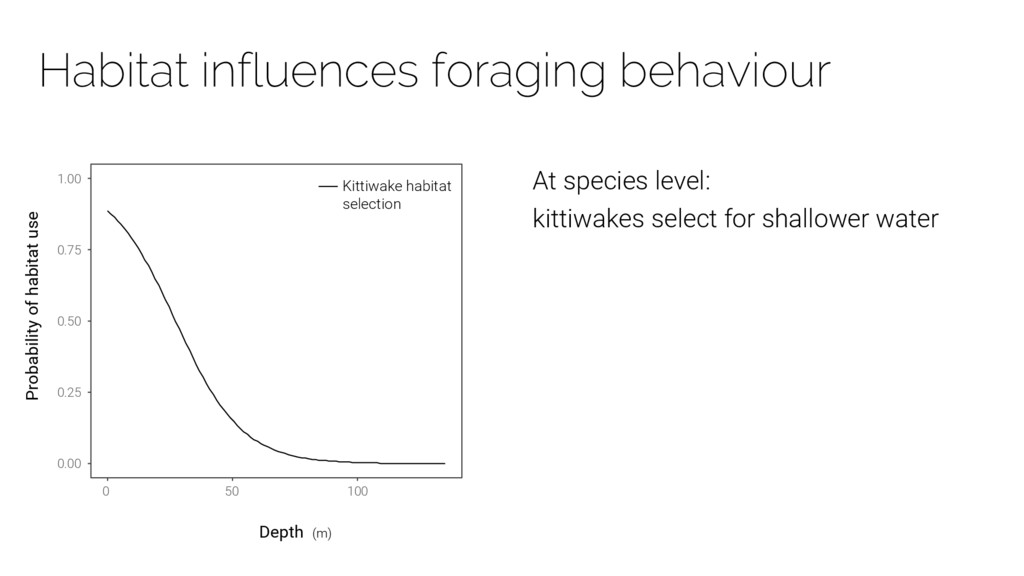
• Environment can influence foraging habitat choice Environment can shape resource availability E.g. hotspots Ed Schneider Liam Quinn Antarctica.gov.au
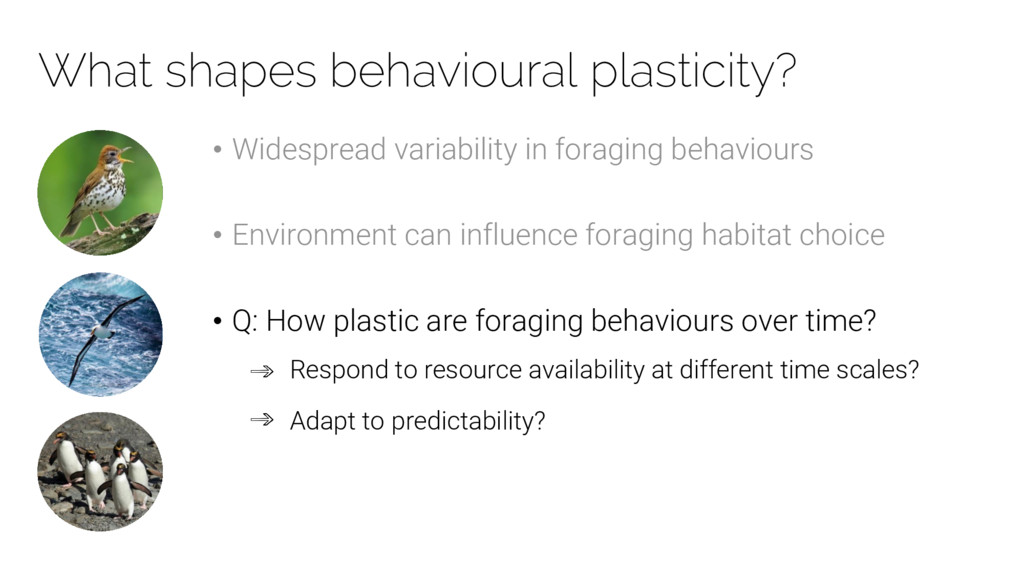
• Environment can influence foraging habitat choice • Q: How plastic are foraging behaviours over time? Respond to resource availability at different time scales? Adapt to predictability? Ed Schneider Liam Quinn Antarctica.gov.au
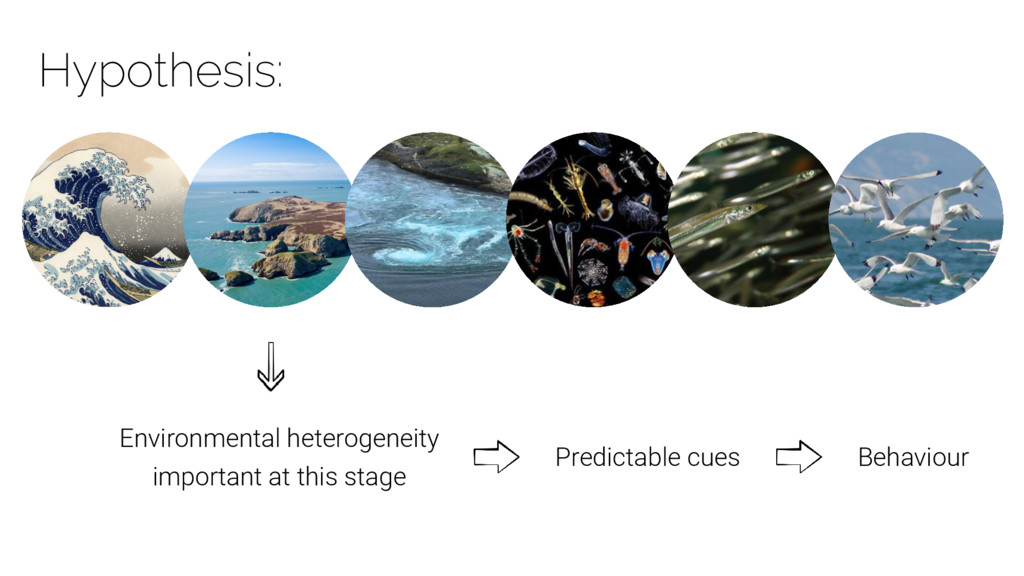
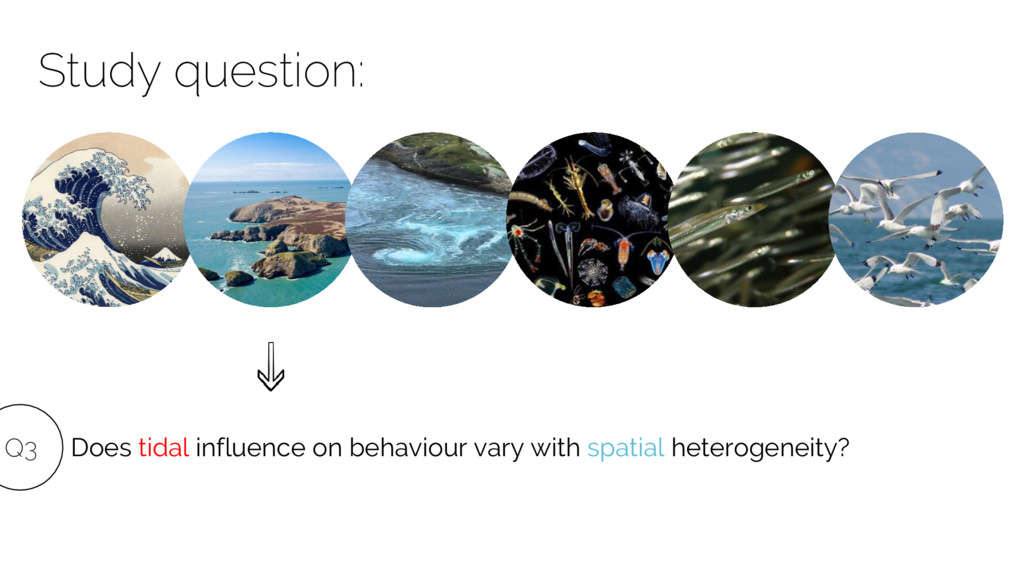
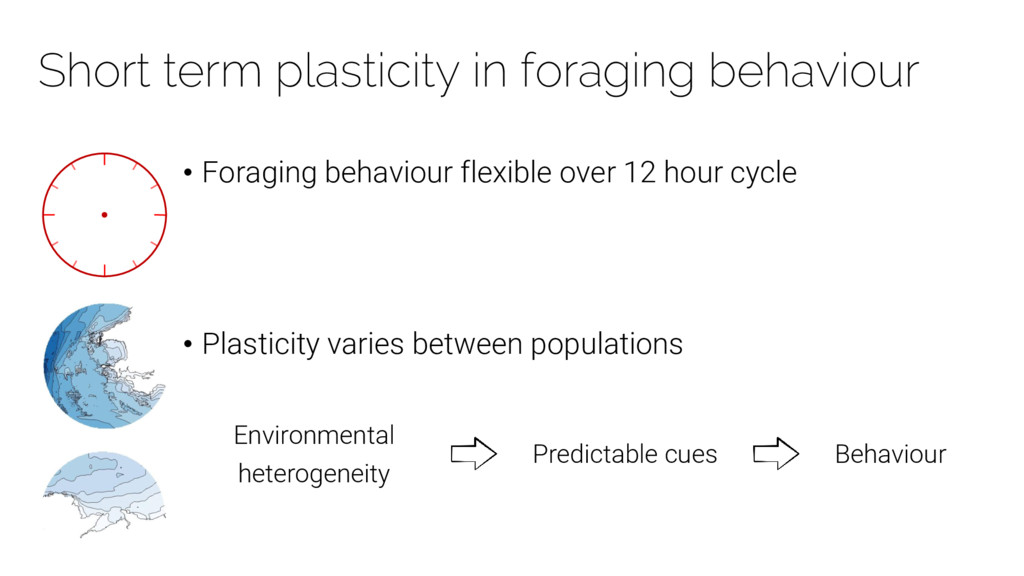
• Environment can influence foraging habitat choice • Q: How plastic are foraging behaviours over time? • Q: Does environment influence plasticity? Heterogeneity predictability May shape variation between populations Ed Schneider Liam Quinn Antarctica.gov.au
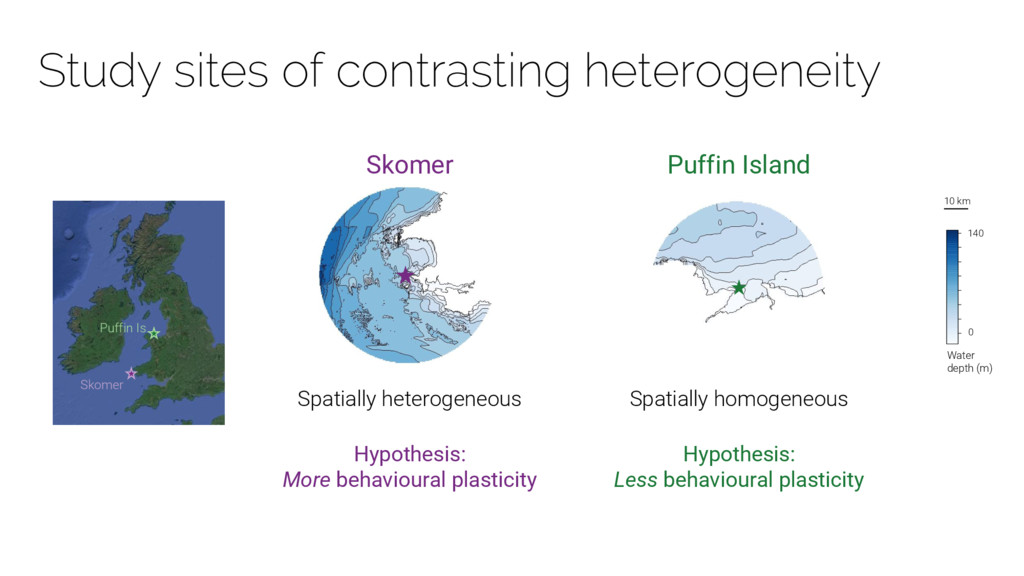
behavioural plasticity Spatially homogeneous Hypothesis: Less behavioural plasticity Bathymetry Longitude Latitude 51.4 N 51.6 N 51.8 N 52 N 52.2 N 52.4 N 6 W 5.5 W 5 W 4.5 W 0 20 40 60 80 100 120 140 Water depth (m) 140 0 10 km Study sites of contrasting heterogeneity
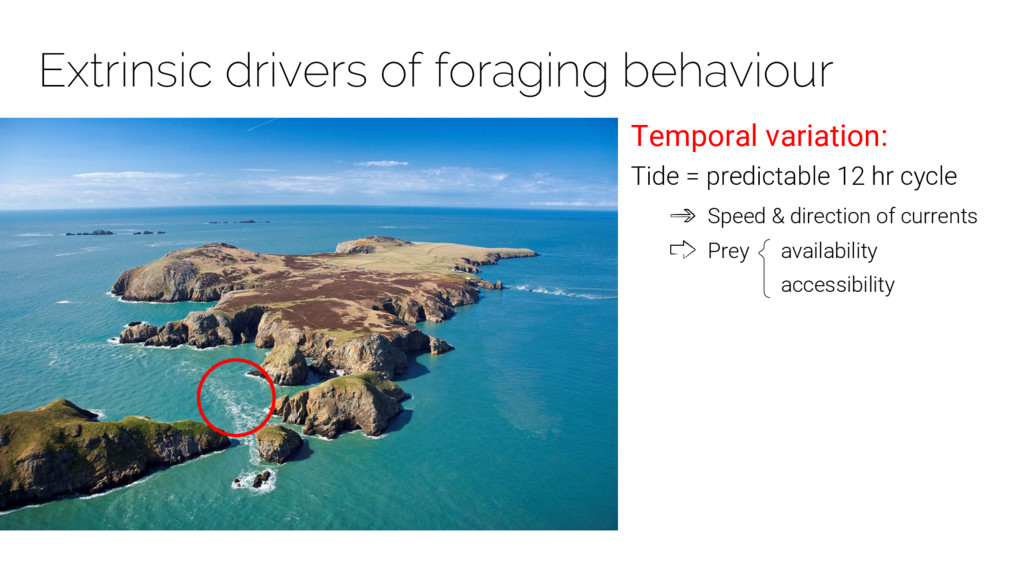
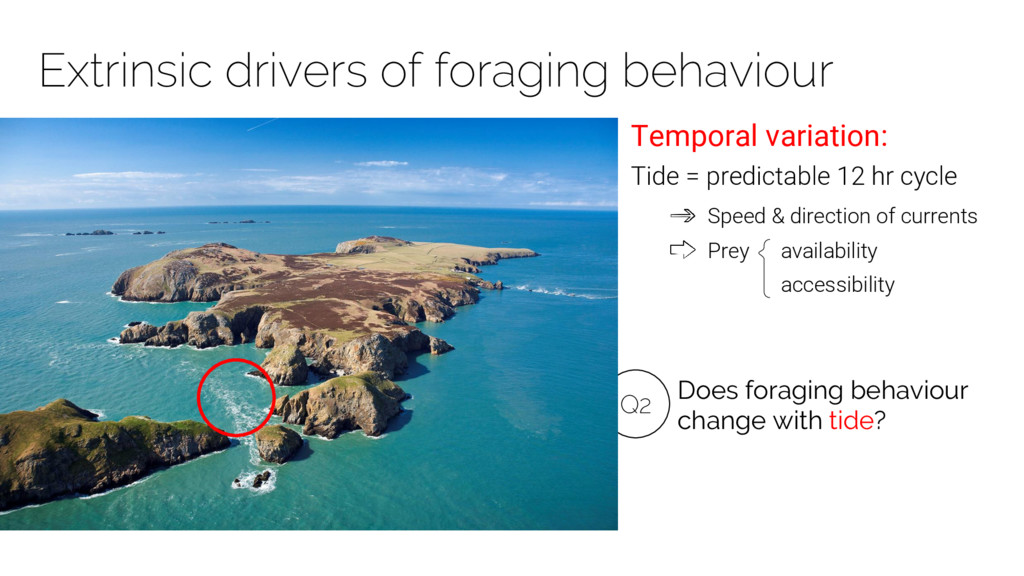
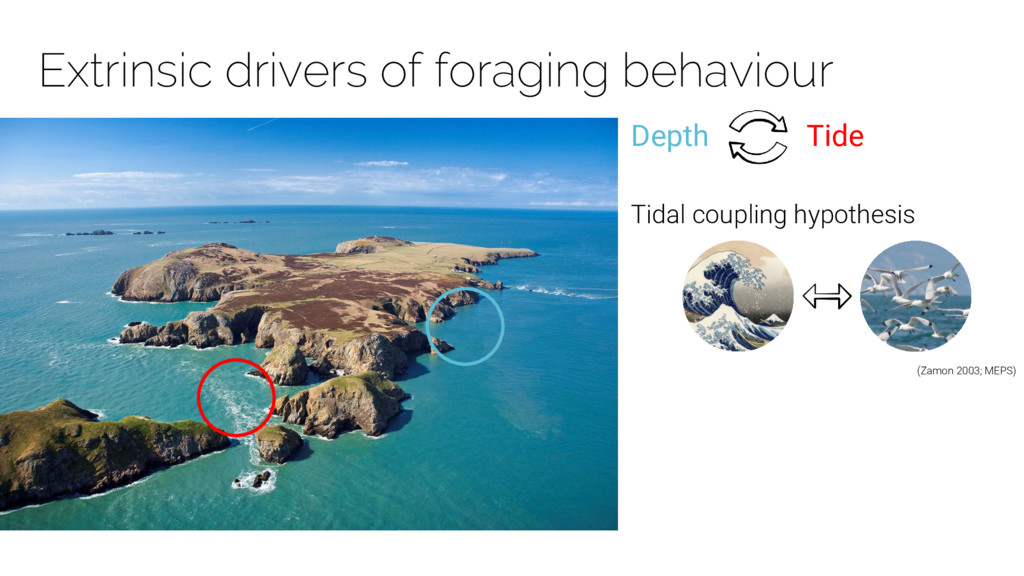
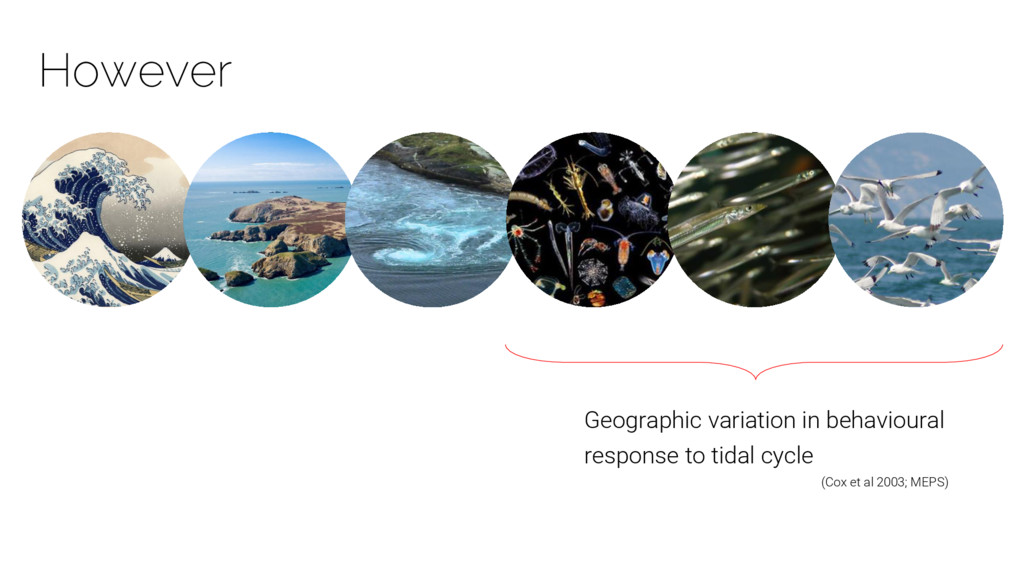
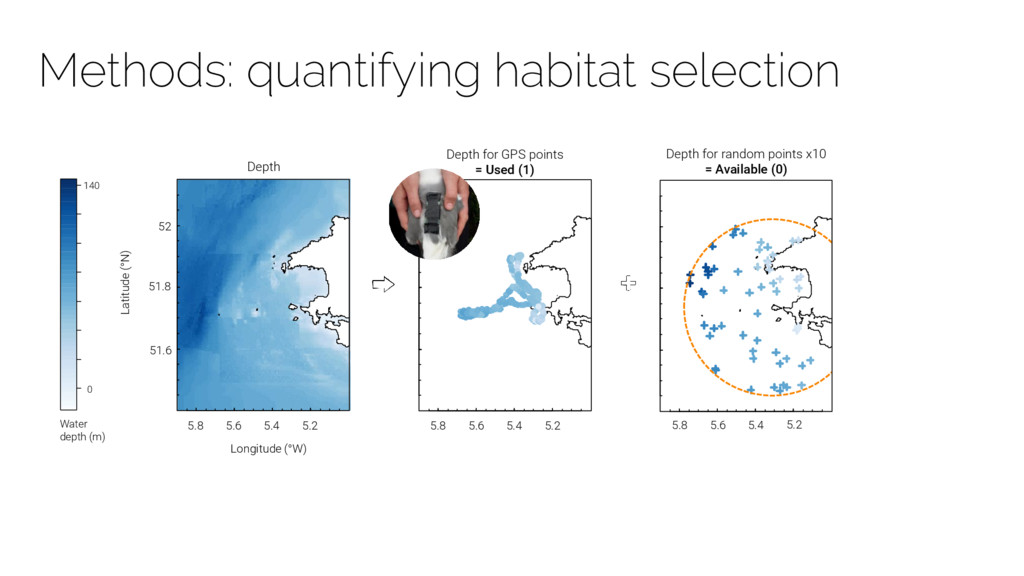
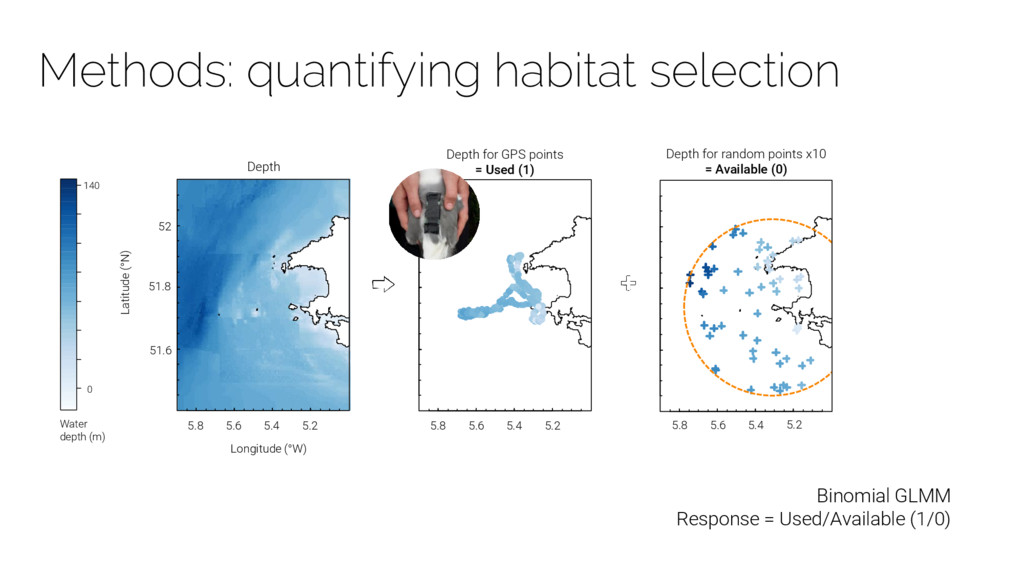
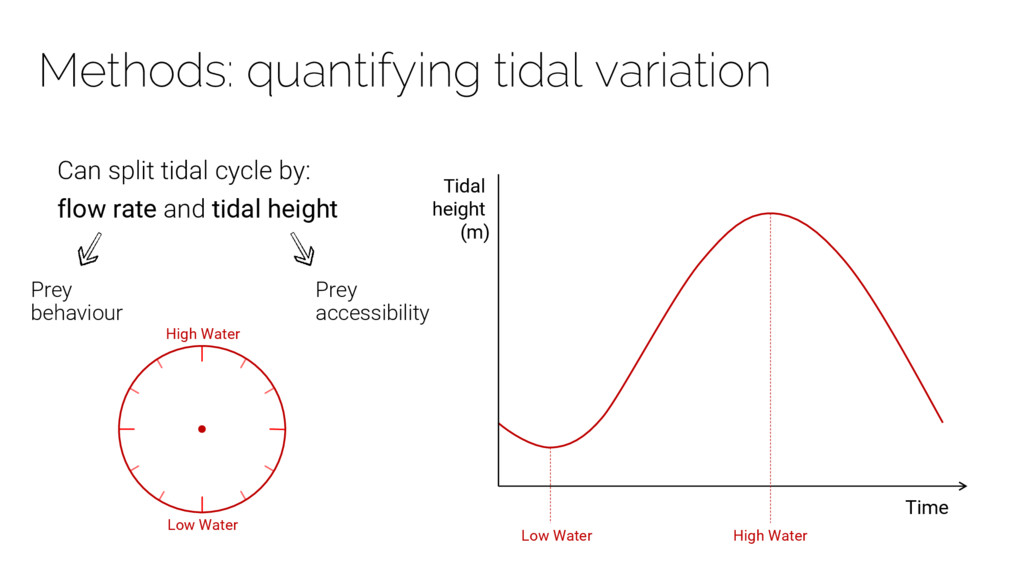
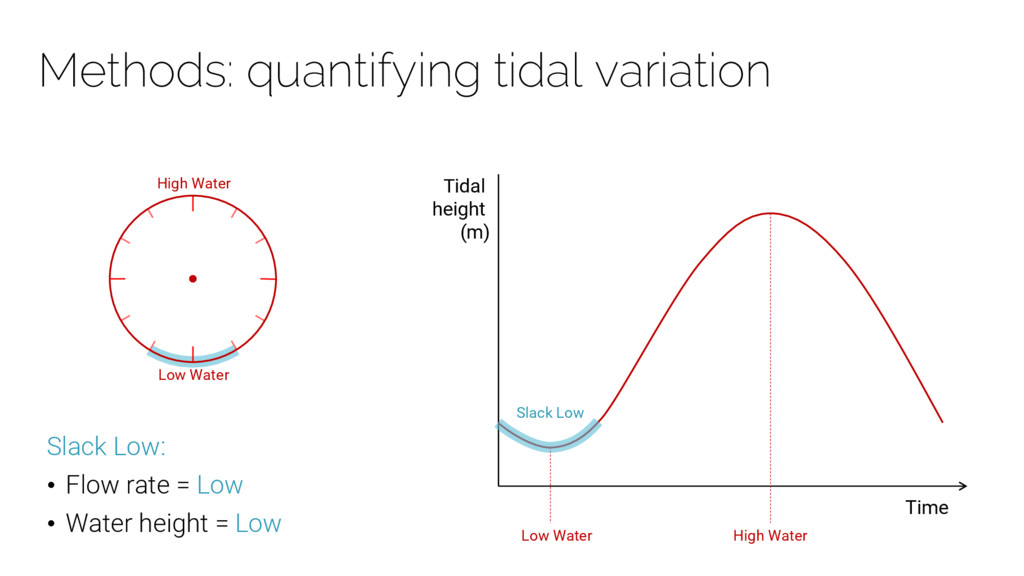
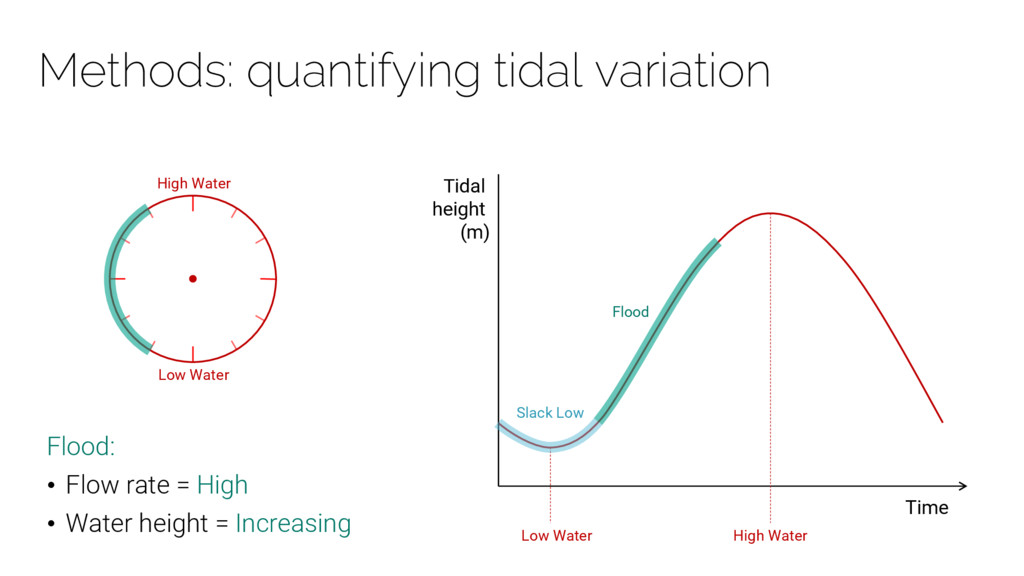
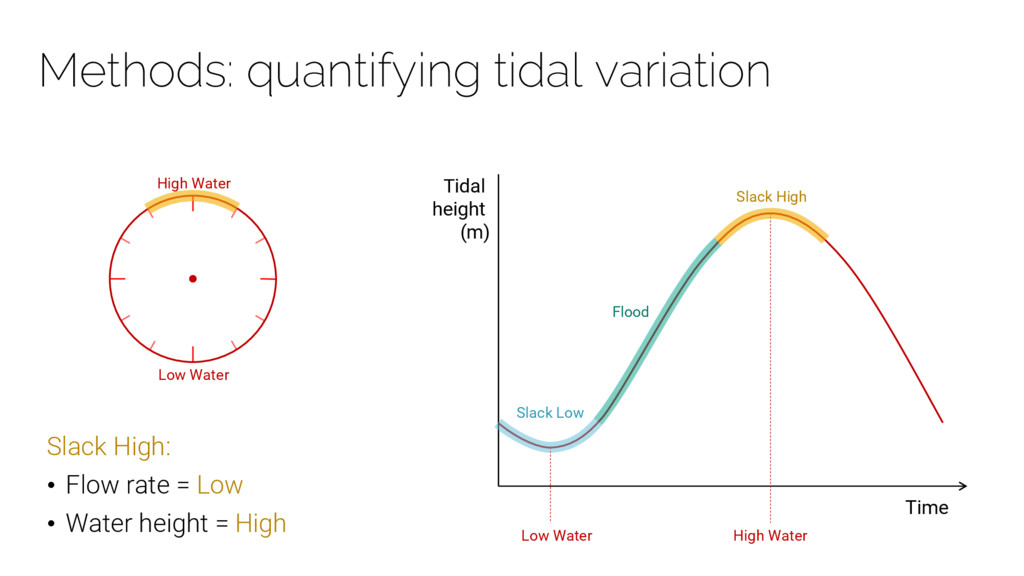
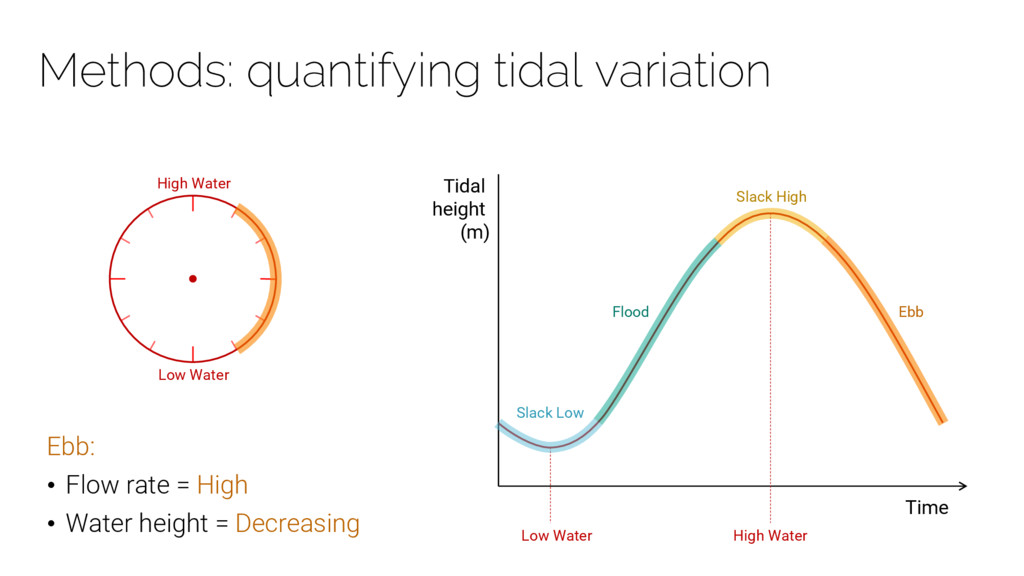
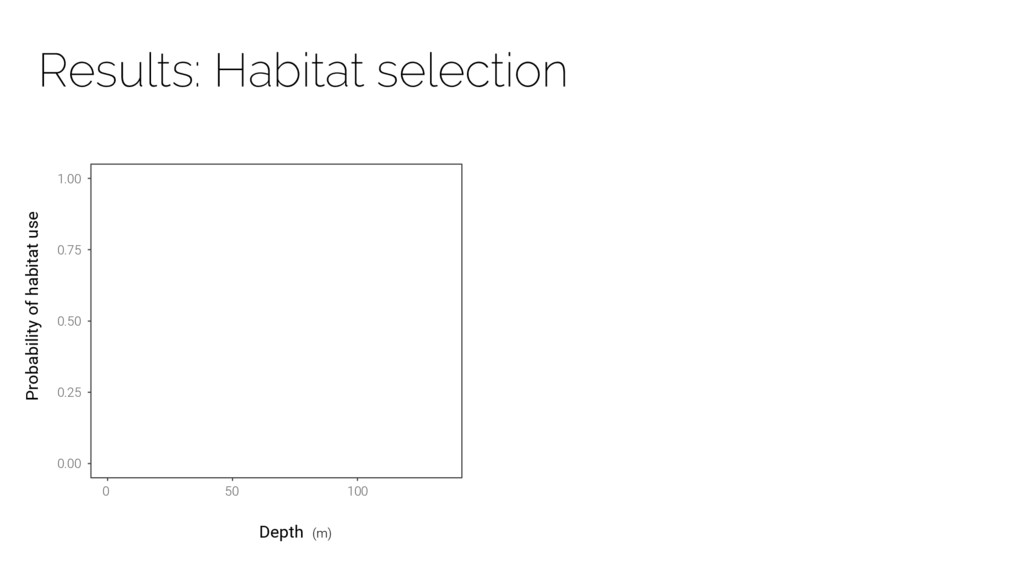
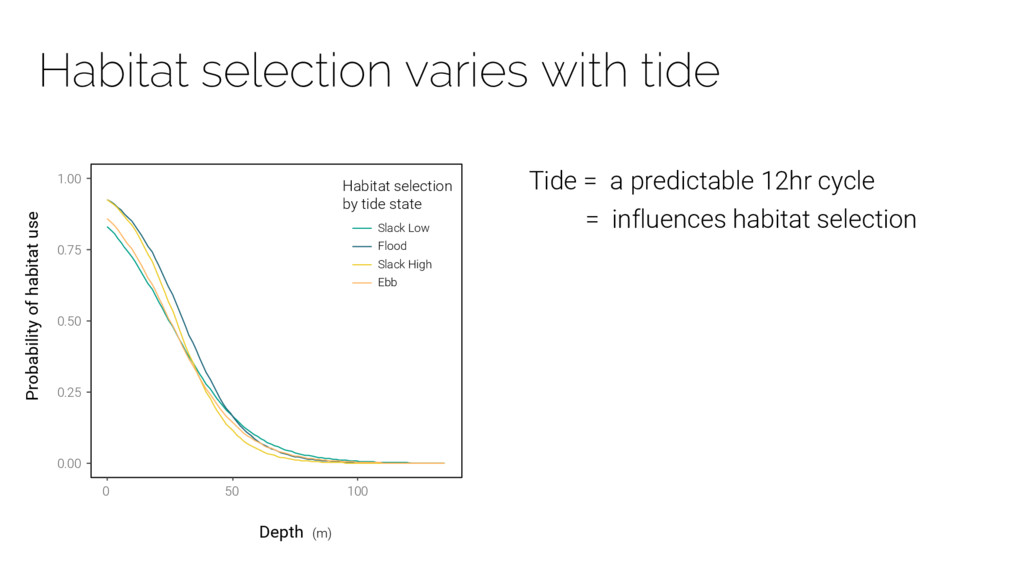
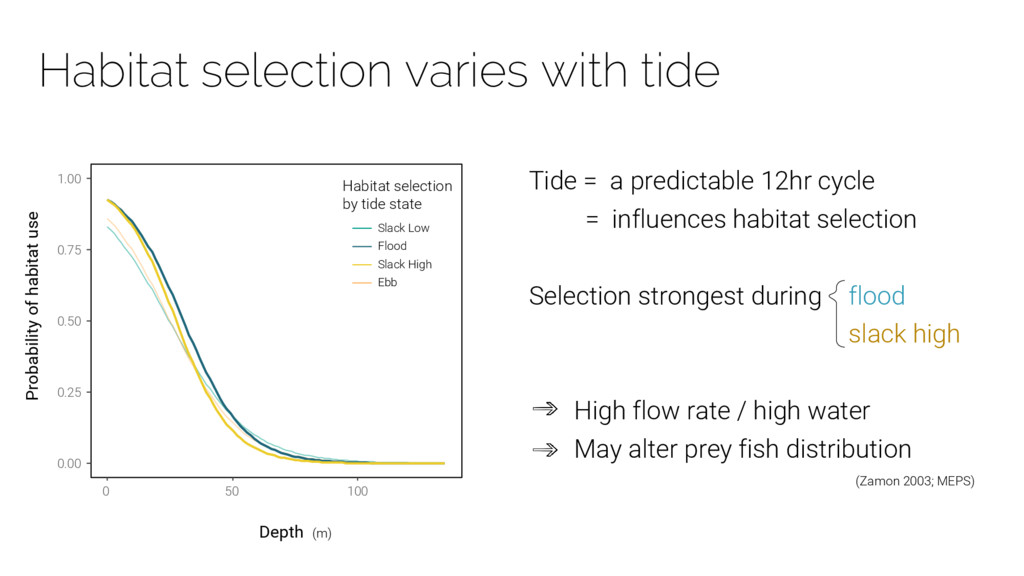
use Tide = a predictable 12hr cycle = influences habitat selection Selection strongest during flood slack high High flow rate / high water May alter prey fish distribution (Zamon 2003; MEPS) Habitat selection by tide state Slack Low Flood Slack High Ebb 0.00 0.25 0.50 0.75 1.00 0 50 100
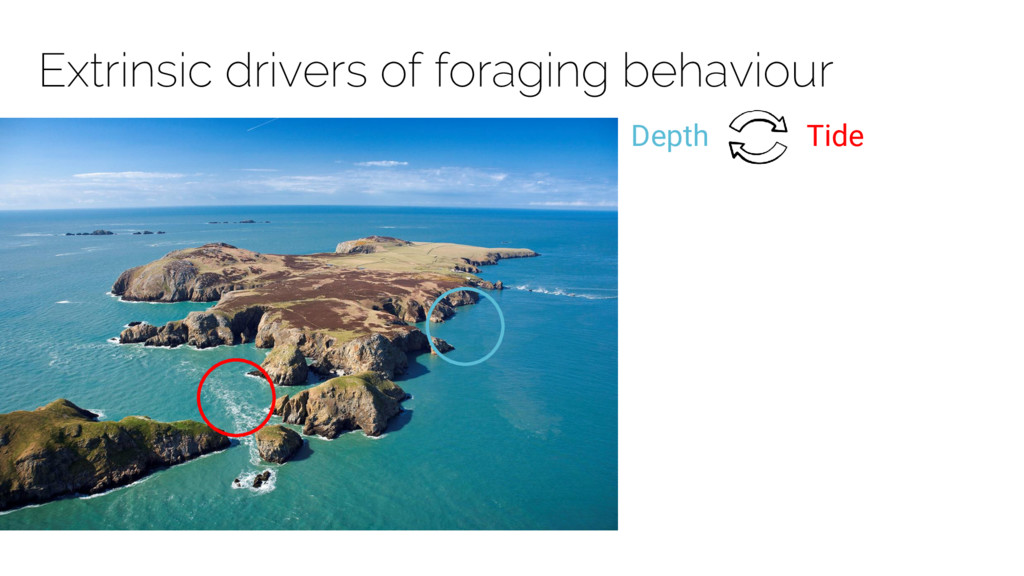
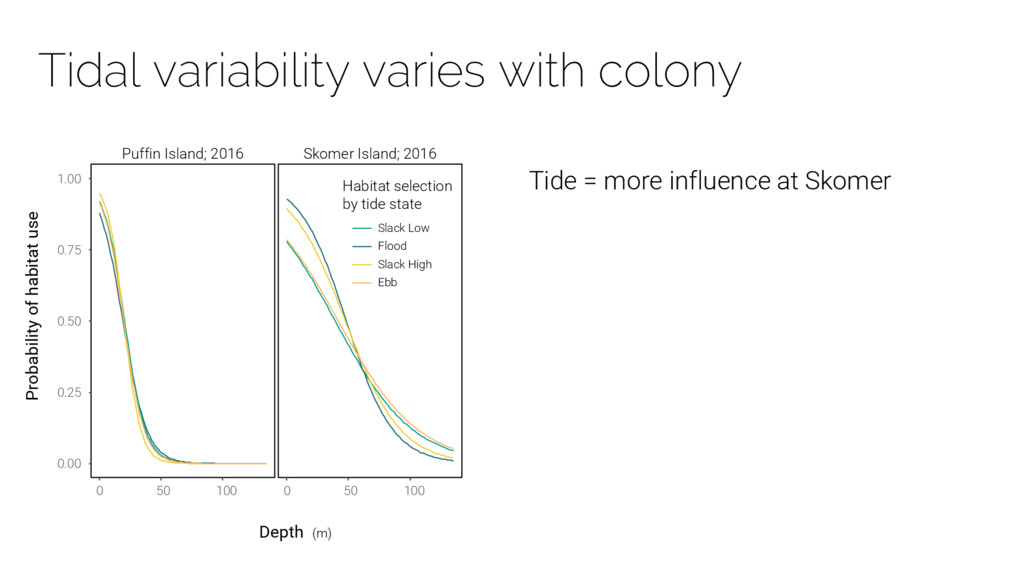
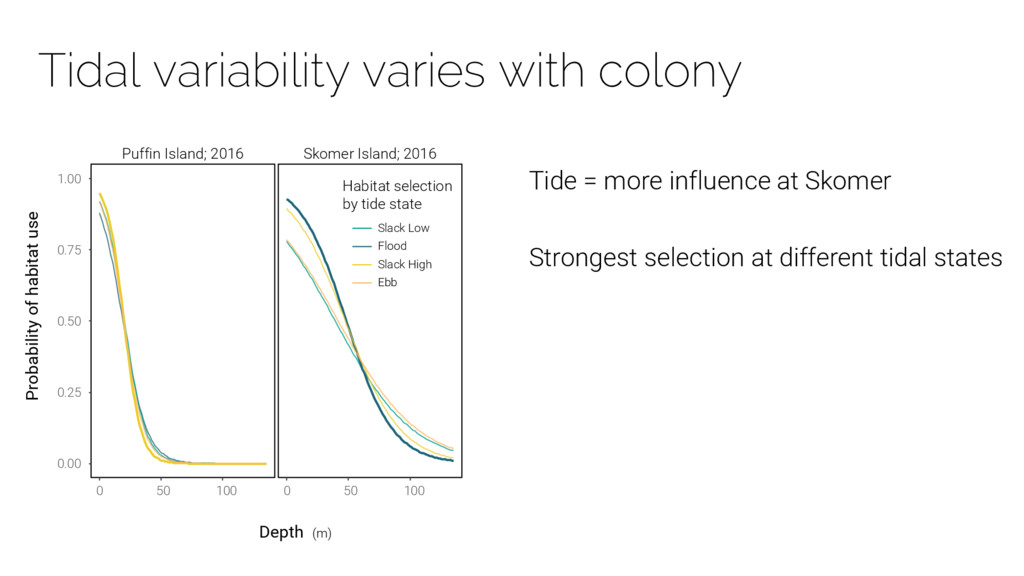
colony Depth (m) Probability of habitat use Tide = more influence at Skomer 0.00 0.25 0.50 0.75 1.00 Habitat selection by tide state Slack Low Flood Slack High Ebb Puffin Island; 2016 Skomer Island; 2016
colony Depth (m) Probability of habitat use Tide = more influence at Skomer Strongest selection at different tidal states 0.00 0.25 0.50 0.75 1.00 Habitat selection by tide state Slack Low Flood Slack High Ebb Puffin Island; 2016 Skomer Island; 2016
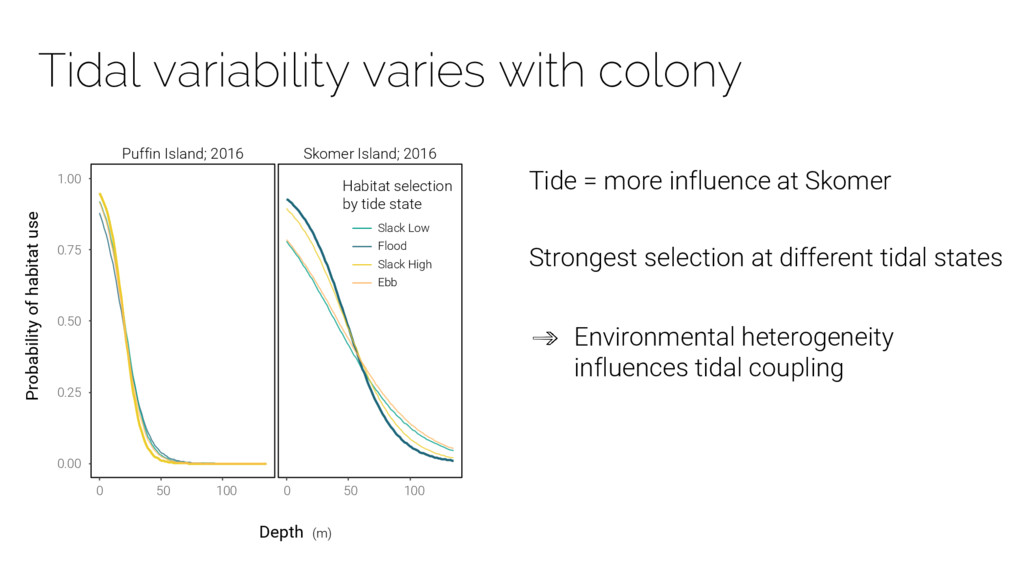
colony Depth (m) Probability of habitat use Tide = more influence at Skomer Strongest selection at different tidal states Environmental heterogeneity influences tidal coupling 0.00 0.25 0.50 0.75 1.00 Habitat selection by tide state Slack Low Flood Slack High Ebb Puffin Island; 2016 Skomer Island; 2016
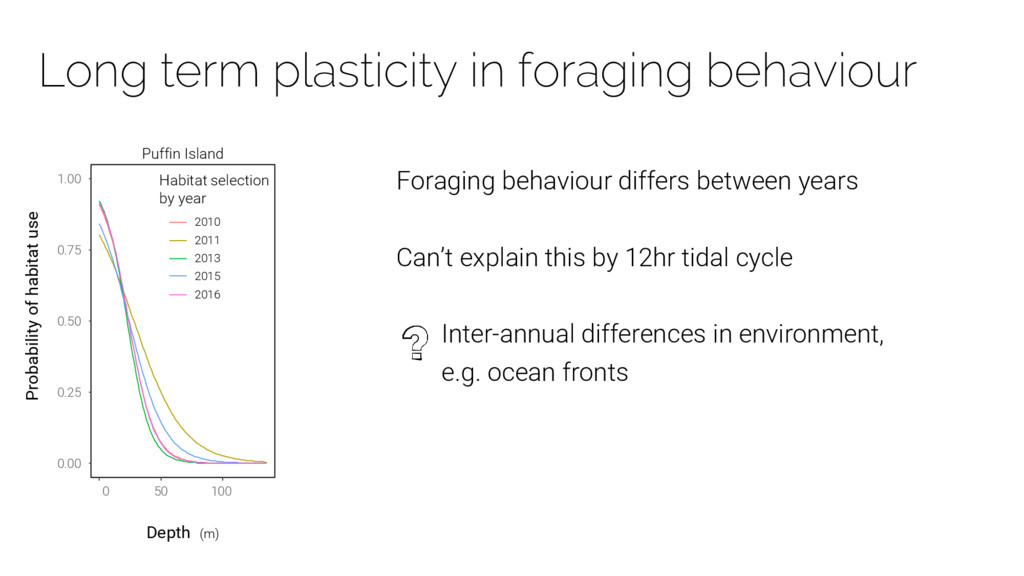
1.00 0 50 100 Habitat selection by year 2010 2011 2013 2015 2016 Probability of habitat use Foraging behaviour differs between years Can’t explain this by 12hr tidal cycle Inter-annual differences in environment, e.g. ocean fronts Depth (m) Puffin Island