Upgrade to Pro — share decks privately, control downloads, hide ads and more …

British Ornithological Union 2017

British Ornithological Union 2017

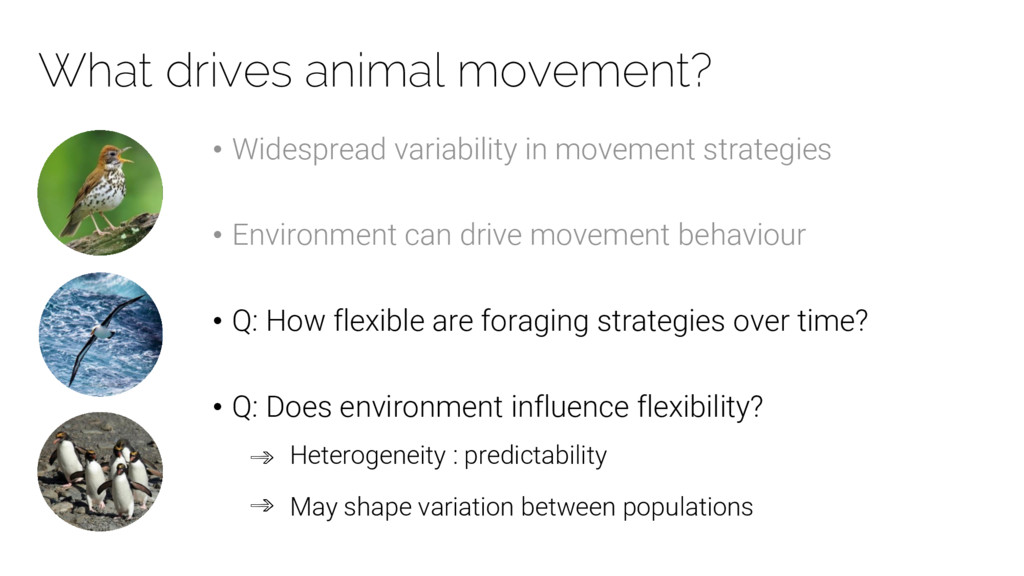
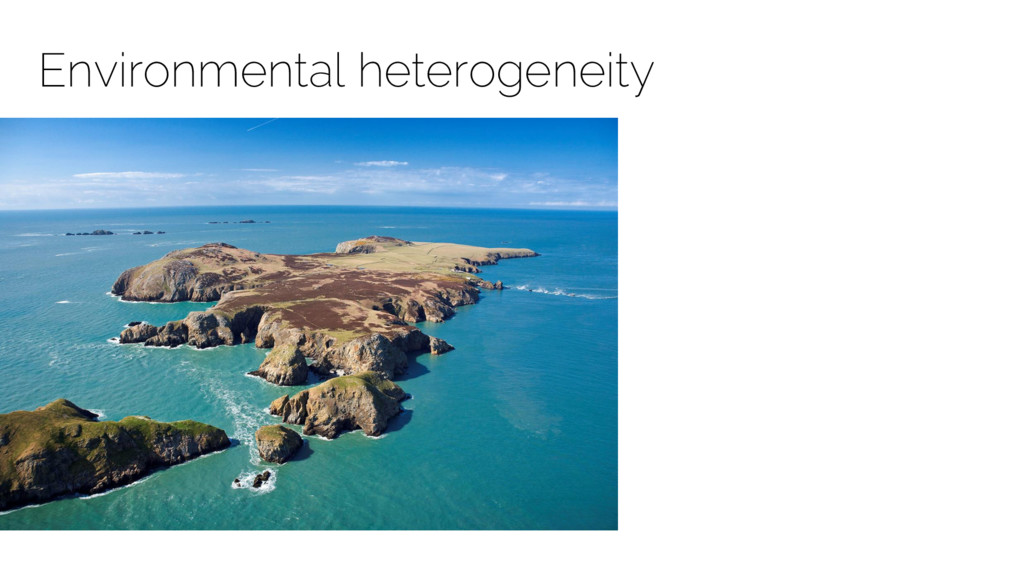
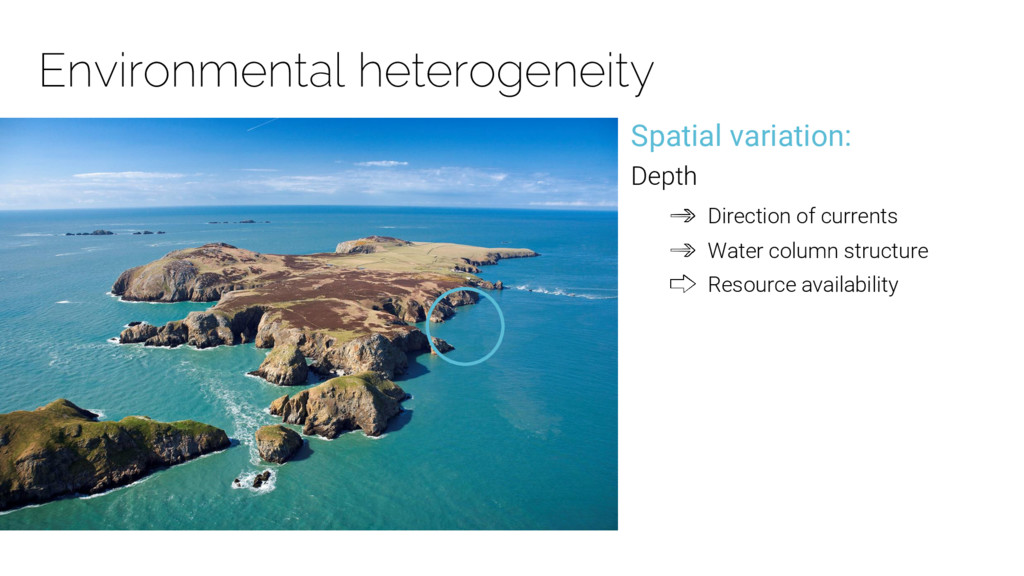
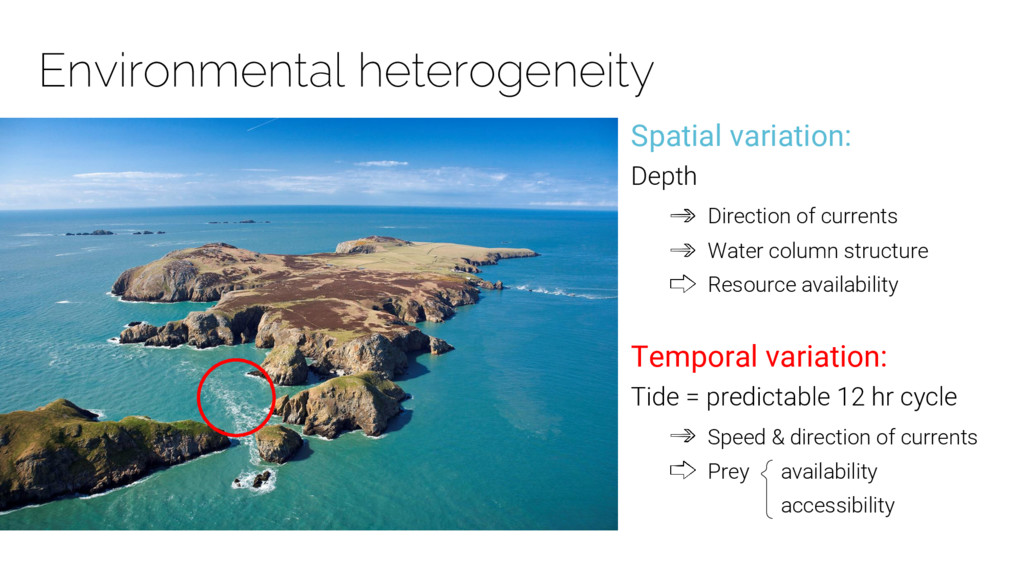
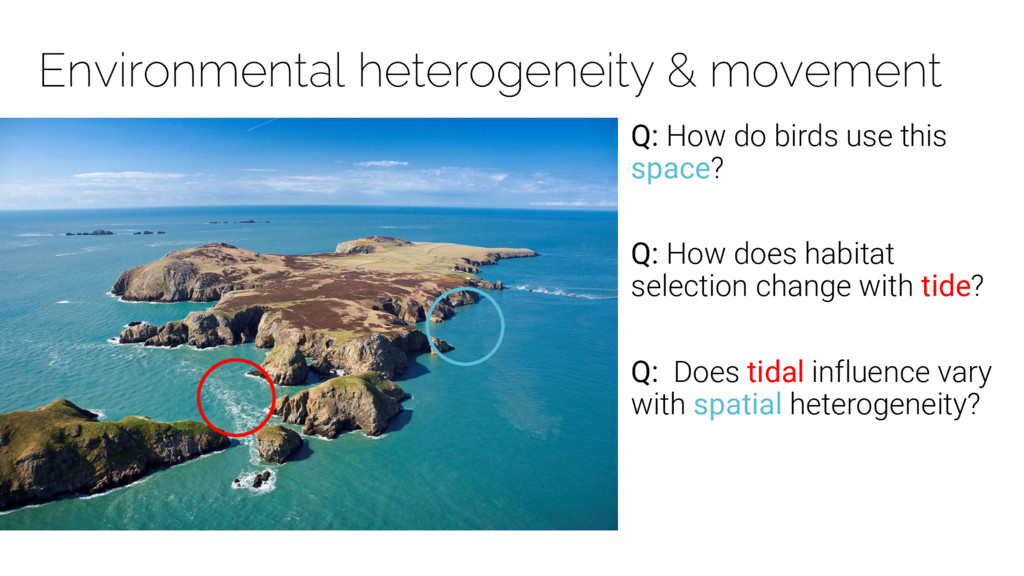
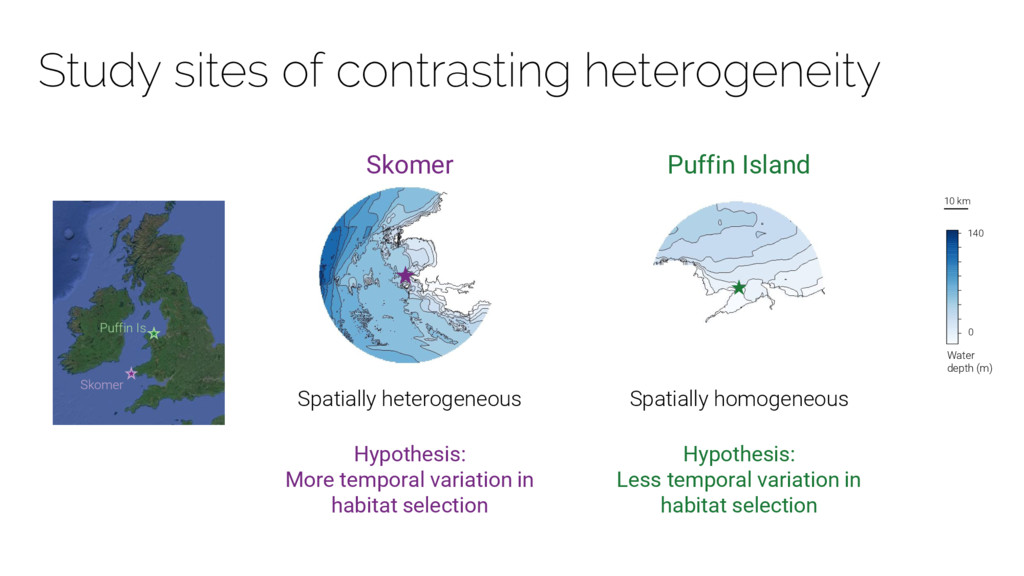
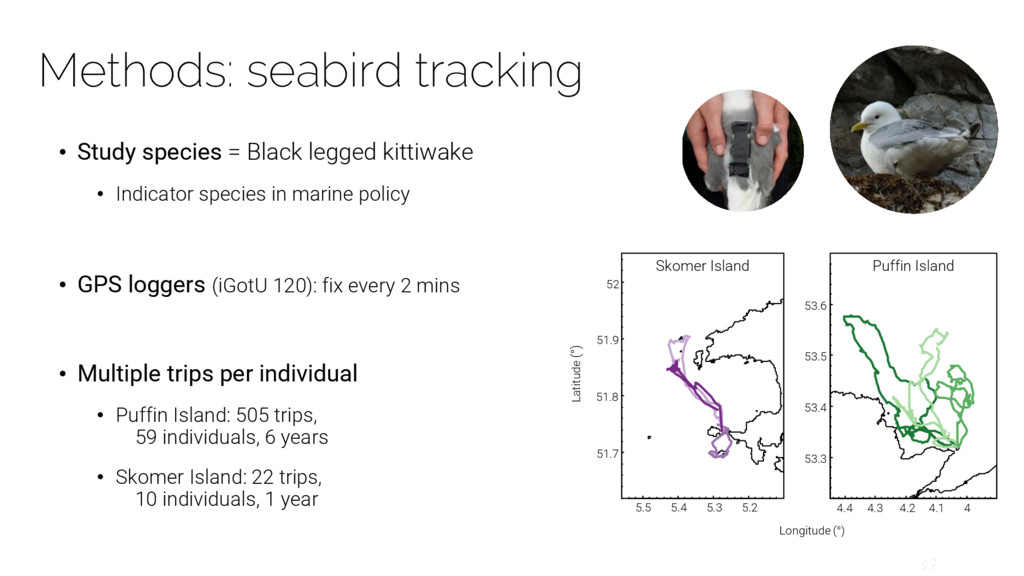
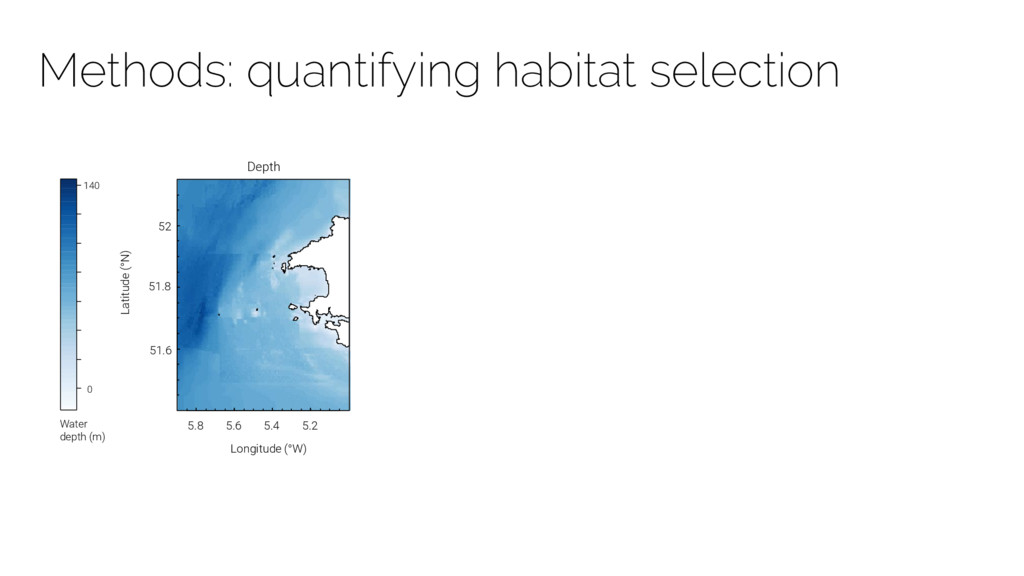
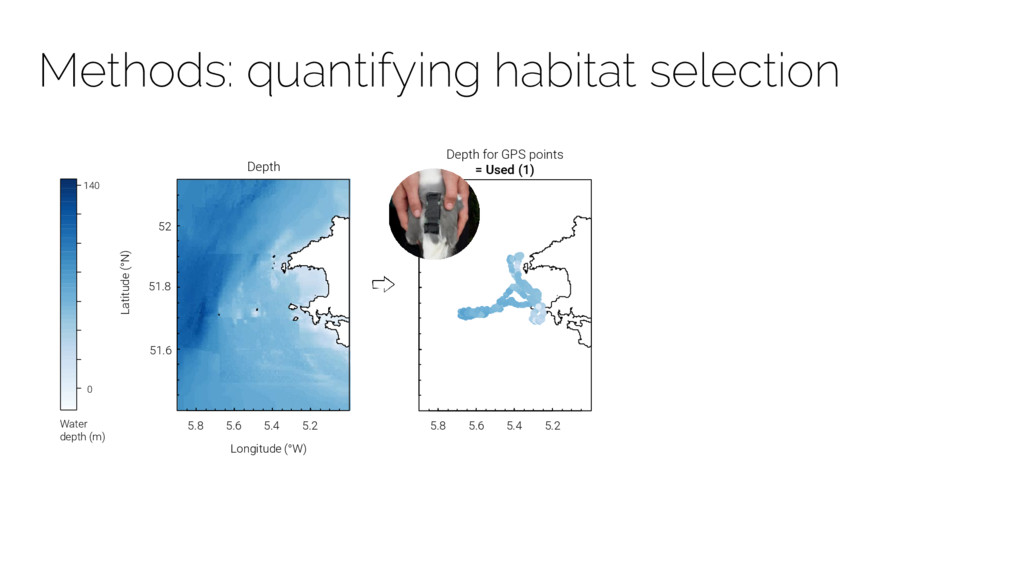
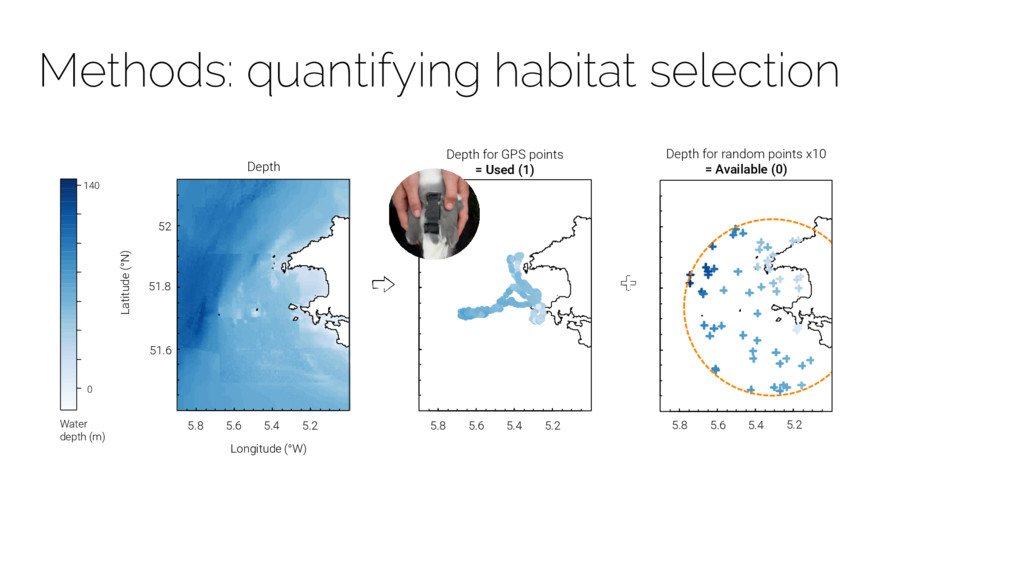
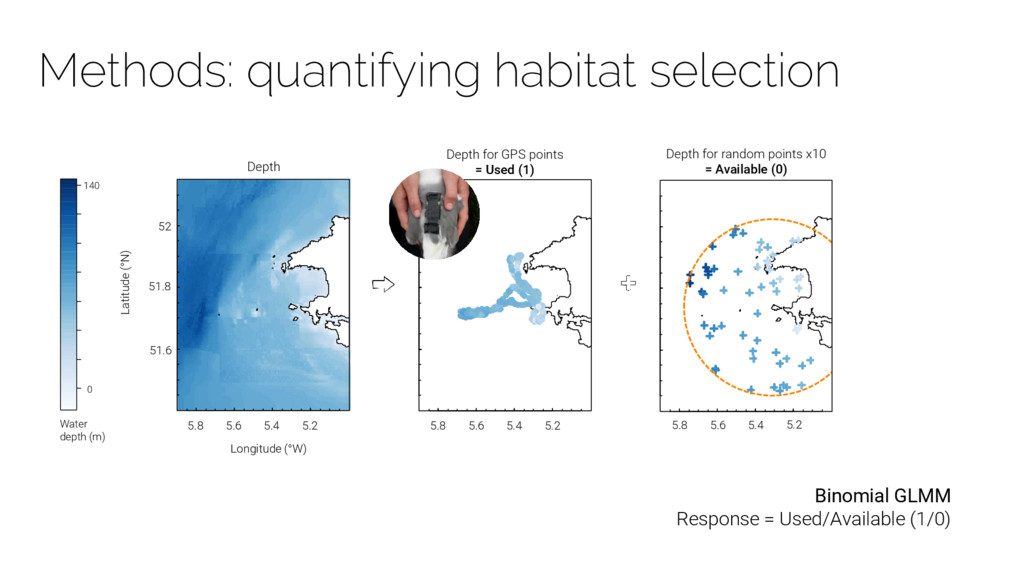
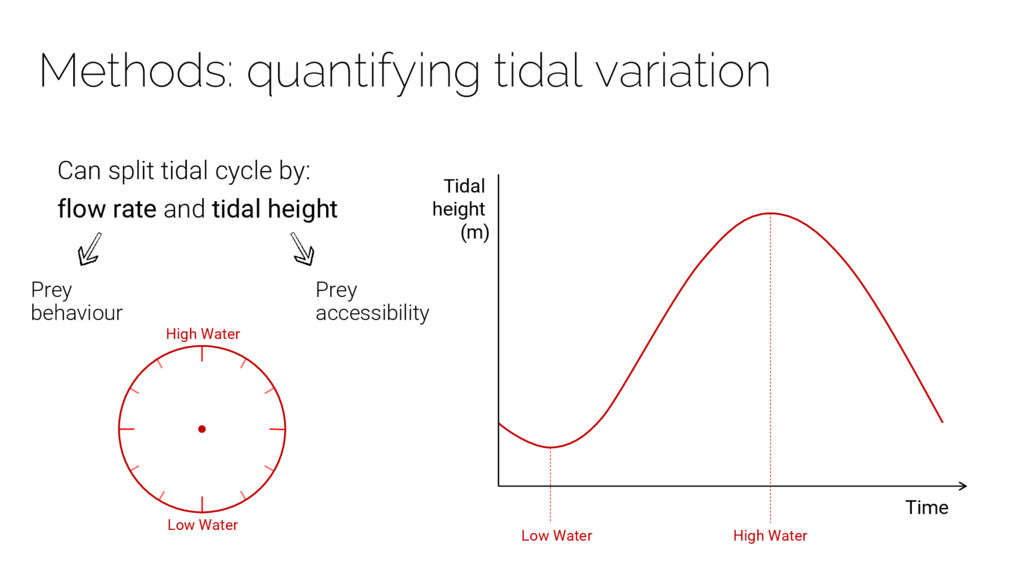
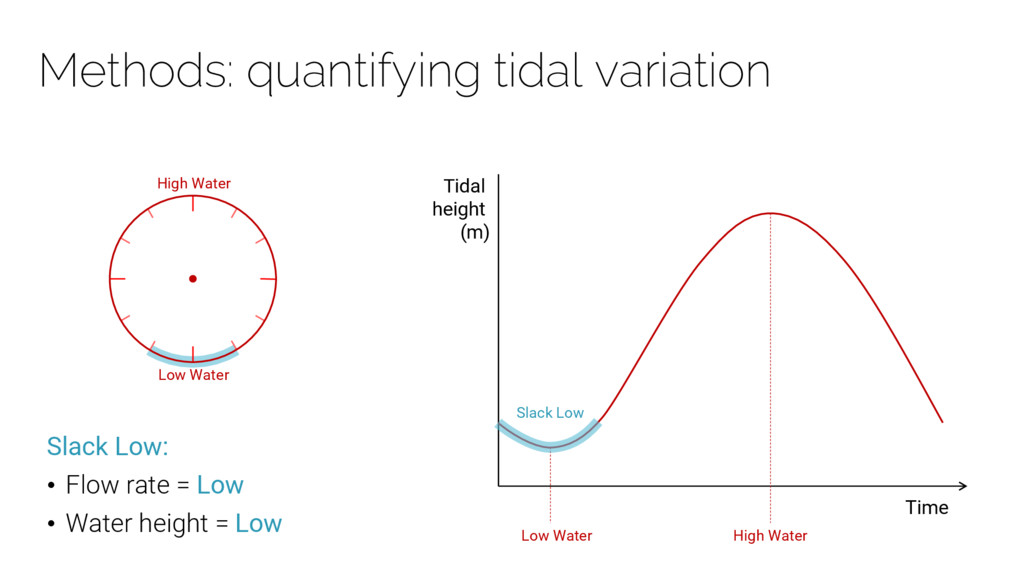
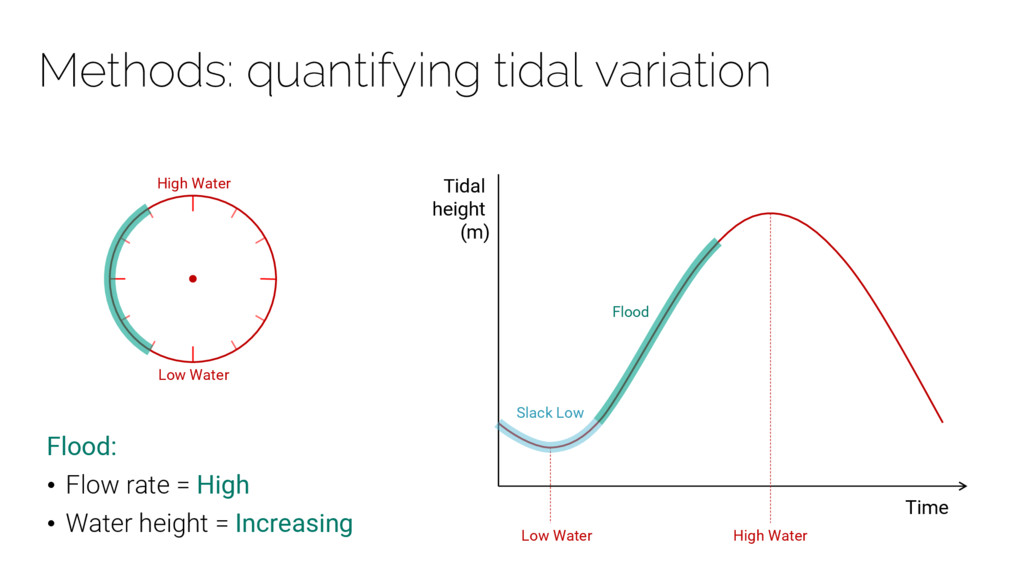
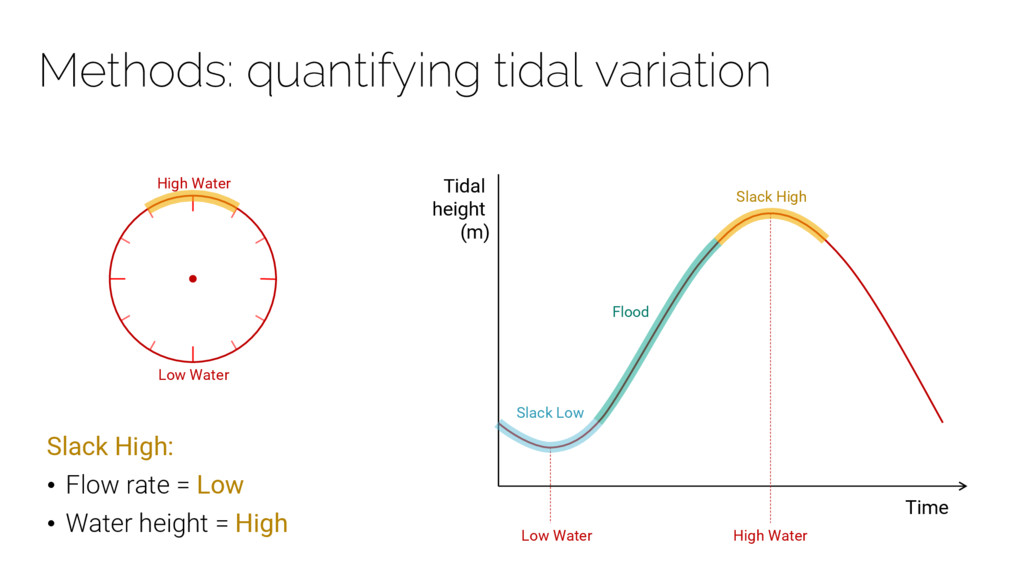
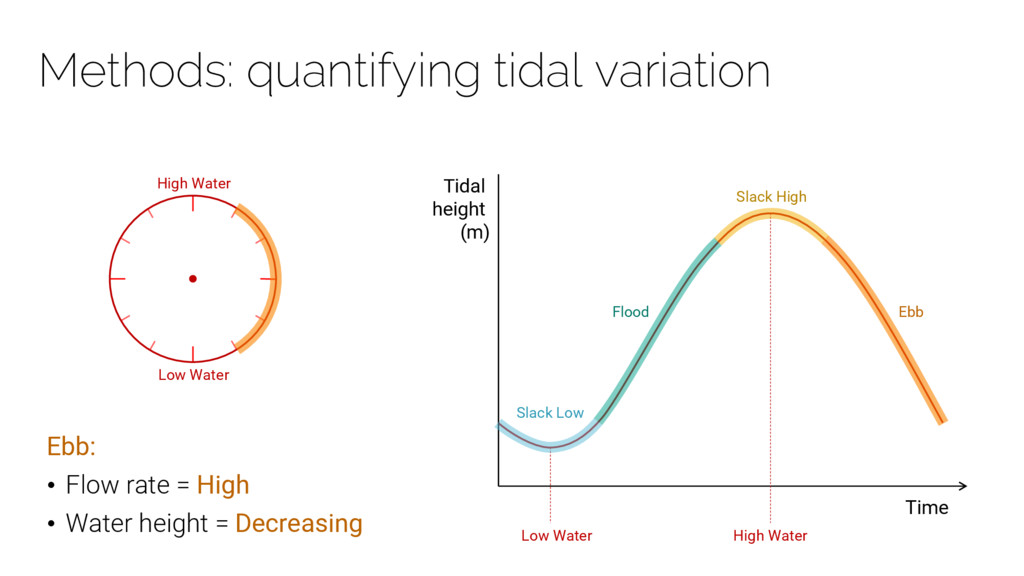
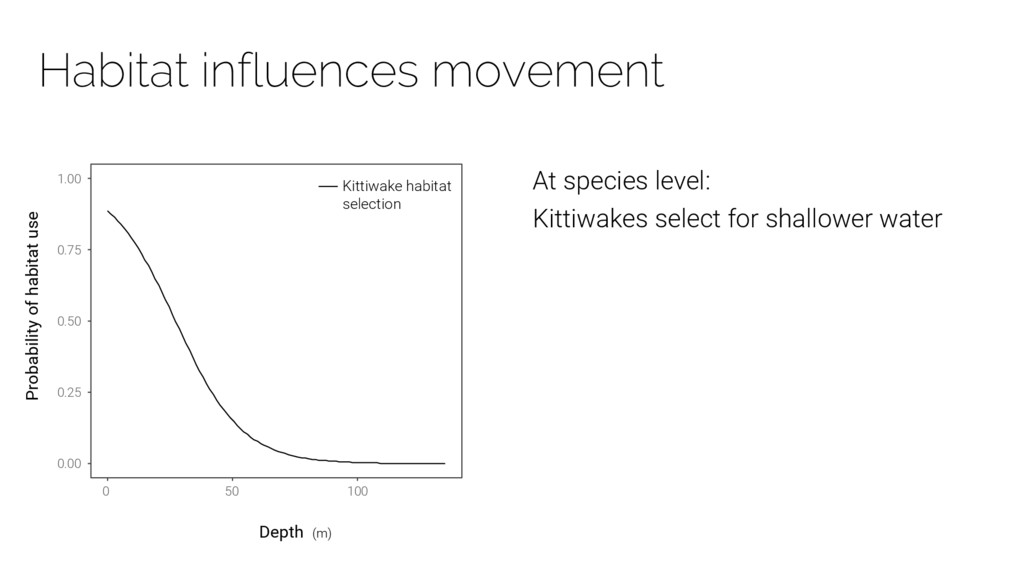
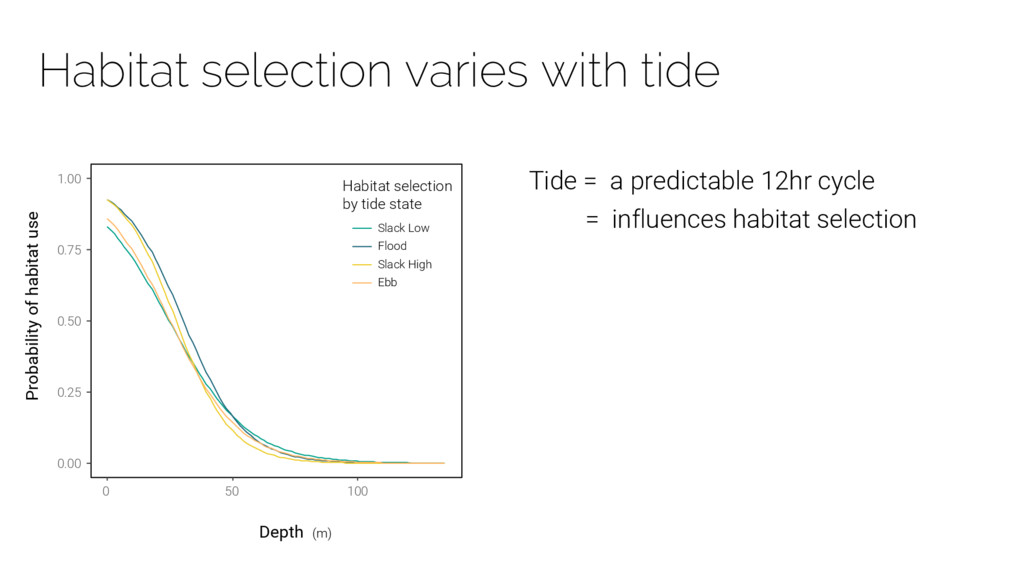
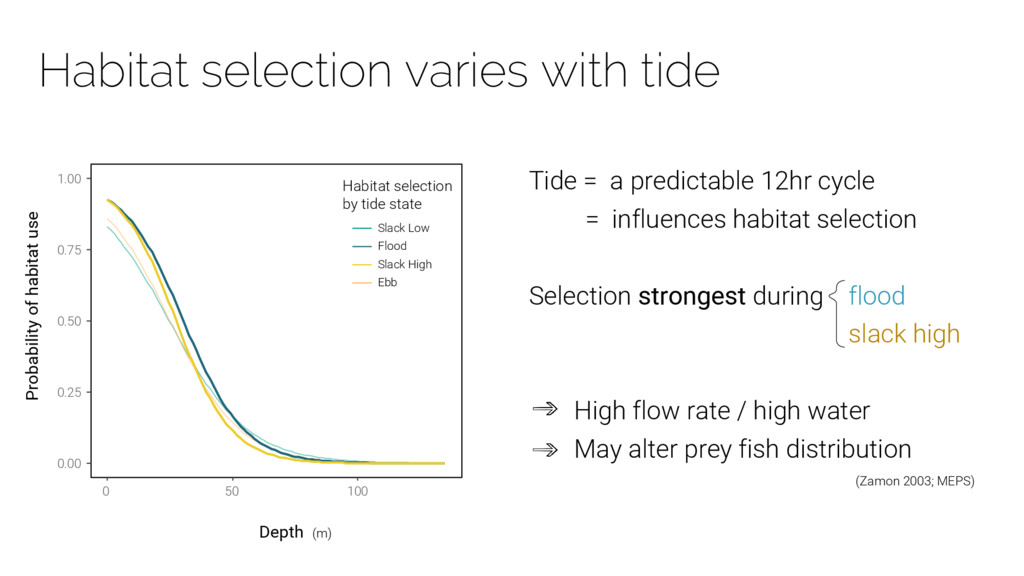
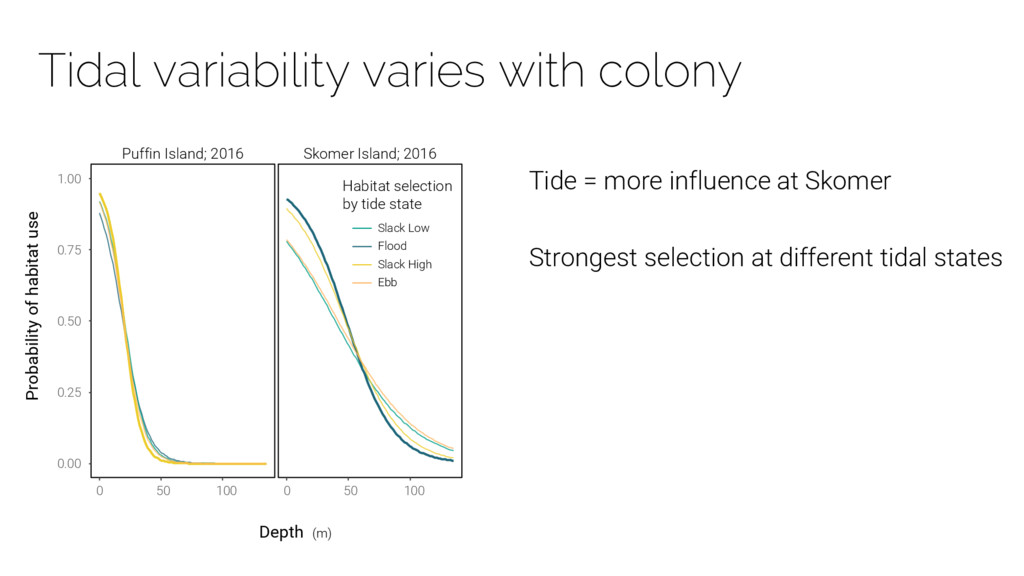
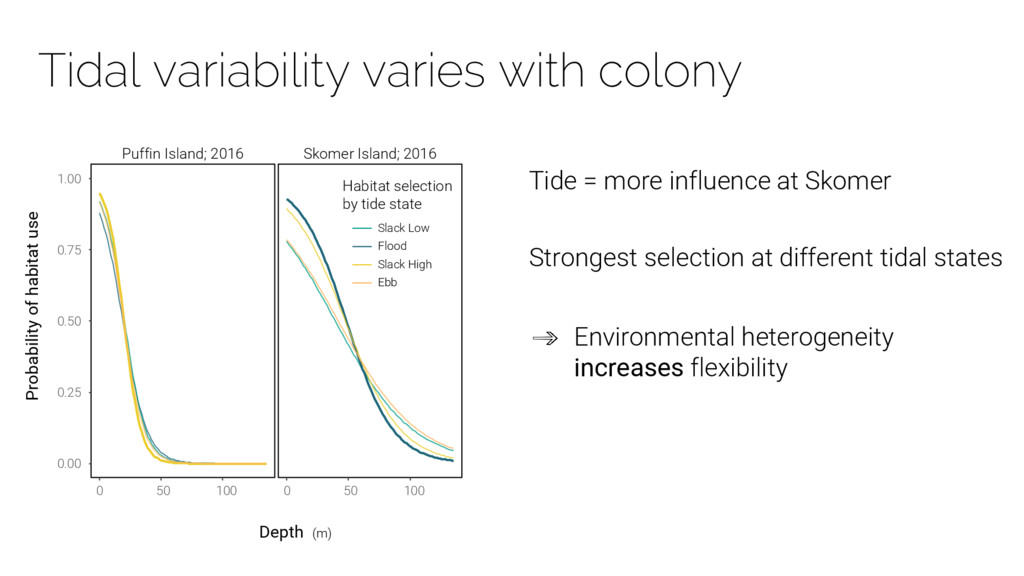
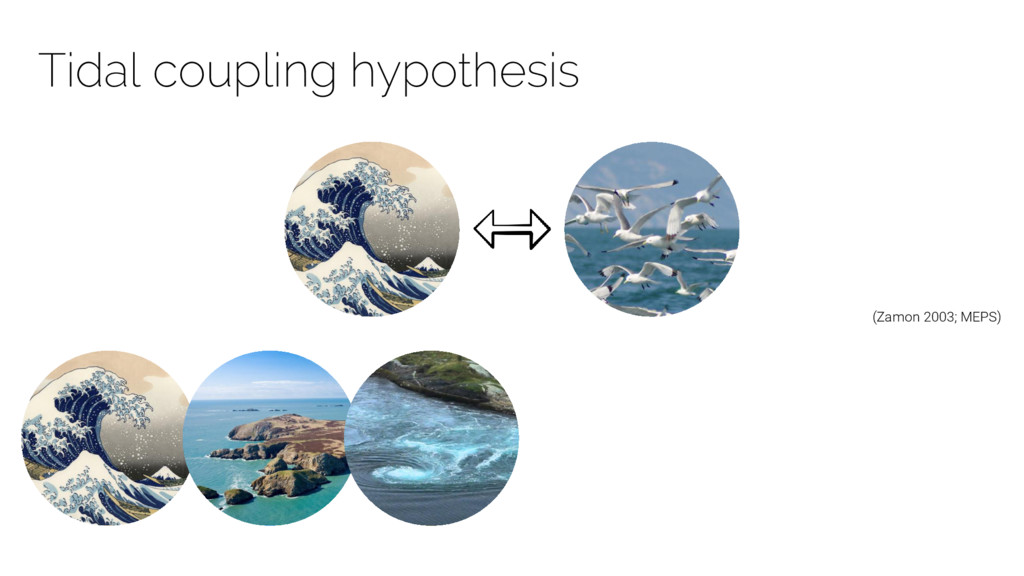
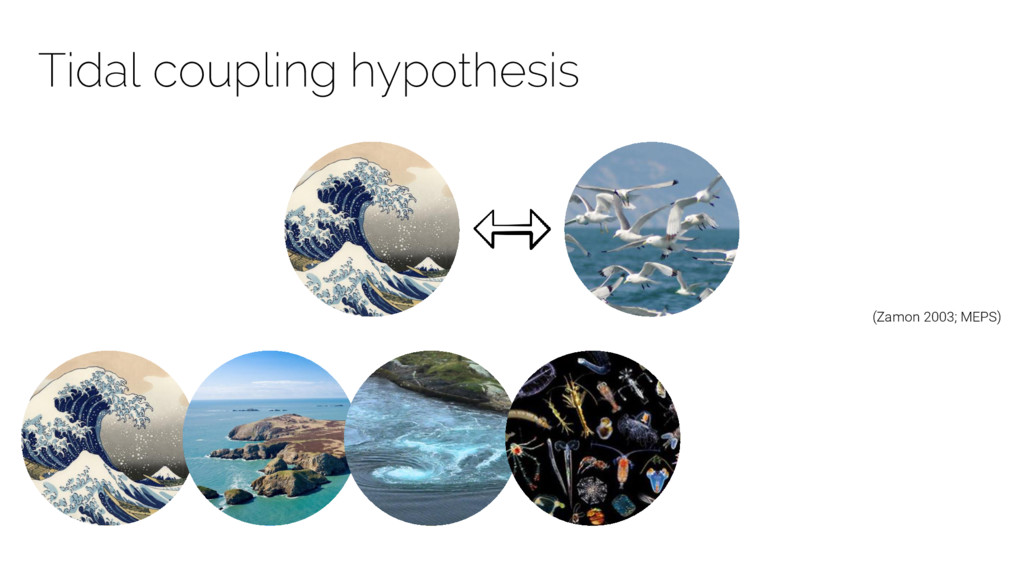
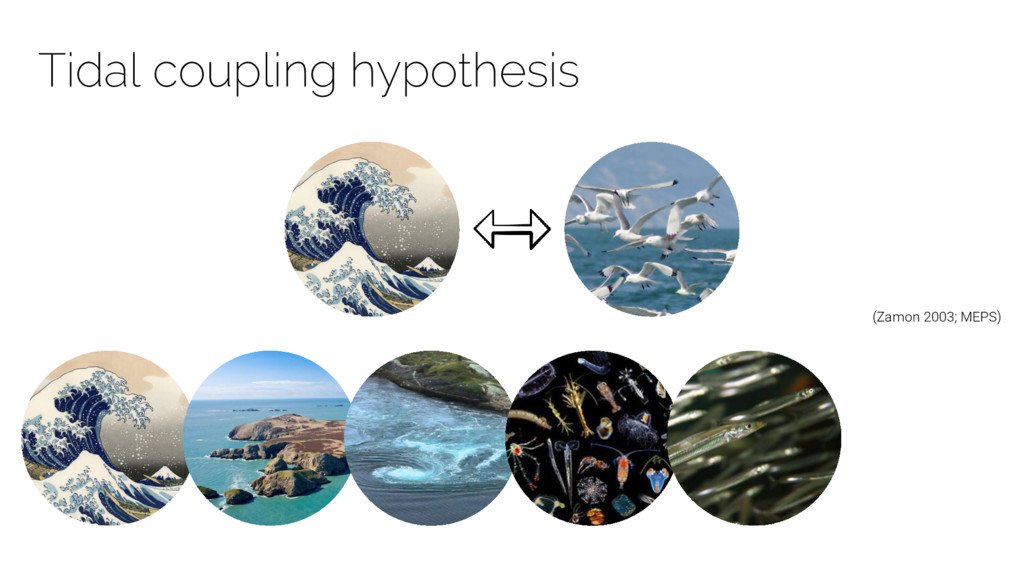
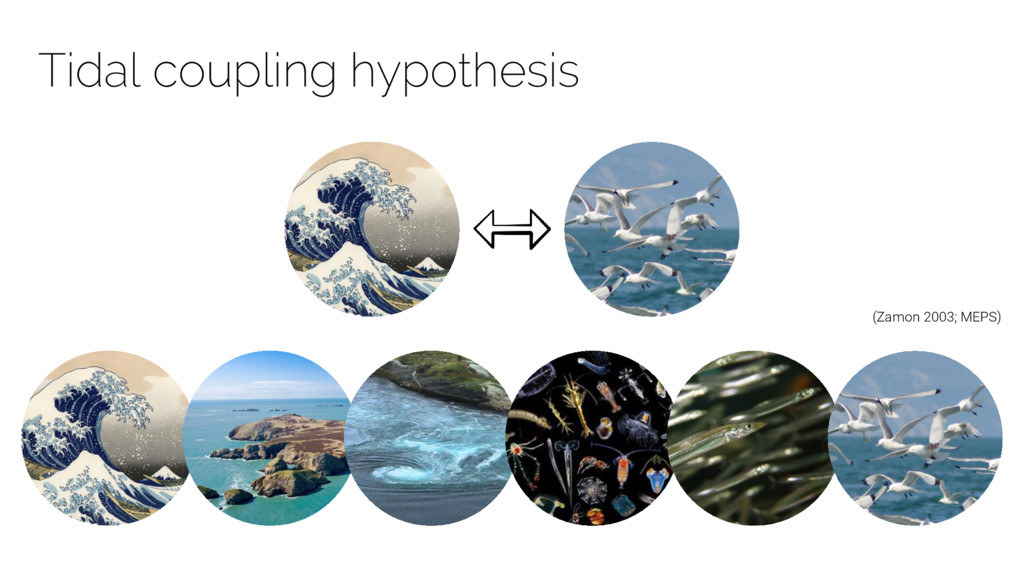
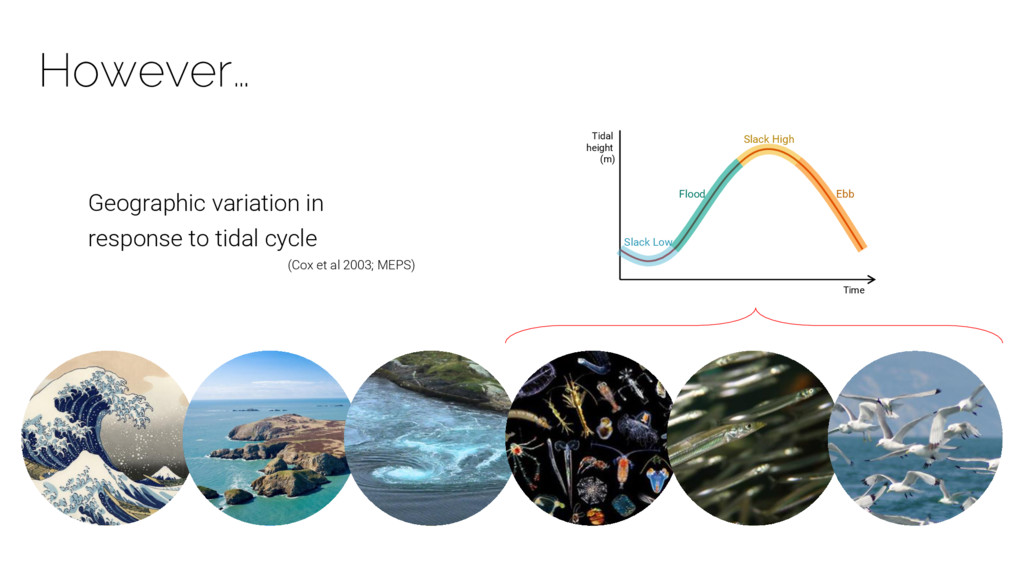
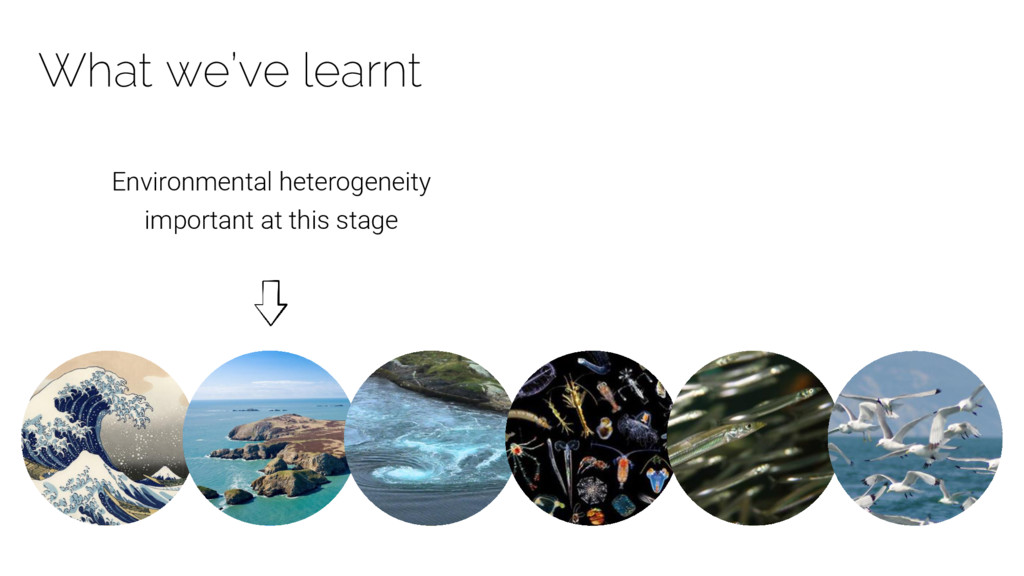
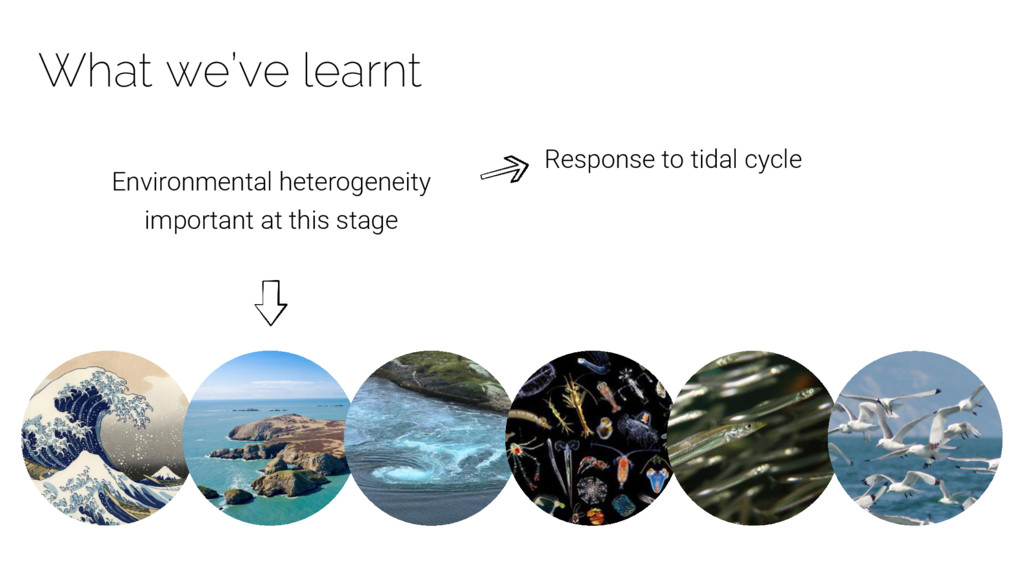
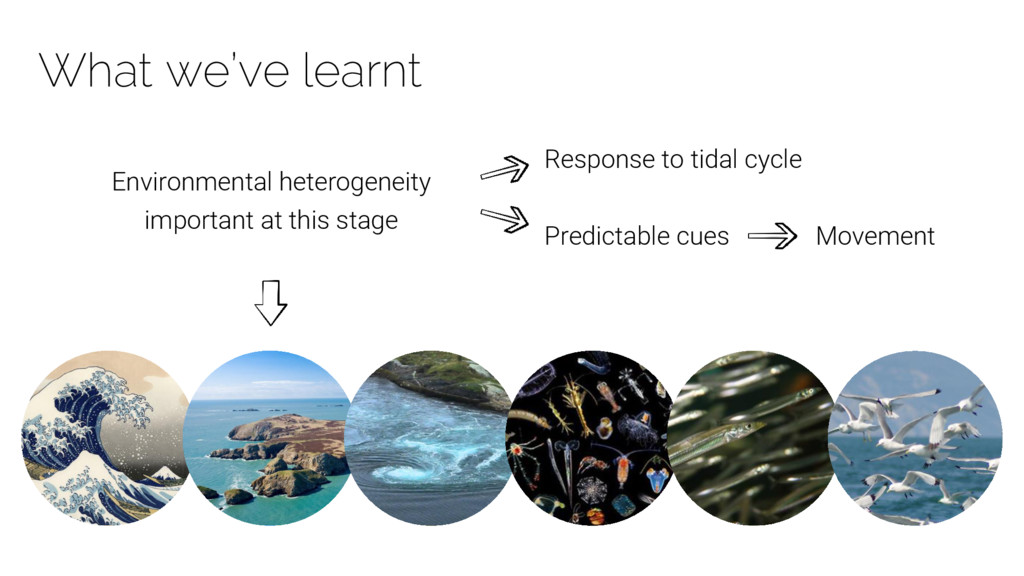
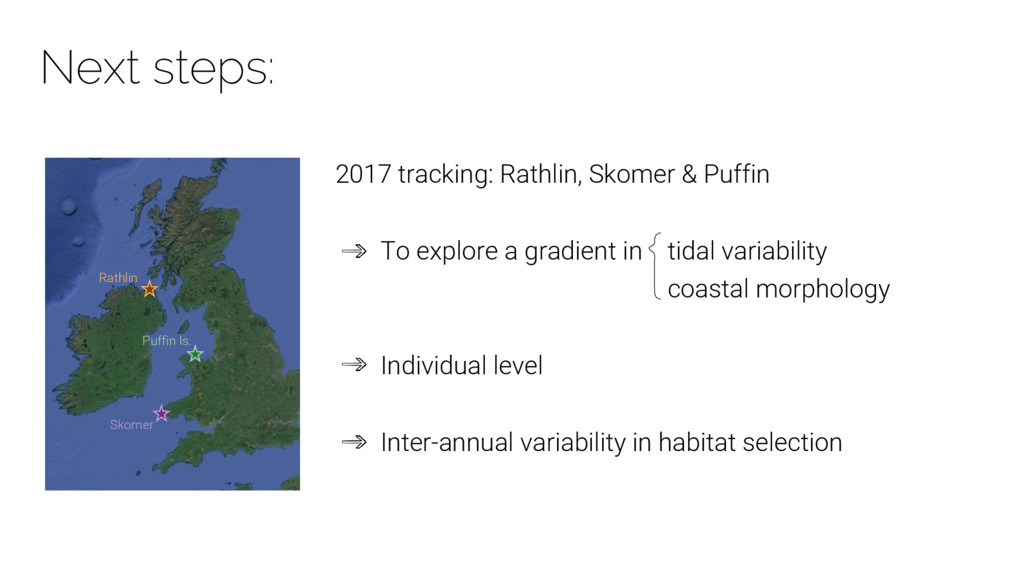
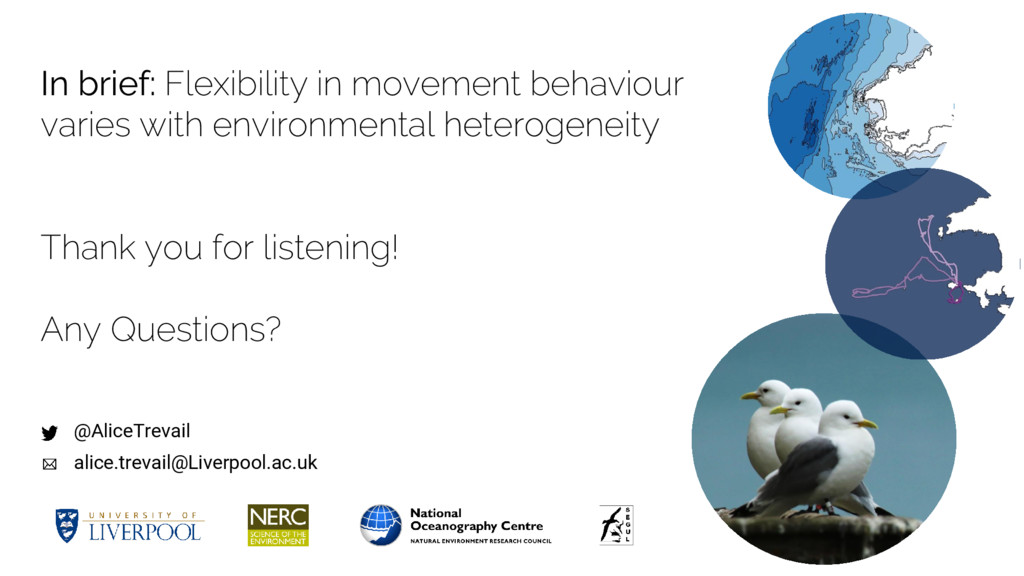
Presentation on the role of spatial and temporal variation in driving seabird foraging behaviour at the British Ornithological Union, March 2017. Here we show that both depth and tide influence foraging behaviour, and that environmental heterogeneity may influence the strength of bio-physical coupling between seabird behaviour and the tide.

Alice Trevail

March 30, 2017
Tweet

More Decks by Alice Trevail

Other Decks in Science

Transcript

  1. The influence of environmental predictability on foraging behaviour Alice M

    Trevail, Jonathan A Green, Jonathan Sharples, Jeffrey Polton, John Arnould & Samantha C Patrick @AliceTrevail [email protected]
  2. What drives animal movement? • Widespread variability in movement strategies

    Individual / Population Ecological processes Population dynamics Ed Schneider Liam Quinn Antarctica.gov.au
  3. What drives animal movement? • Widespread variability in movement strategies

    • Environment can drive movement behaviour Resource availability : foraging habitat selection E.g. hotspots Ed Schneider Liam Quinn Antarctica.gov.au
  4. What drives animal movement? • Widespread variability in movement strategies

    • Environment can drive movement behaviour • Q: How flexible are foraging strategies over time? Respond to resource availability at different time scales? Adapt to predictability? Ed Schneider Liam Quinn Antarctica.gov.au
  5. What drives animal movement? • Widespread variability in movement strategies

    • Environment can drive movement behaviour • Q: How flexible are foraging strategies over time? • Q: Does environment influence flexibility? Heterogeneity : predictability May shape variation between populations Ed Schneider Liam Quinn Antarctica.gov.au
  6. Environmental heterogeneity Spatial variation: Depth Direction of currents Water column

    structure Resource availability Temporal variation: Tide = predictable 12 hr cycle Speed & direction of currents Prey availability accessibility
  7. Environmental heterogeneity & movement Q: How do birds use this

    space? Q: How does habitat selection change with tide?
  8. Environmental heterogeneity & movement Q: How do birds use this

    space? Q: How does habitat selection change with tide? Q: Does tidal influence vary with spatial heterogeneity?
  9. Skomer Puffin Is. Skomer Puffin Island Spatially heterogeneous Hypothesis: More

    temporal variation in habitat selection Spatially homogeneous Hypothesis: Less temporal variation in habitat selection Bathymetry Longitude Latitude 51.4 N 51.6 N 51.8 N 52 N 52.2 N 52.4 N 6 W 5.5 W 5 W 4.5 W 0 20 40 60 80 100 120 140 Water depth (m) 140 0 10 km Study sites of contrasting heterogeneity
  10. Methods: seabird tracking • Study species = Black legged kittiwake

    • Indicator species in marine policy • GPS loggers (iGotU 120): fix every 2 mins • Multiple trips per individual • Puffin Island: 505 trips, 59 individuals, 6 years • Skomer Island: 22 trips, 10 individuals, 1 year Latitude (°) 4.4 4.2 4 53.3 53.4 53.5 53.6 4.3 4.1 Puffin Island 52 51.9 51.8 51.7 Skomer Island 5.5 5.4 5.3 5.2 Longitude (°) @AliceTrevail
  11. 5.6 5.8 5.2 51.6 52 51.8 5.4 Latitude (°N) Depth

    Longitude (°W) 4.5 W 0 20 40 60 80 100 120 140 Water depth (m) 140 0 Methods: quantifying habitat selection
  12. 5.6 5.8 5.2 51.6 52 51.8 5.4 Latitude (°N) Depth

    Longitude (°W) 4.5 W 0 20 40 60 80 100 120 140 Water depth (m) 140 0 5.6 5.8 5.2 5.4 Depth for GPS points = Used (1) Methods: quantifying habitat selection
  13. 5.6 5.8 5.2 51.6 52 51.8 5.4 Latitude (°N) Depth

    Longitude (°W) 4.5 W 0 20 40 60 80 100 120 140 Water depth (m) 140 0 5.6 5.8 5.2 5.4 Depth for GPS points = Used (1) 5.6 5.8 5.2 5.4 Depth for random points x10 = Available (0) Methods: quantifying habitat selection
  14. 5.6 5.8 5.2 51.6 52 51.8 5.4 Latitude (°N) Depth

    Longitude (°W) 4.5 W 0 20 40 60 80 100 120 140 Water depth (m) 140 0 5.6 5.8 5.2 5.4 Depth for GPS points = Used (1) 5.6 5.8 5.2 5.4 Depth for random points x10 = Available (0) Binomial GLMM Response = Used/Available (1/0) Methods: quantifying habitat selection
  15. Can split tidal cycle by: flow rate and tidal height

    Methods: quantifying tidal variation Tidal height (m) Time Low Water High Water Low Water High Water Prey behaviour Prey accessibility
  16. Methods: quantifying tidal variation Tidal height (m) Time Low Water

    High Water Slack Low Slack Low: • Flow rate = Low • Water height = Low Low Water High Water
  17. Flood: • Flow rate = High • Water height =

    Increasing Methods: quantifying tidal variation Tidal height (m) Time Low Water High Water Low Water High Water Slack Low Flood
  18. Slack High: • Flow rate = Low • Water height

    = High Methods: quantifying tidal variation Tidal height (m) Time Low Water High Water Low Water High Water Slack Low Flood Slack High
  19. Ebb: • Flow rate = High • Water height =

    Decreasing Methods: quantifying tidal variation Tidal height (m) Time Low Water High Water Low Water High Water Slack Low Flood Slack High Ebb
  20. Habitat influences movement Depth (m) Probability of habitat use 0.00

    0.25 0.50 0.75 1.00 0 50 100 At species level: Kittiwakes select for shallower water Kittiwake habitat selection
  21. Habitat selection varies with tide Depth (m) Probability of habitat

    use 0.00 0.25 0.50 0.75 1.00 0 50 100 Tide = a predictable 12hr cycle = influences habitat selection Habitat selection by tide state Slack Low Flood Slack High Ebb
  22. Habitat selection varies with tide Depth (m) Probability of habitat

    use Tide = a predictable 12hr cycle = influences habitat selection Selection strongest during flood slack high High flow rate / high water May alter prey fish distribution (Zamon 2003; MEPS) Habitat selection by tide state Slack Low Flood Slack High Ebb 0.00 0.25 0.50 0.75 1.00 0 50 100
  23. 0 50 100 0 50 100 Tidal variability varies with

    colony Depth (m) Probability of habitat use Tide = more influence at Skomer 0.00 0.25 0.50 0.75 1.00 Habitat selection by tide state Slack Low Flood Slack High Ebb Puffin Island; 2016 Skomer Island; 2016
  24. 0 50 100 0 50 100 Tidal variability varies with

    colony Depth (m) Probability of habitat use Tide = more influence at Skomer Strongest selection at different tidal states 0.00 0.25 0.50 0.75 1.00 Habitat selection by tide state Slack Low Flood Slack High Ebb Puffin Island; 2016 Skomer Island; 2016
  25. 0 50 100 0 50 100 Tidal variability varies with

    colony Depth (m) Probability of habitat use Tide = more influence at Skomer Strongest selection at different tidal states Environmental heterogeneity increases flexibility 0.00 0.25 0.50 0.75 1.00 Habitat selection by tide state Slack Low Flood Slack High Ebb Puffin Island; 2016 Skomer Island; 2016
  26. However… Geographic variation in response to tidal cycle (Cox et

    al 2003; MEPS) Tidal height (m) Time Slack Low Flood Slack High Ebb
  27. Next steps: Skomer Puffin Is. Rathlin 2017 tracking: Rathlin, Skomer

    & Puffin To explore a gradient in tidal variability coastal morphology Individual level Inter-annual variability in habitat selection
  28. Thanks to Puffin Island field teams, including: Federico de Pascalis,

    Harriet Clarke, Ruth Dunn, Phil Collins, Louise Soanes & Steve Dodd As well as Skomer wardens, B and Ed, & Ros Green