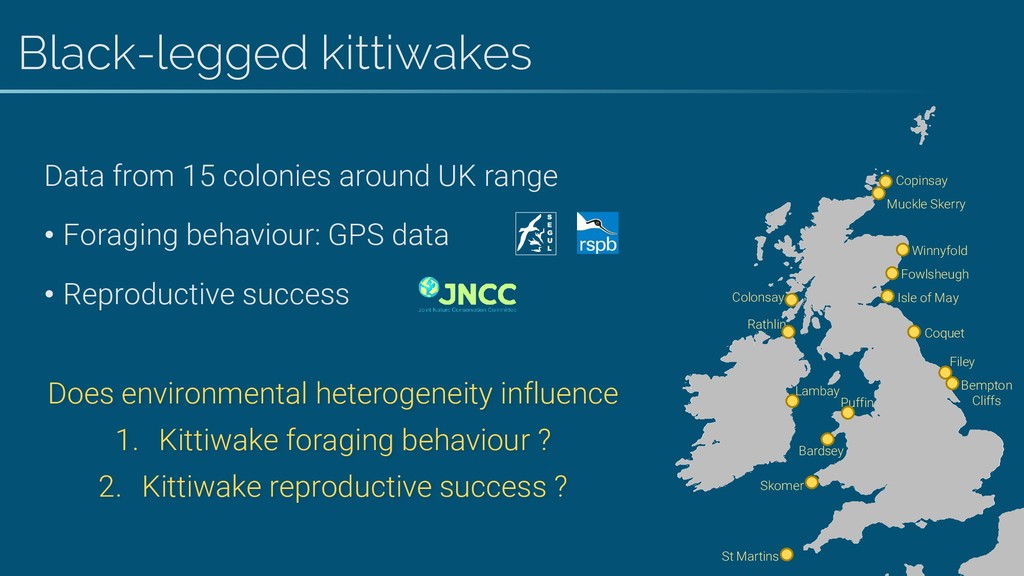
Presentation on work from my PhD about the effect of environmental heterogeneity on seabird behaviour and fitness. Thank you to the scientific committe for awarding me with joint first student presentation for this talk.
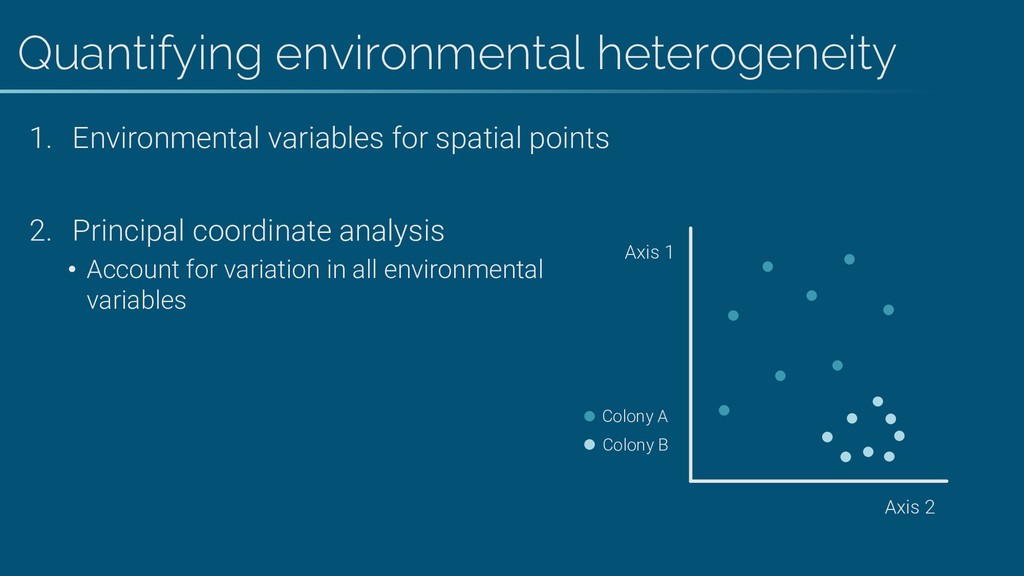
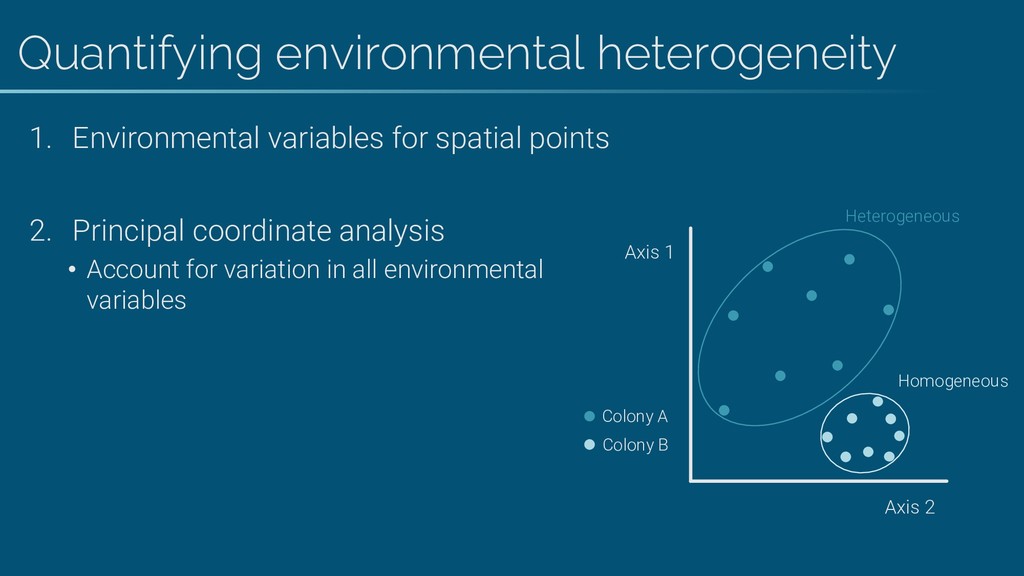
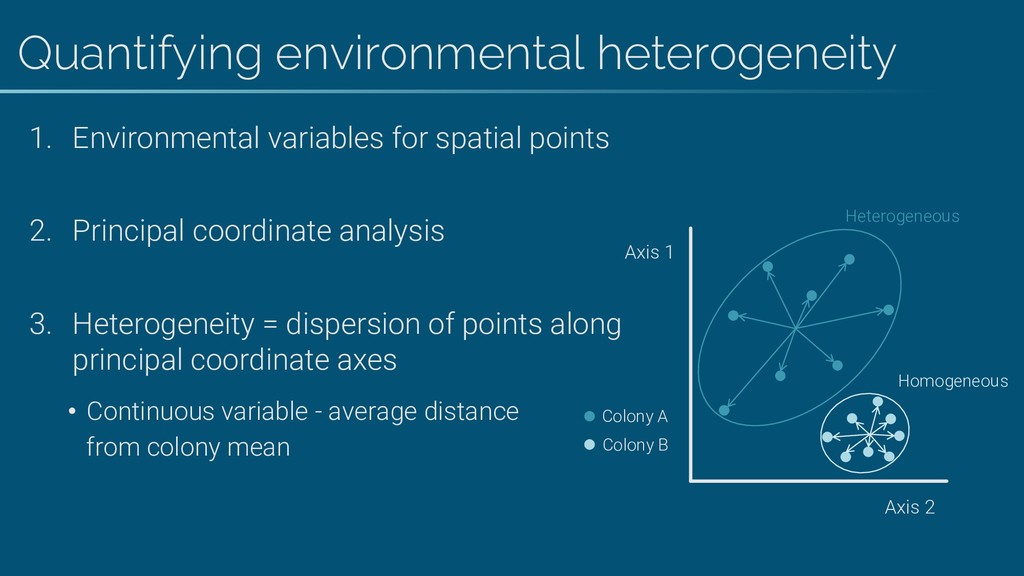
Principal coordinate analysis 3. Heterogeneity = dispersion of points along principal coordinate axes • Continuous variable - average distance from colony mean Axis 1 Axis 2 Colony A Colony B Heterogeneous Homogeneous
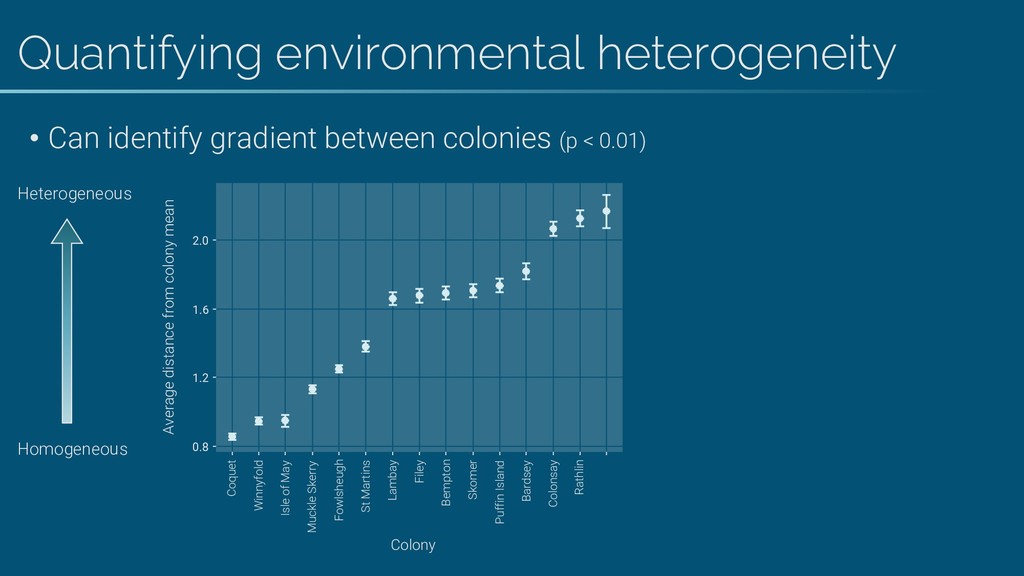
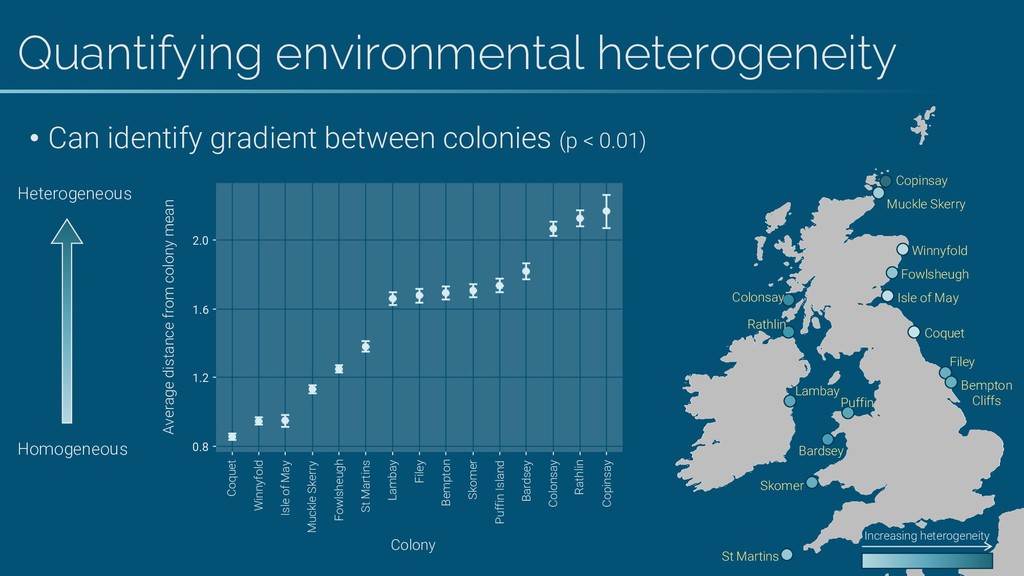
< 0.01) 0.8 1.2 1.6 2.0 Coquet Winnyfold Isle of May Muckle Skerry Fowlsheugh St Martins Lambay Filey Bempton Skomer Puffin Island Bardsey Colonsay Rathlin Colony Average distance from colony mean Heterogeneous Homogeneous
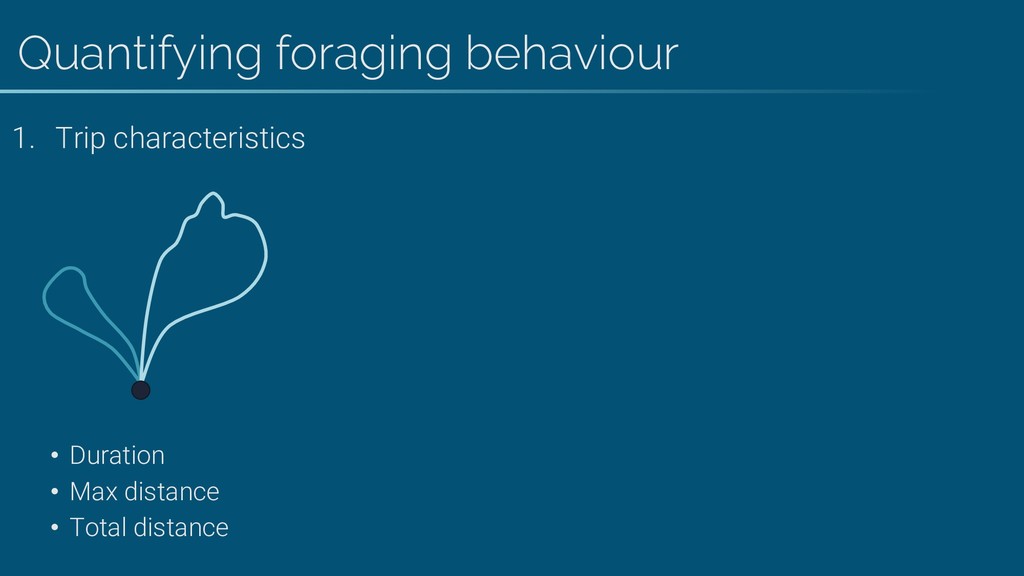
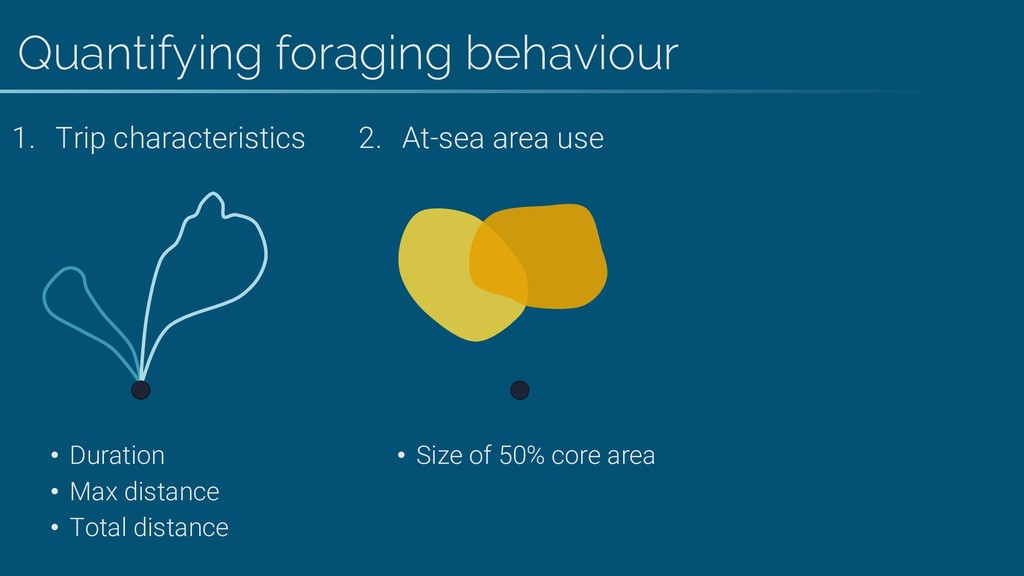
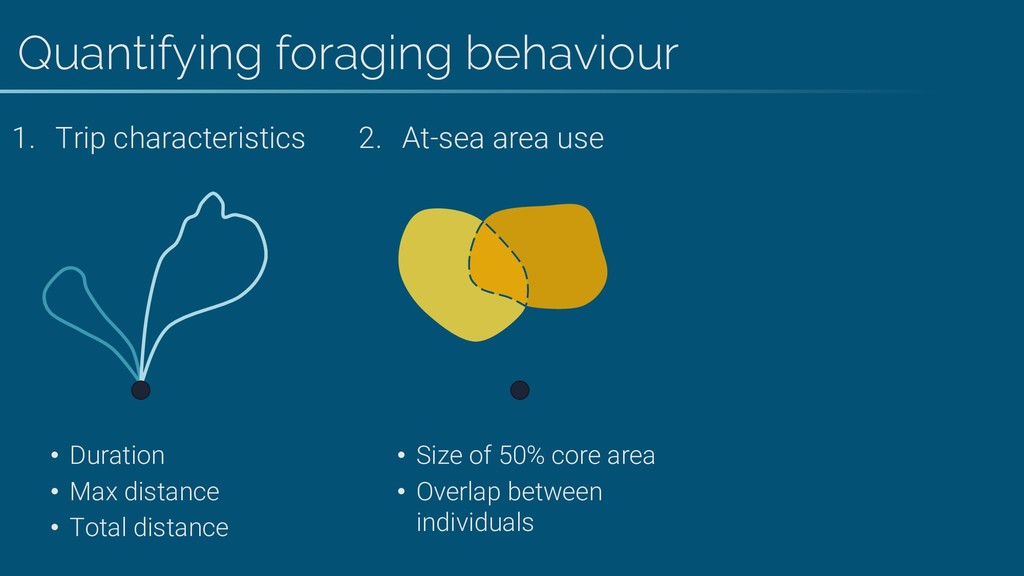
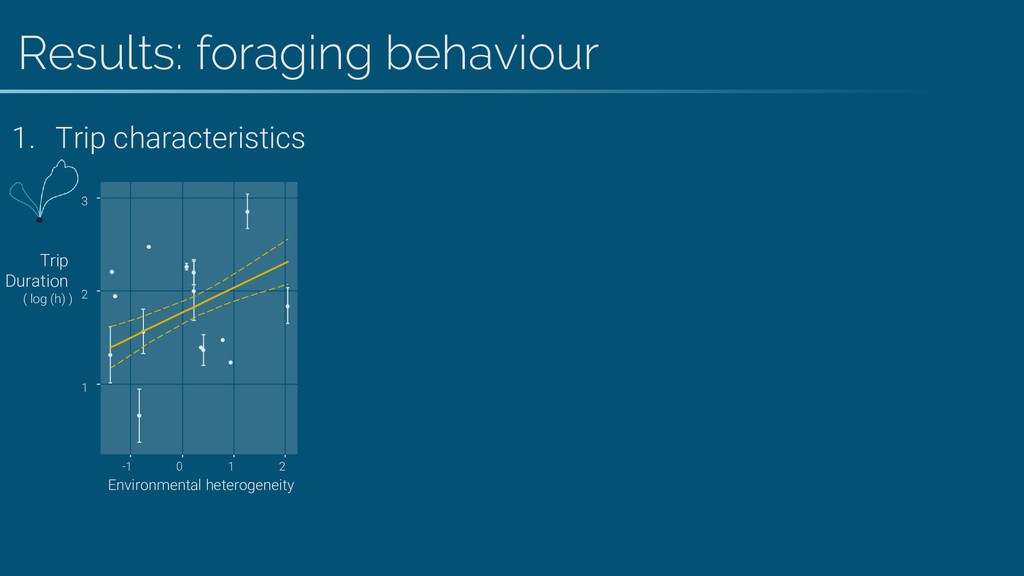
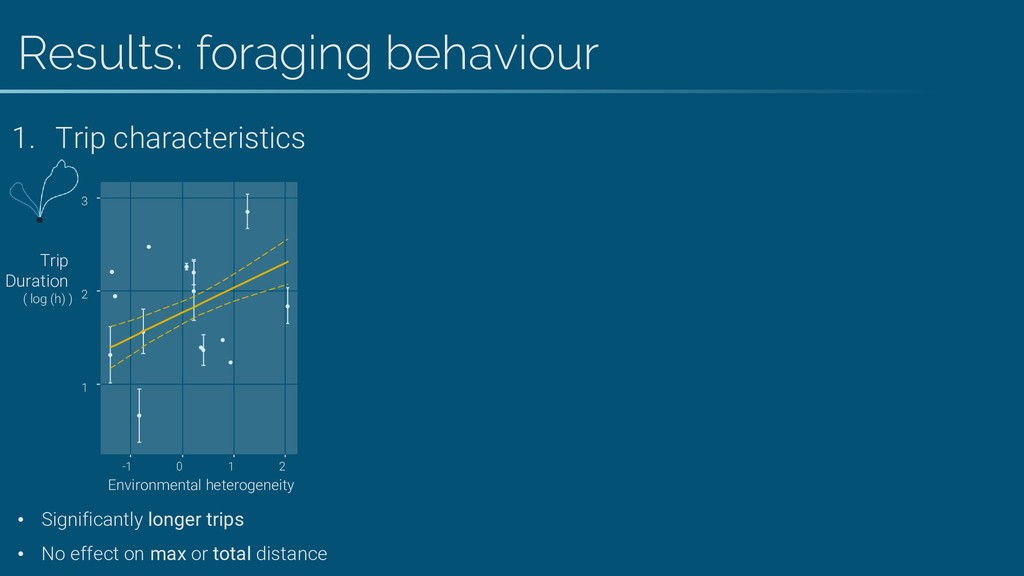
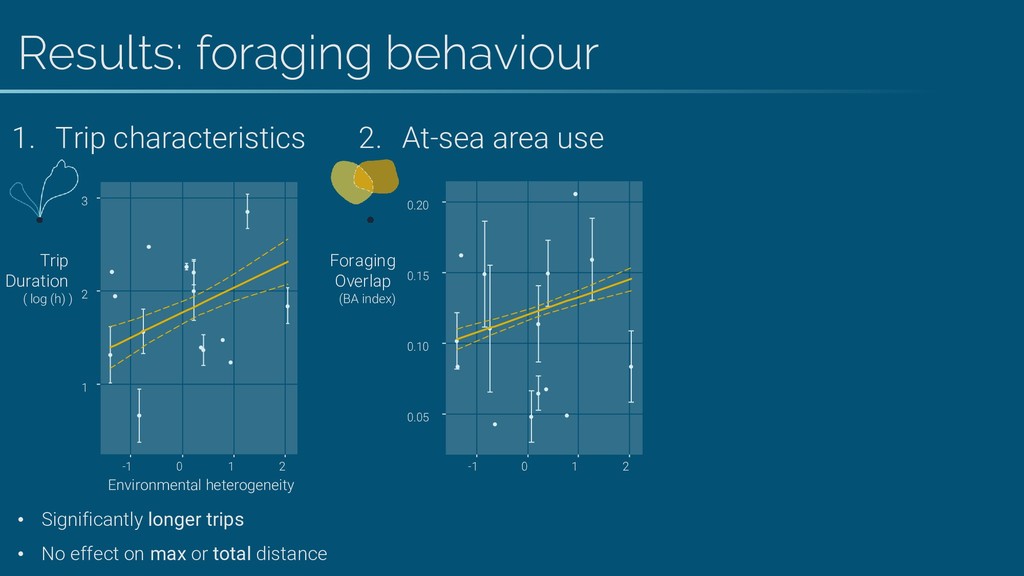
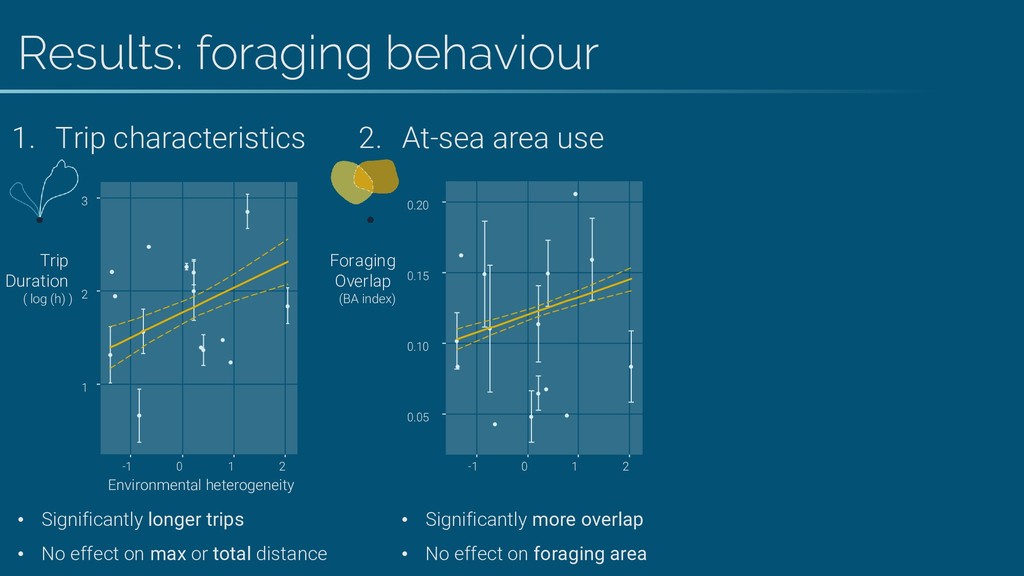
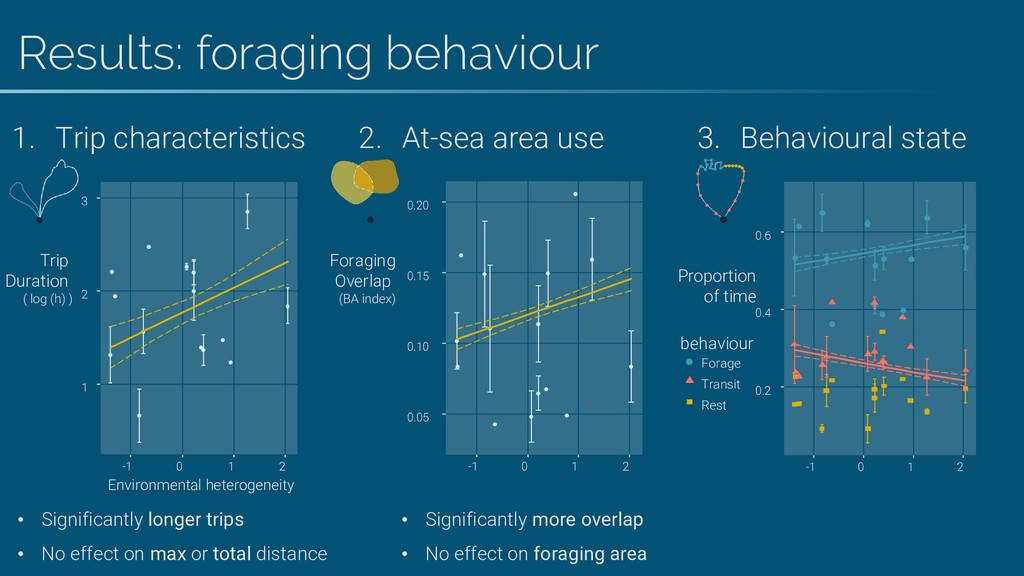
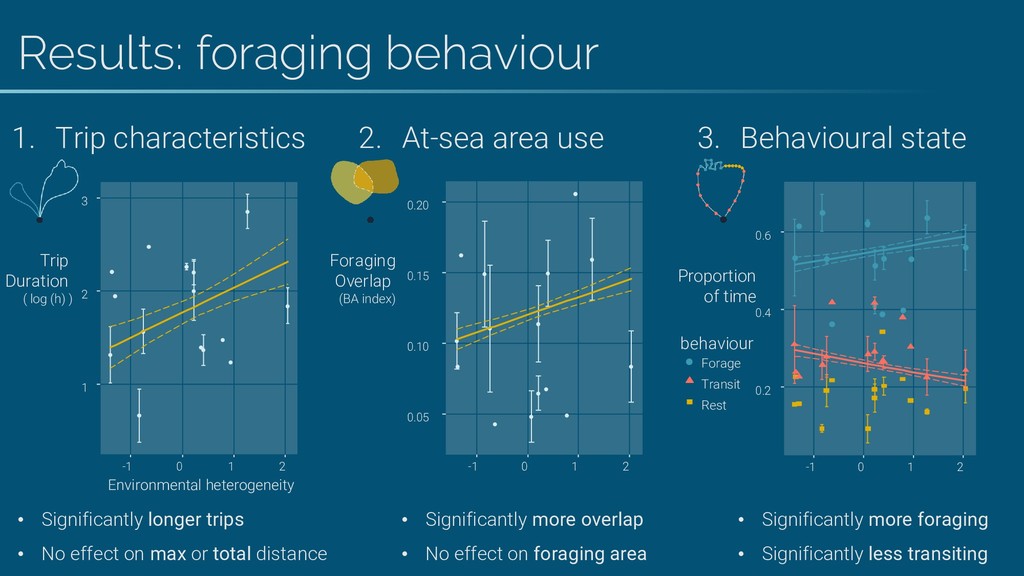
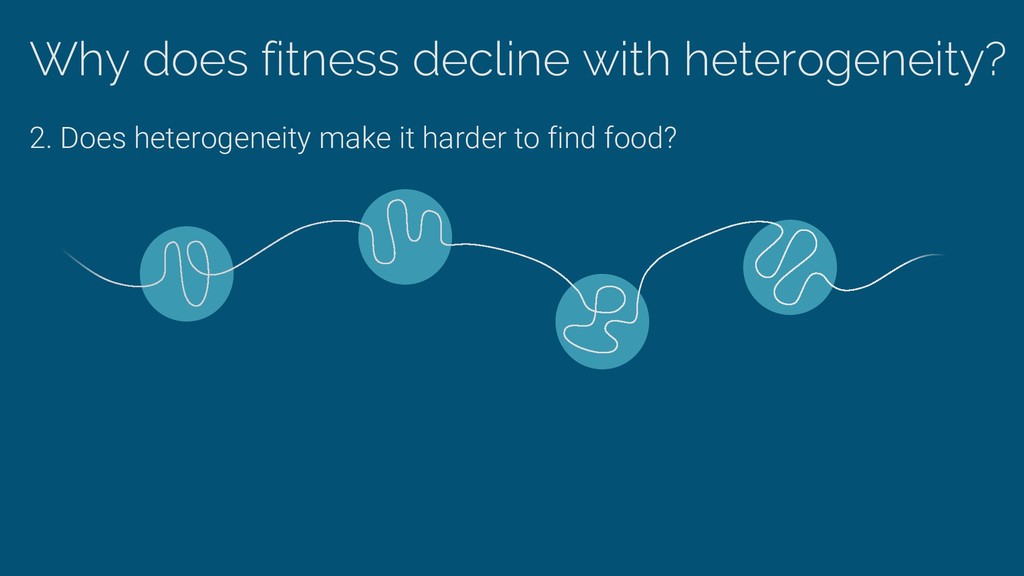
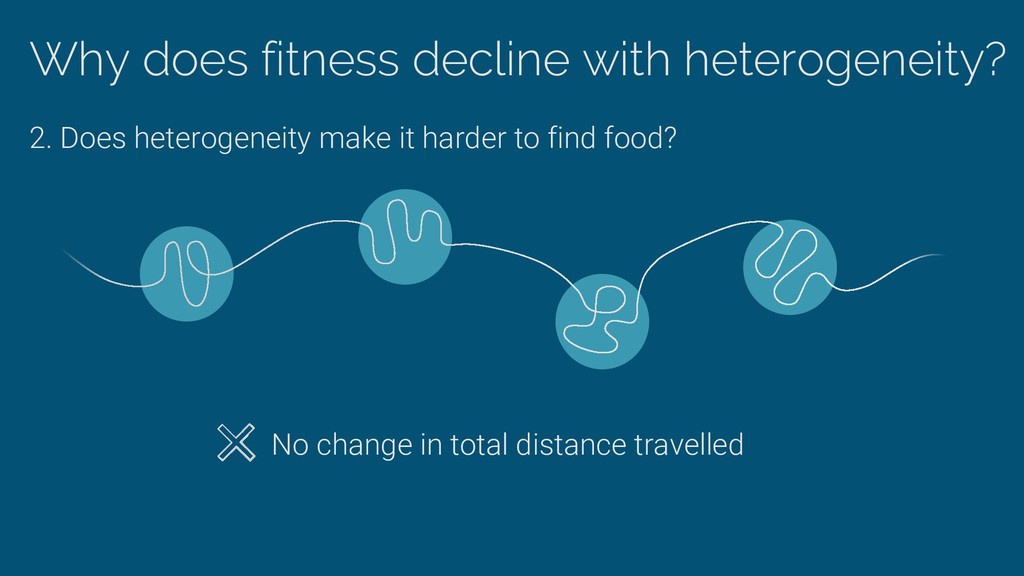
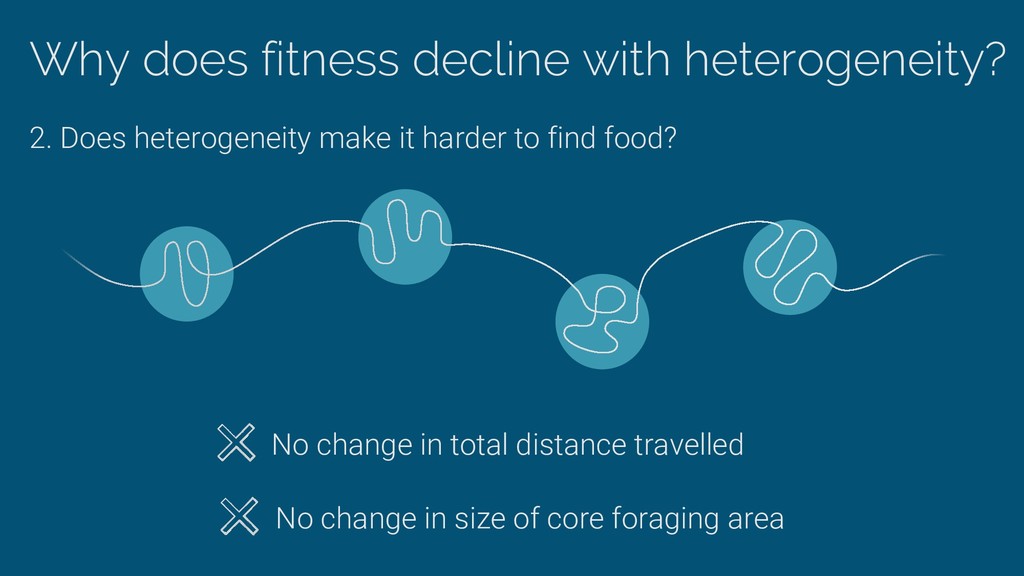
At-sea area use • Size of 50% core area • Overlap between individuals 1. Trip characteristics • Duration • Max distance • Total distance transit forage rest transit
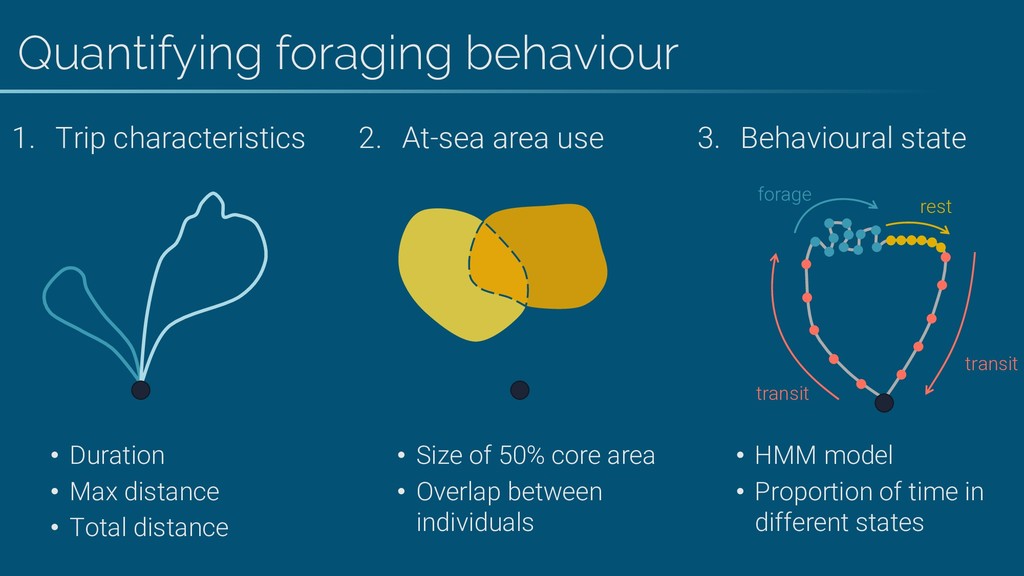
Proportion of time in different states 2. At-sea area use • Size of 50% core area • Overlap between individuals 1. Trip characteristics • Duration • Max distance • Total distance transit forage rest transit
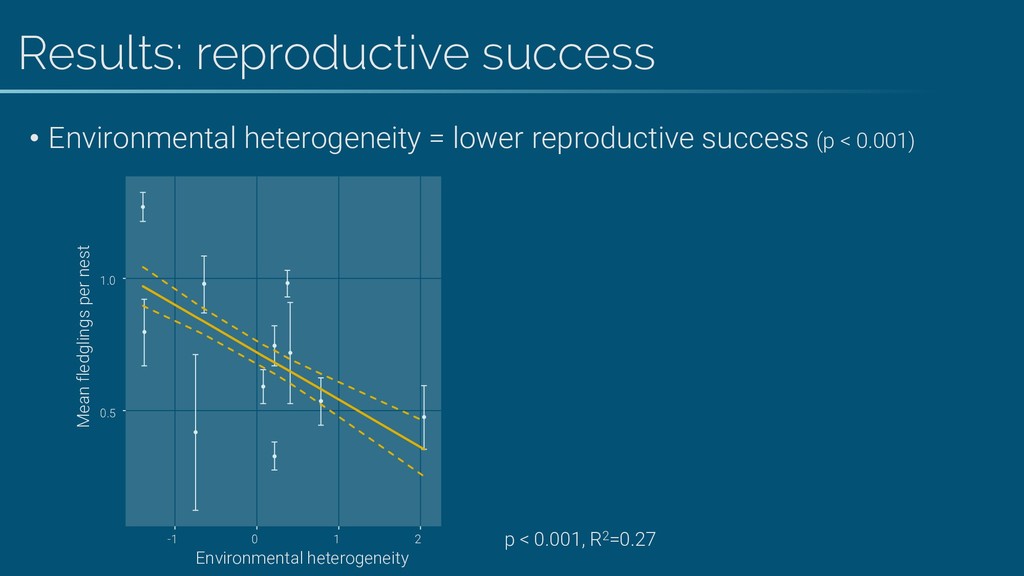
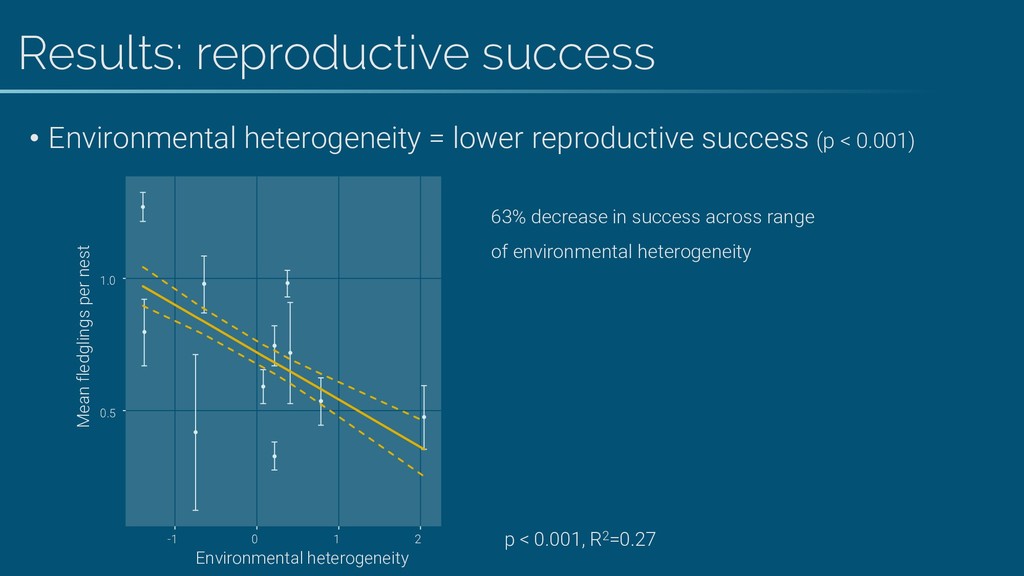
Results: reproductive success 0.5 1.0 -1 0 1 2 p < 0.001, R2=0.27 63% decrease in success across range of environmental heterogeneity Environmental heterogeneity Mean fledglings per nest
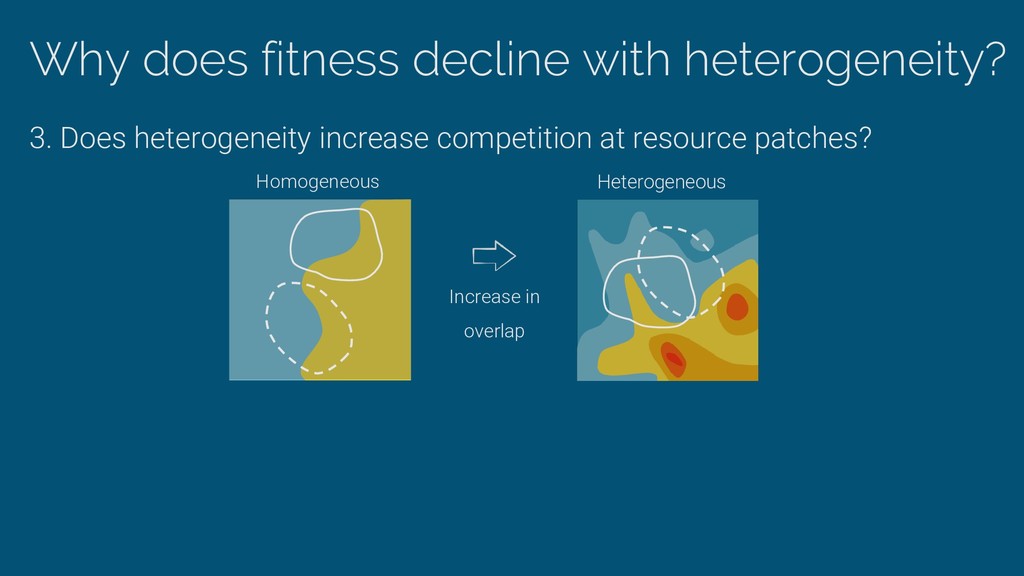
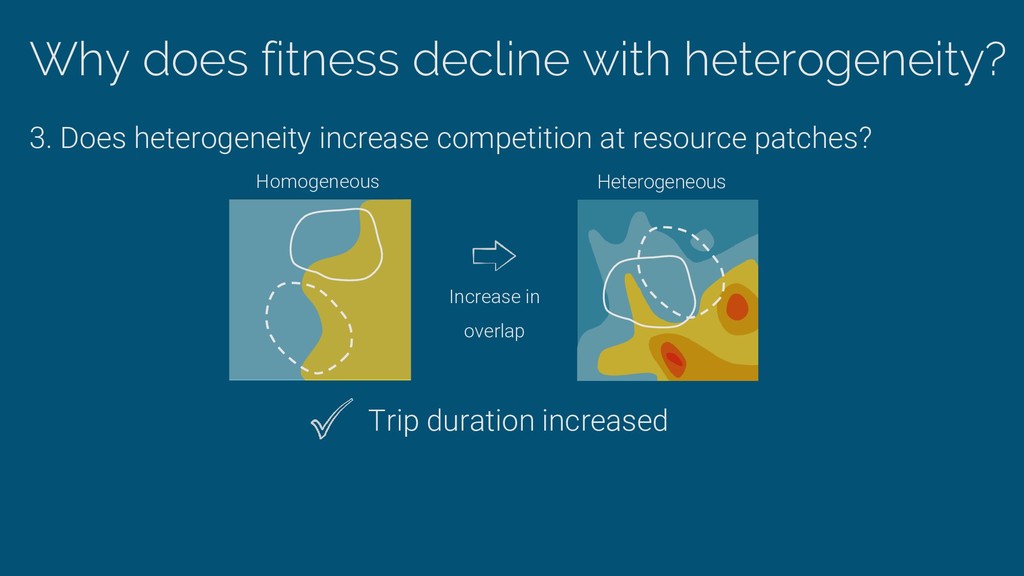
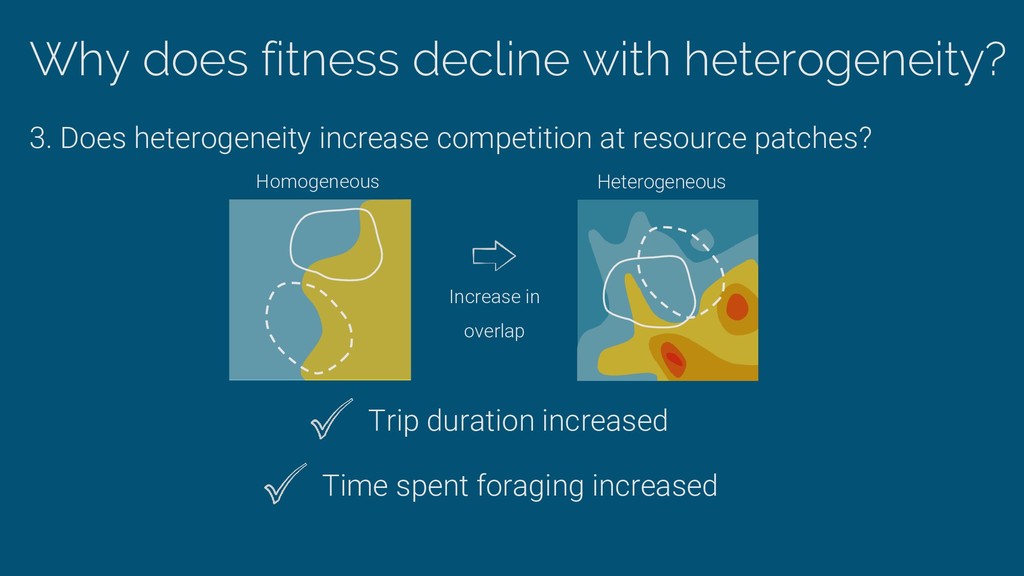
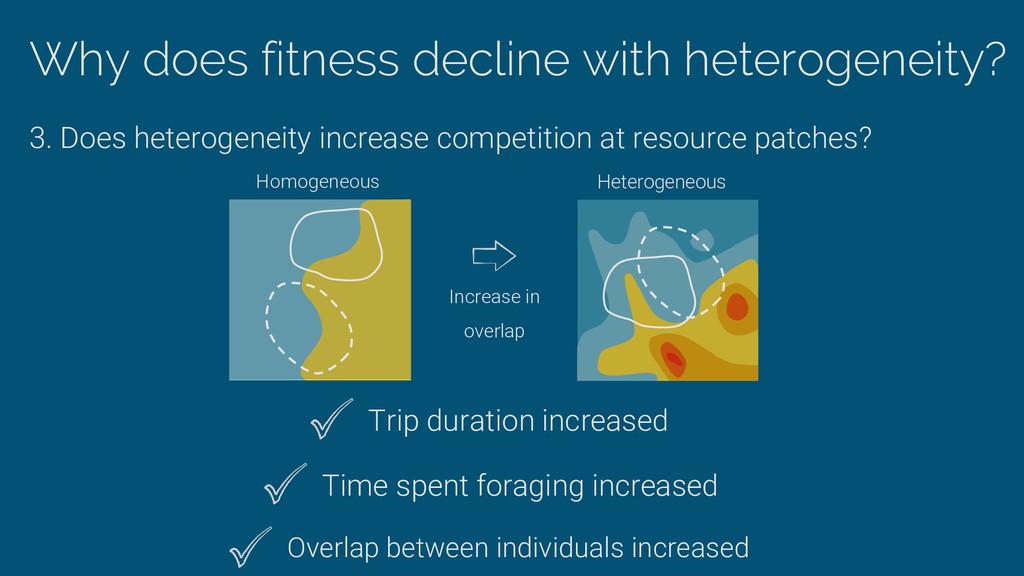
competition at resource patches? Trip duration increased Overlap between individuals increased Time spent foraging increased Homogeneous Heterogeneous Increase in overlap
the field Steve Dodd Matt Wood Ed Stubbings Birgitta Buche Kendrew Colhoun Liam McFaul SEGUL Lots more… Ellie Owen Mark Bolton Ewan Wakefield Kendrew Colhoun Louise Soanes Julia Baer Matthew Carroll Francis Daunt Tim Guilford Roddy Mavor Mark Newall Stephen Newton Gail Robertson Akiko Shoji Steve Votier Sarah Wanless