Upgrade to Pro — share decks privately, control downloads, hide ads and more …

Grade 9 histogram answers

Grade 9 histogram answers

These are answers for the histogram worksheet

Avatar for Alison Tutors

Alison Tutors PRO

October 19, 2026

More Decks by Alison Tutors

Other Decks in Education

Transcript

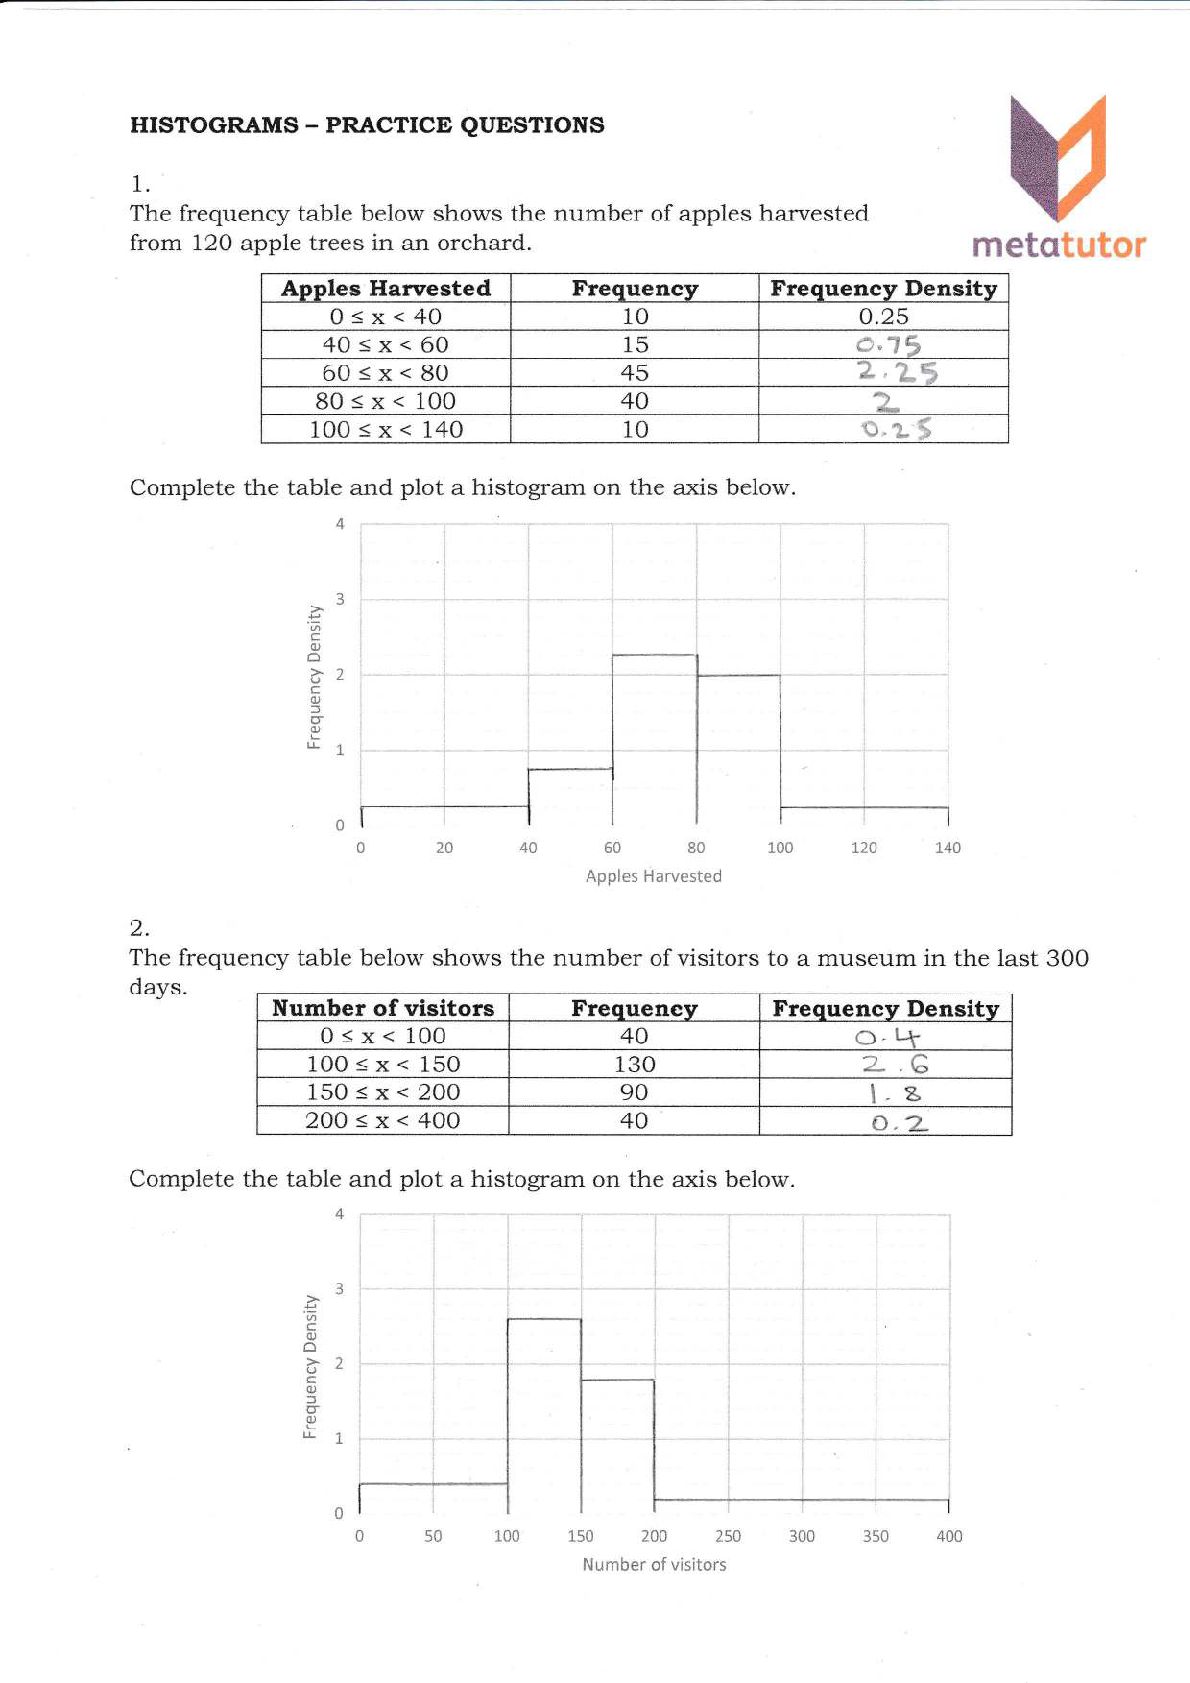
  1. HTSToGRAMS - PRAC?rCE QUESTTONS 1. The irequency table i:elow shours

    the number of apples harvested from 120 apple trees in an orchard. Apples Harrrested 0<x<40 40sx<60 60<x<80 80sx< 100 100<x< 140 Frequency Frequency Density 10 15 4.25 3.)H h.**7 -tJ 40 10 Complete the table and plot a histogram on the axis Lrelow. 4 'q C (u o >.? c o, 5 o o) r1 L 2. The frequency table below shows the number of visitors to a museum in the last 300 days. Number of visitors 0<x< 100 10Osx< 150 150<x<200 2AA<x<400 Frequency Frequency Density 4A o- t+ 130 90 4A l- g Complete the tabtre and piot a histogram on the axis Lrelow. I, f o0) (J c 2 o) 3 u o ! L L 2_ .c
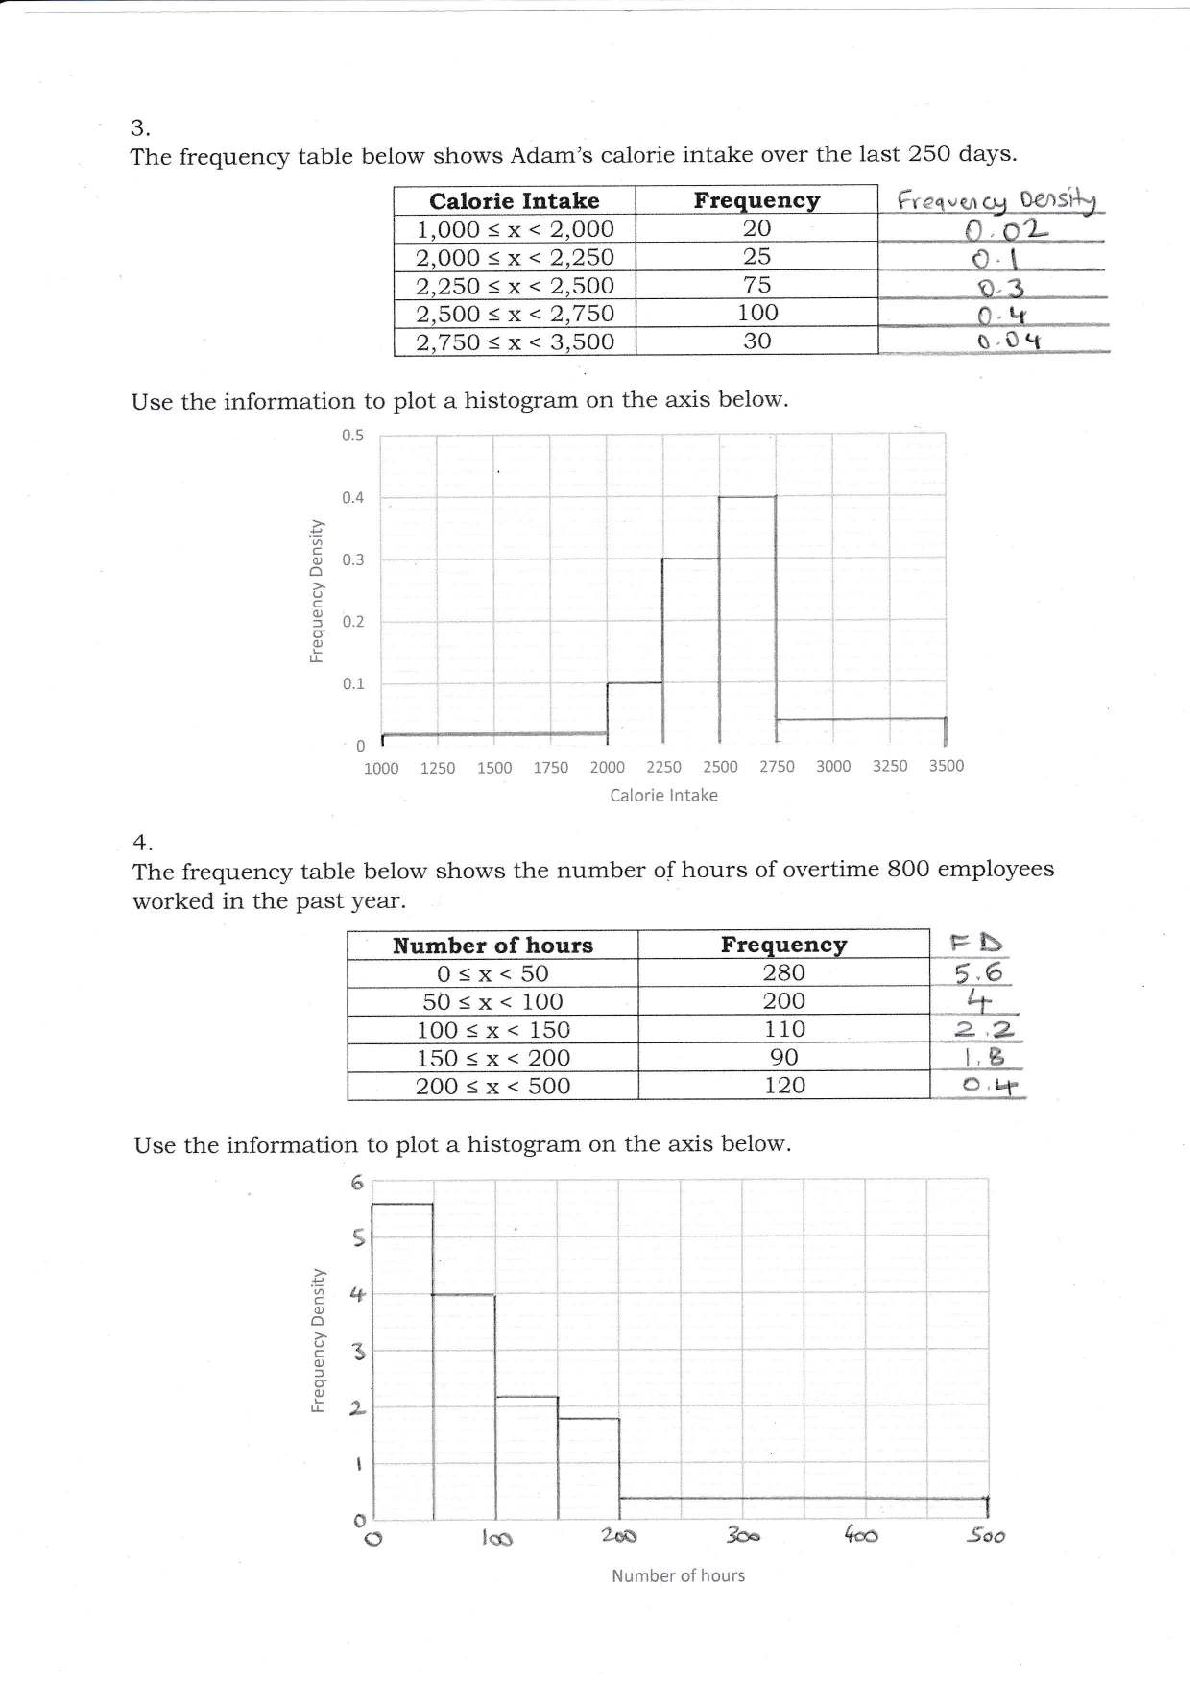
  2. 3. The frequency table below shows Adam's calorie intake over

    the last 250 days. 1,000<x<2,OOA 2,000<x<2,250 2,25A<x<2,500 2.500<x<2,754 2,75A<x<3,500 Use the information to pl.ot a histogram on the axis below. 0.5 0.4 -:l:*: ! i I 'a 6 o.a o I o i C Io o.z - OJ L l! I -T-_ t 0.1 l-000 1250 1500 1750 2000 2250 2s00 2750 3000 3250 3s00 Calorie lntake 4. The frequency table below shows the number of hours of overtime 8O0 employees worked in the past year. Frequency 280 Nurnber of hours 0<x<50 5O<x< 100 100sx< 150 150<x<200 200<x<500 2AA i10 90 120 Use the information to plot a histogram on the axis beloi,v" 5 .t oo) o c 0) 4 3 E 0) uL t I o r-.- o 24o 3c. Number of hours i:: |"'r 6.4 t
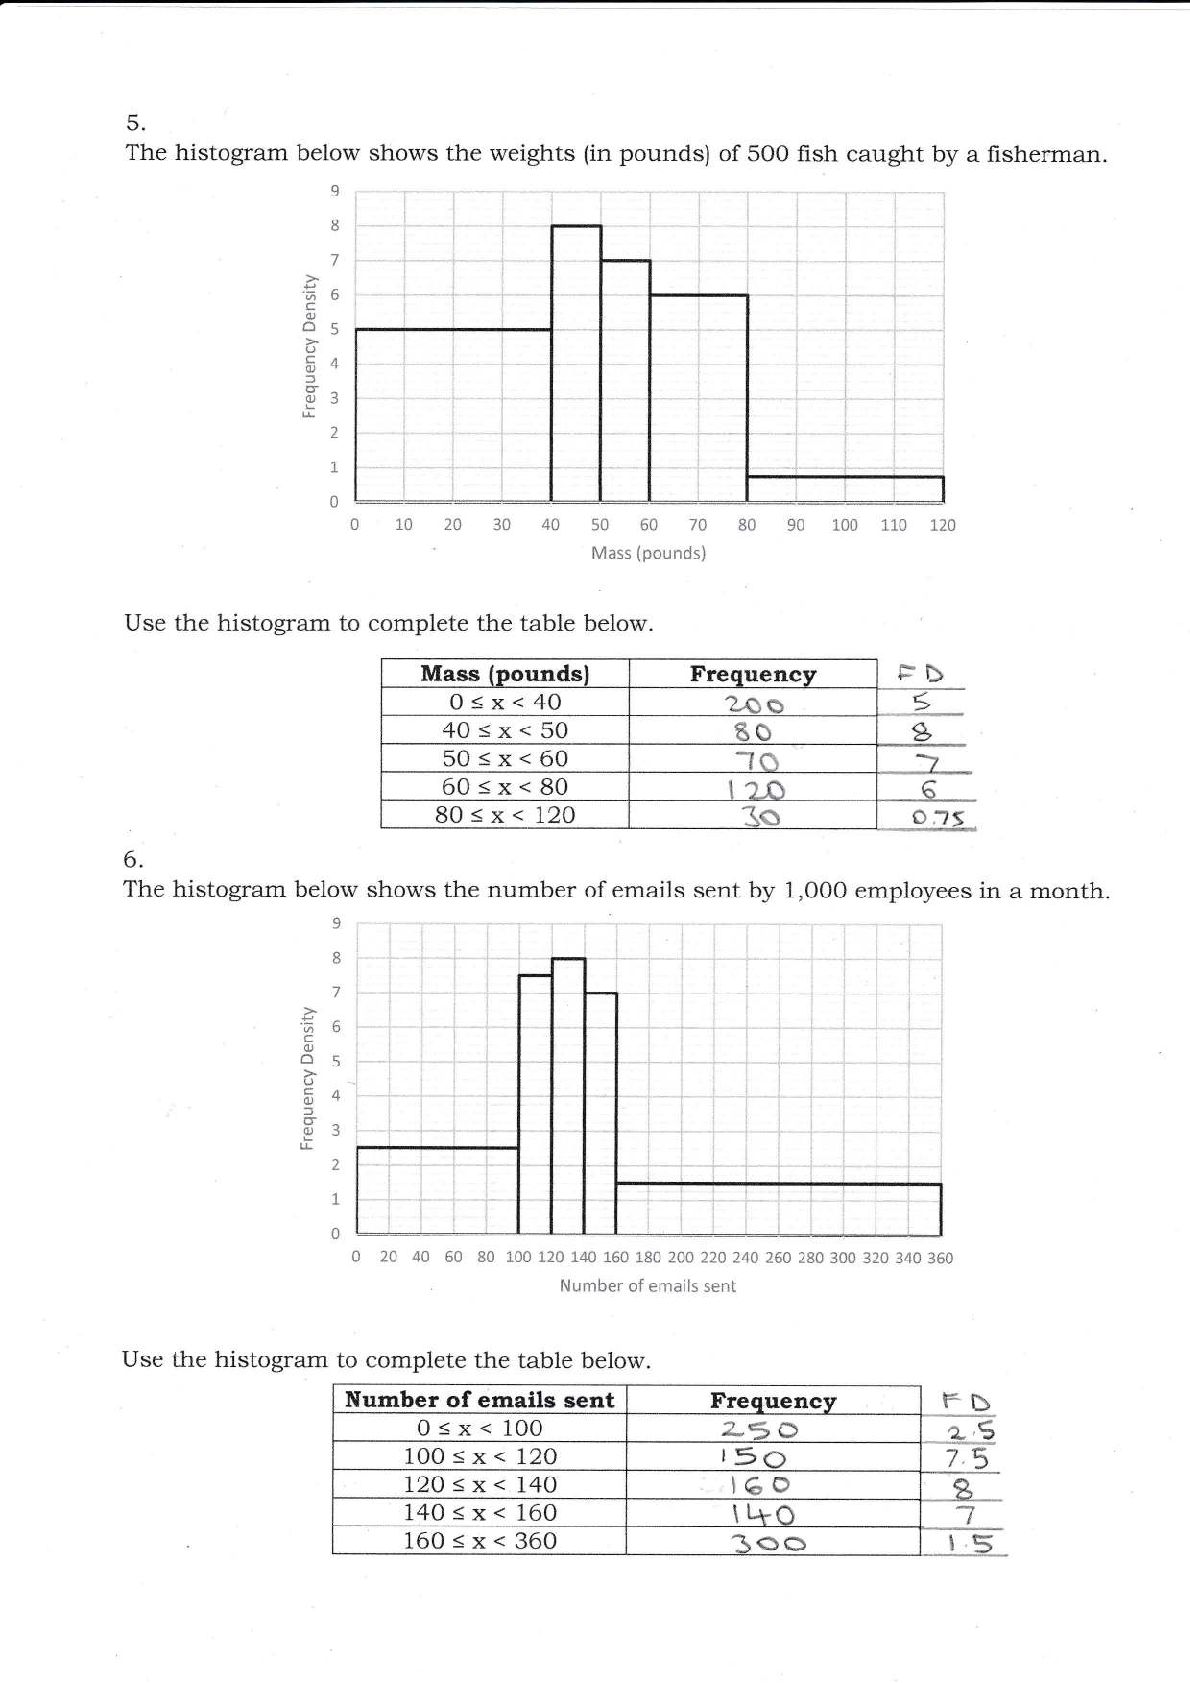
  3. 5. The histogram belorn, shows the weights (in pounds) of

    500 fish caught by a fisherman. , 8 ;oO 7 c a5 0) (J 64 (t^ EJ L 1 ! 0 50 60 80 90 100 110 70 Mass (pounds) Use the histogram to complete the table belor,v. Mass {pounds} 0sx<40 40sx<50 50<x<60 60sx<80 80<x<724 F requency trb ,-'. t". t, .- &* t\;' 1?f} _,1_* *} o,? o:71 6. The histogralrr below shows the number of emails sent by 1.000 employees in a month. I 8 7 ,6 c 5 u o 5 u C) = 5 o L t! 4 3 2 1 0 0 20 40 60 80 L00 L20 L40 160 180 200 220 240 260 280 300 320 340 360 Number of emails sent Use the histogram to complete the table below. l{umber of emails sent O<x< 100 100sx< 120 120<x< 140 144<x< 160 160<x<360 Freqr.lencv ..,1 .r'-, 1--':, 15(^) 160 I L+O joo r*3 L,9 7.5 -7
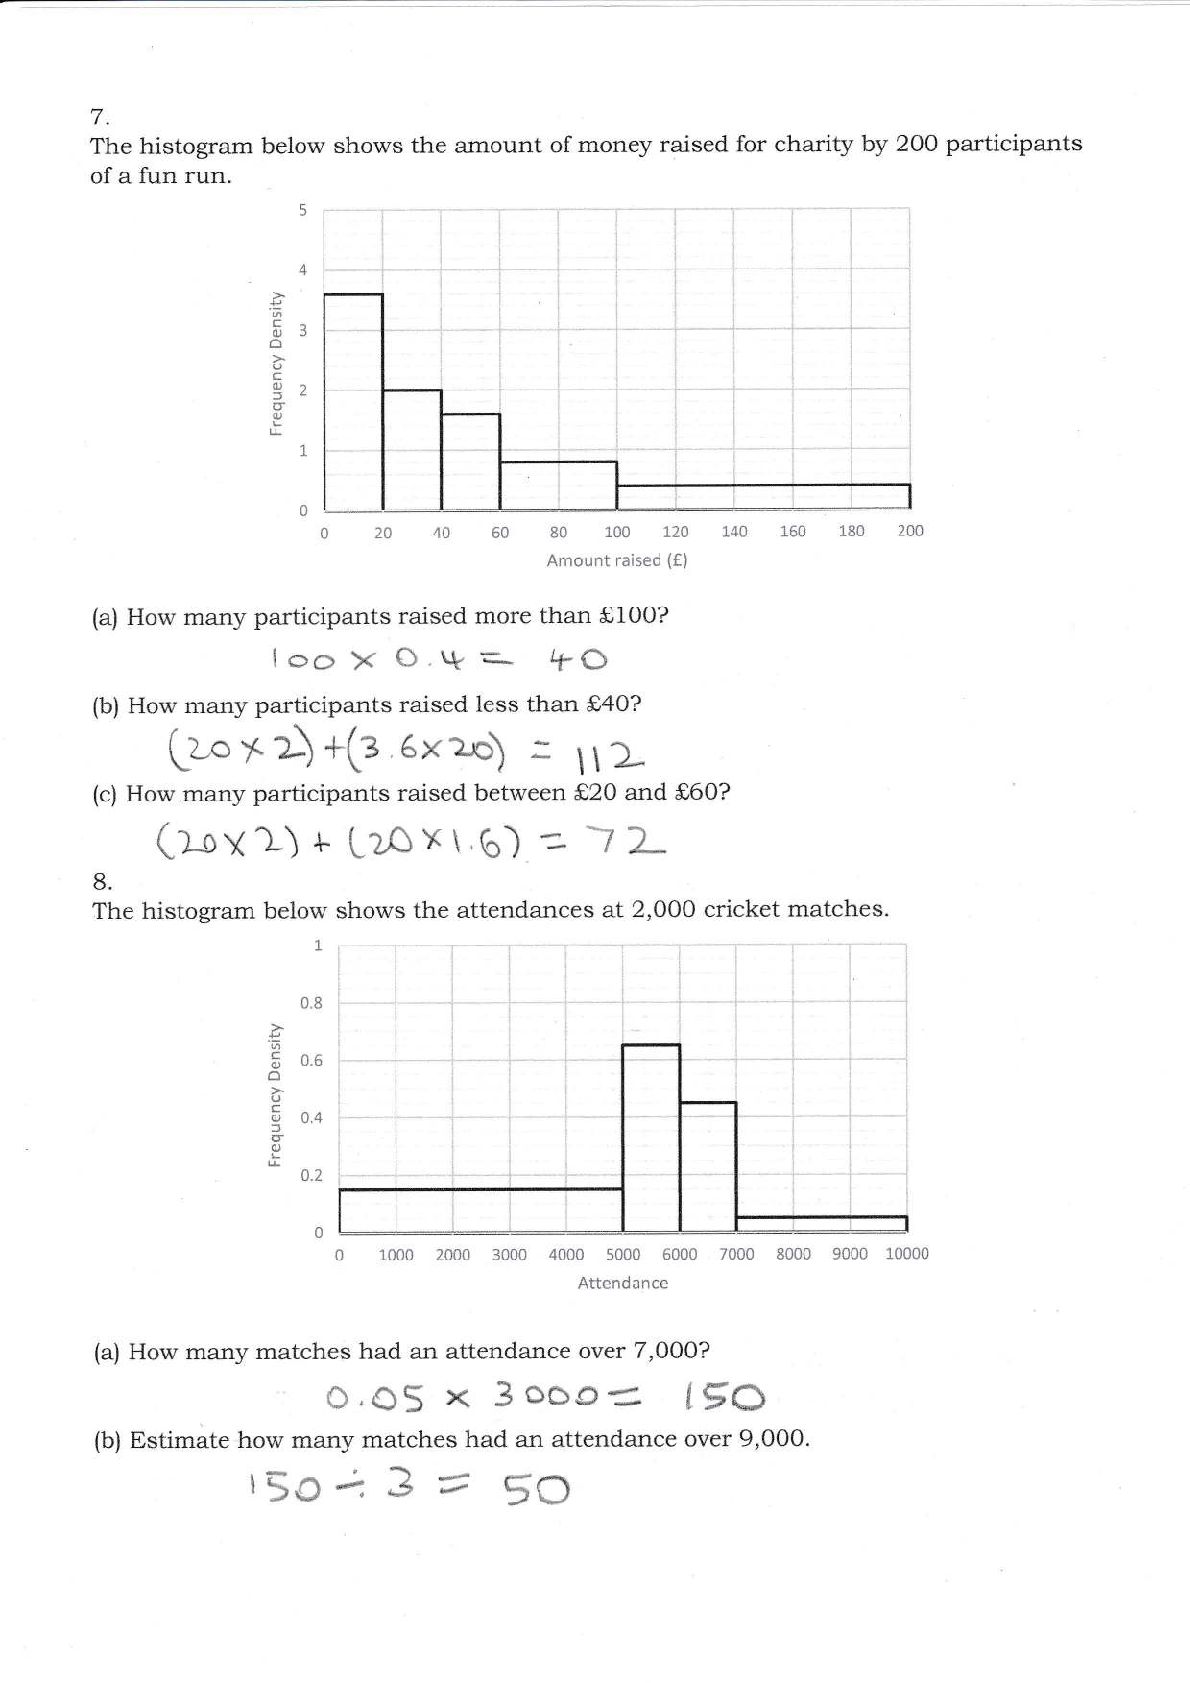
  4. 7. The histogram below shows the amount of money raised

    for charity by 2OO participants of a fun run. \j rlil lItt ,!6 c^ o)J o iitt L, itll ttli t*.-i C O1 5 u I{ti i!!i tll! tttl t =1 0.) ! I I i I o 20 40 50 I I - _i_ t_-_i- 1 0 "L 80 100 r20 140 1"60 L80 200 Amount raised (€) (a) How many participants raised more than S10O? loo X O.qr a- +O (b) How many participants raised less than S40? G^ r A +(3 6xzro) :- lt 2. (c) How many participants raised betweea S20 and S60? (:-o Y a) + L?,O x \, (c) z *7 L 8. The histograrn below shows the attendances at 2,OAO cricket matches. l ttl ttt ttt t!l .e o3 _L___l-* iii 0.6 3 o.a tii o I u :f (t ! L t 0.2 i t i\ I I i 0 , 0 I t i 1000 2000 3000 4000 5000 6000 7000 8000 9000 10000 Attendance (a) How many matches had an attendance over 7,0OO? o,o5 x 3ooo= lEi() (b) Estimate how many matches had an attendance over 9,000. r5o{ 3 n 50
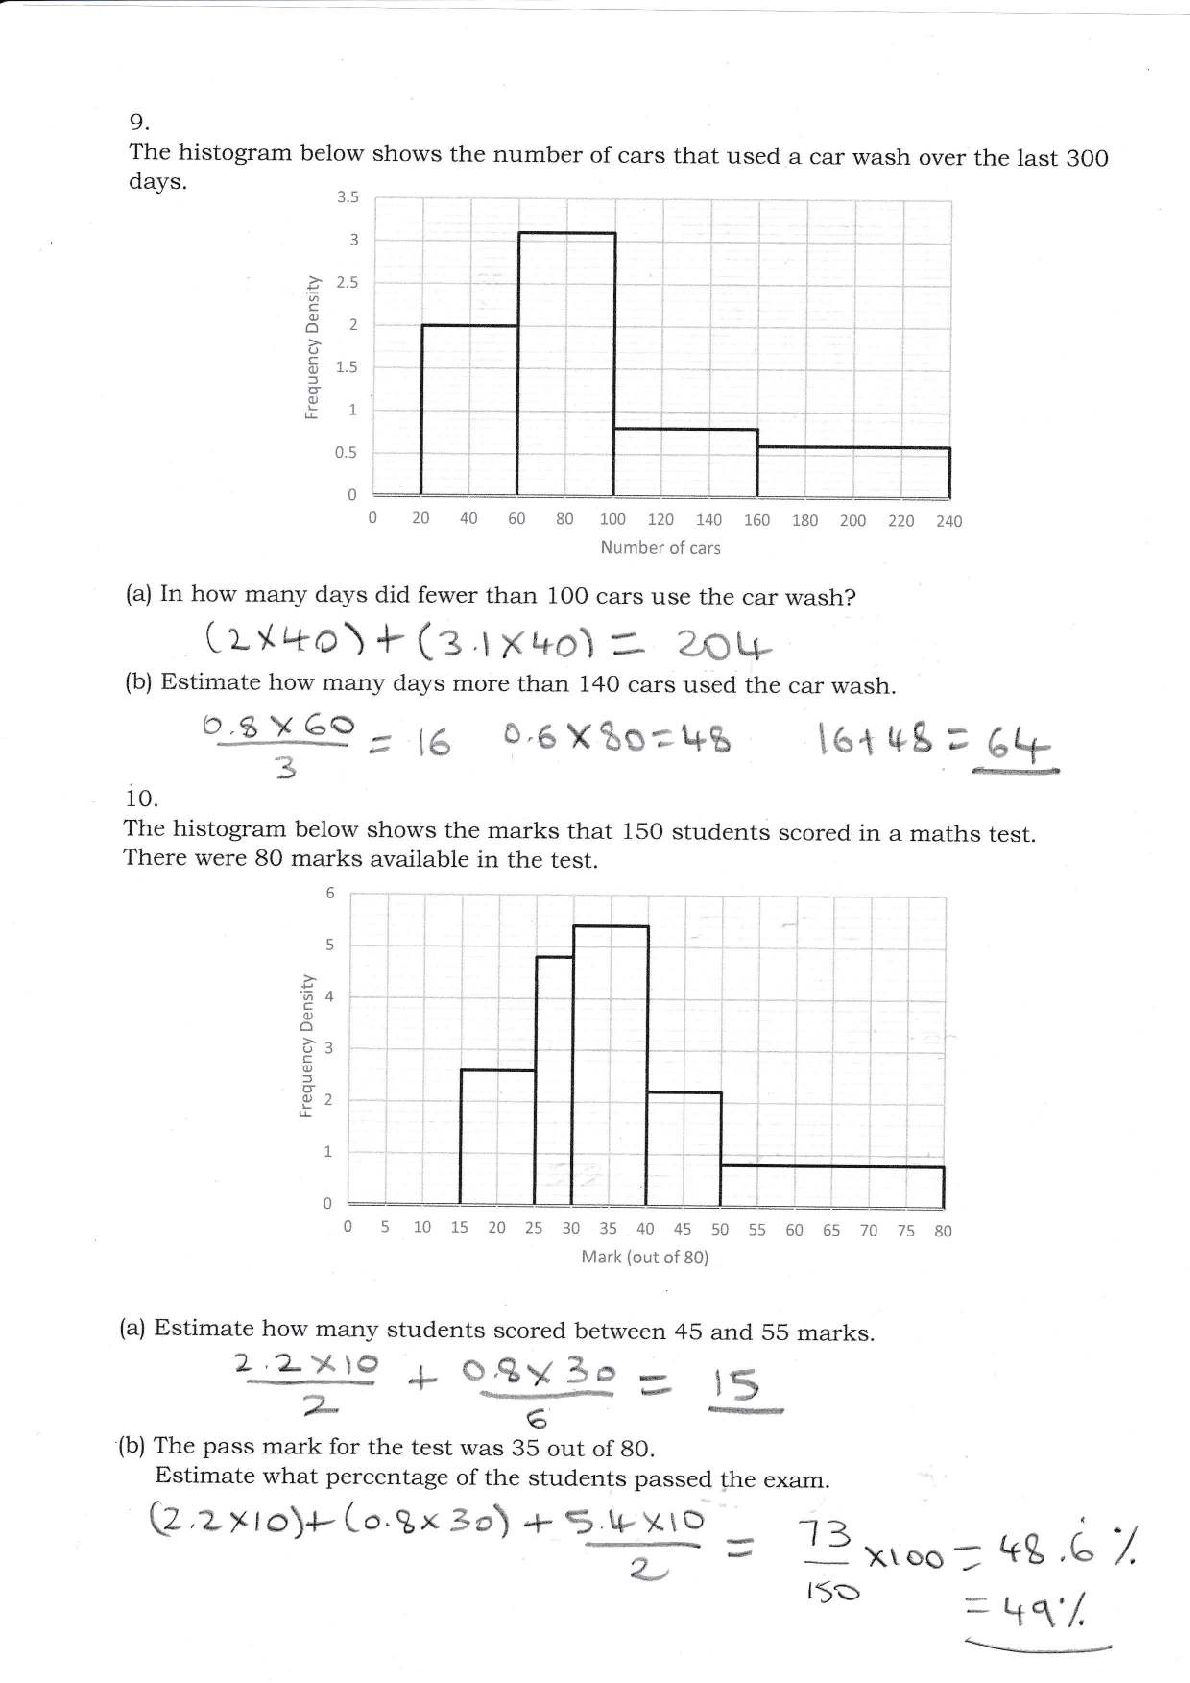
  5. 9. The histograrn belorn' shows the number of cars that

    used a car wash over the last 300 days. :1. l: "?-_l5'.:I--."_--'..- lit iitl 3 i 2.5 f i C 0., o 2 i (J c I 1.5 OJ f 5 o j 1. L I ,. ] i 0.5 i 0 0 20 40 60 80 100 120 t40 160 180 200 220 240 Number of cars (a) In horn, many days did fewer than 1OO cars use the car wash? (:-* +a) + (:.l x'+o) = z,or+ (b) Estimate how many days more than 140 cars used the car wash. o.g-xSg r 3 o.6 X to L6 lot tr"g ; 6+ ""trB 10. The histogram below shows the marks that 150 students scored in a maths test. There were 8O marks available in the test. **T--t II 5 .t c 4 o 0.) I 3 J I ! I I --r- i i 0) i f (t ) I L I I I ;I 1. 0 tltlii i L-J-rl ; o) * I _ .;".__-.t--__r_l I I 0 5 10 15 20 25 30 35 40 45 50 55 8il Mark (out of 80) ,# (a) Estimate horn, many students scored between 4s and 55 marks. + o:3l-}s = E (b) The pass mark for the test was 35 out of 80. Estimate in hat percentage of the students passed the exam. Q,zxro)+- (o.B x 3o) -r A t+-xro _ 13 r u -l5o X\OO = kg,6 7. = \\'/. <-"------"--"-'
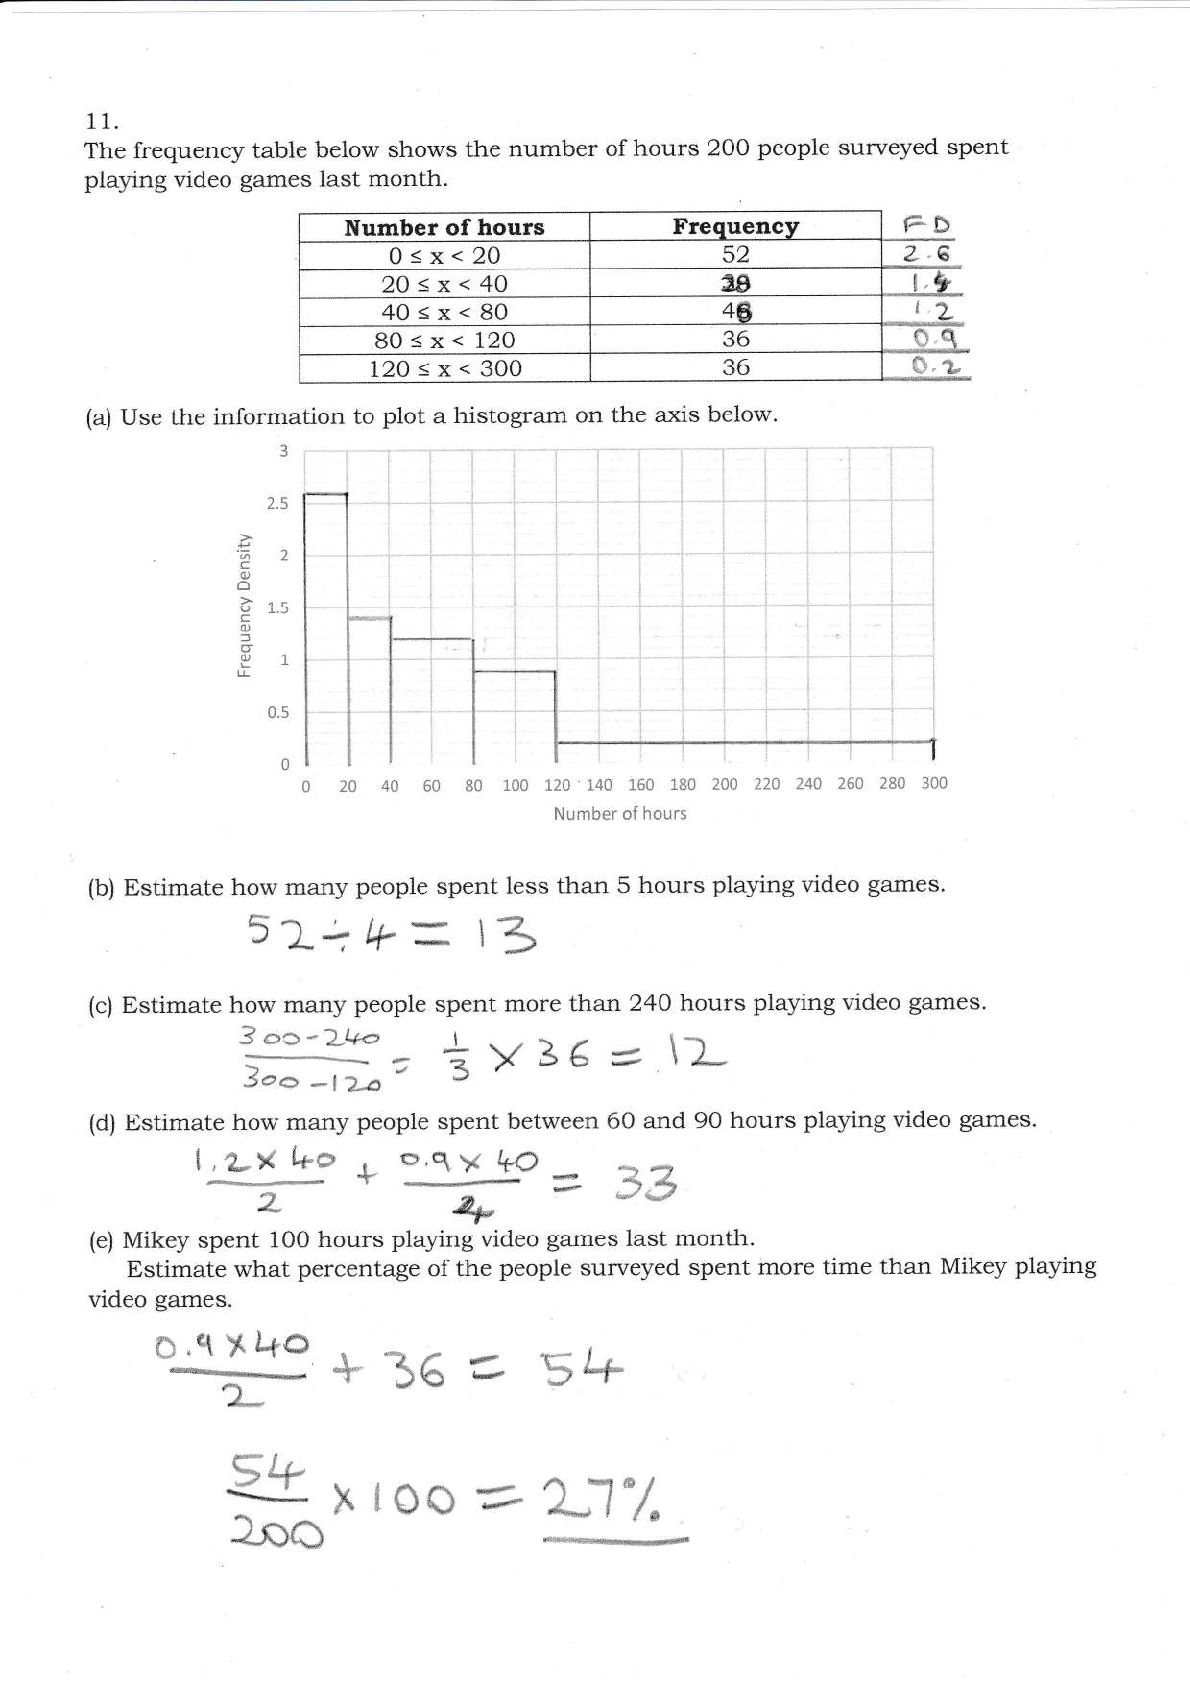
  6. 11. The frequency table below shows the number of hours

    200 people surveyed spent playing video games last month. Number of hours Frequency 0<x<20 20<x<44 40sx<80 52 ff"* 2.8 e8 46 80sx<12O 36 36 72Q<x<300 (a) Use the informalion to plot a histograrn on the axis below" 3 2.5 .: c 2 I 1.5 o0) o) f, o r t C) L 0.5 0 0 20 40 60 80 100 L20'3.40 160 180 200 220 240 264 Number of hours {b} Estimate how many people spent less than 5 hours playing video games. 5z1t+= t3 {c} Estimate horn,many people spent more tha::.240 hours playing tideo games. 3 oc *L+a 3oa *l2A ? u t YzG = \2- (d) Estimate how rnany people spent between 60 and 9O hours playrng video galnes. 1,L*ho r o,qxrc 3_3 (e) Mikey spent 100 hours playing video garnes iast month. Estimate what percentage of the people surveyed spent more time than Mikey playing video games" ry+36=y4 x too * x"/" 2rsO 4-- J,* \1, =r.ryI-
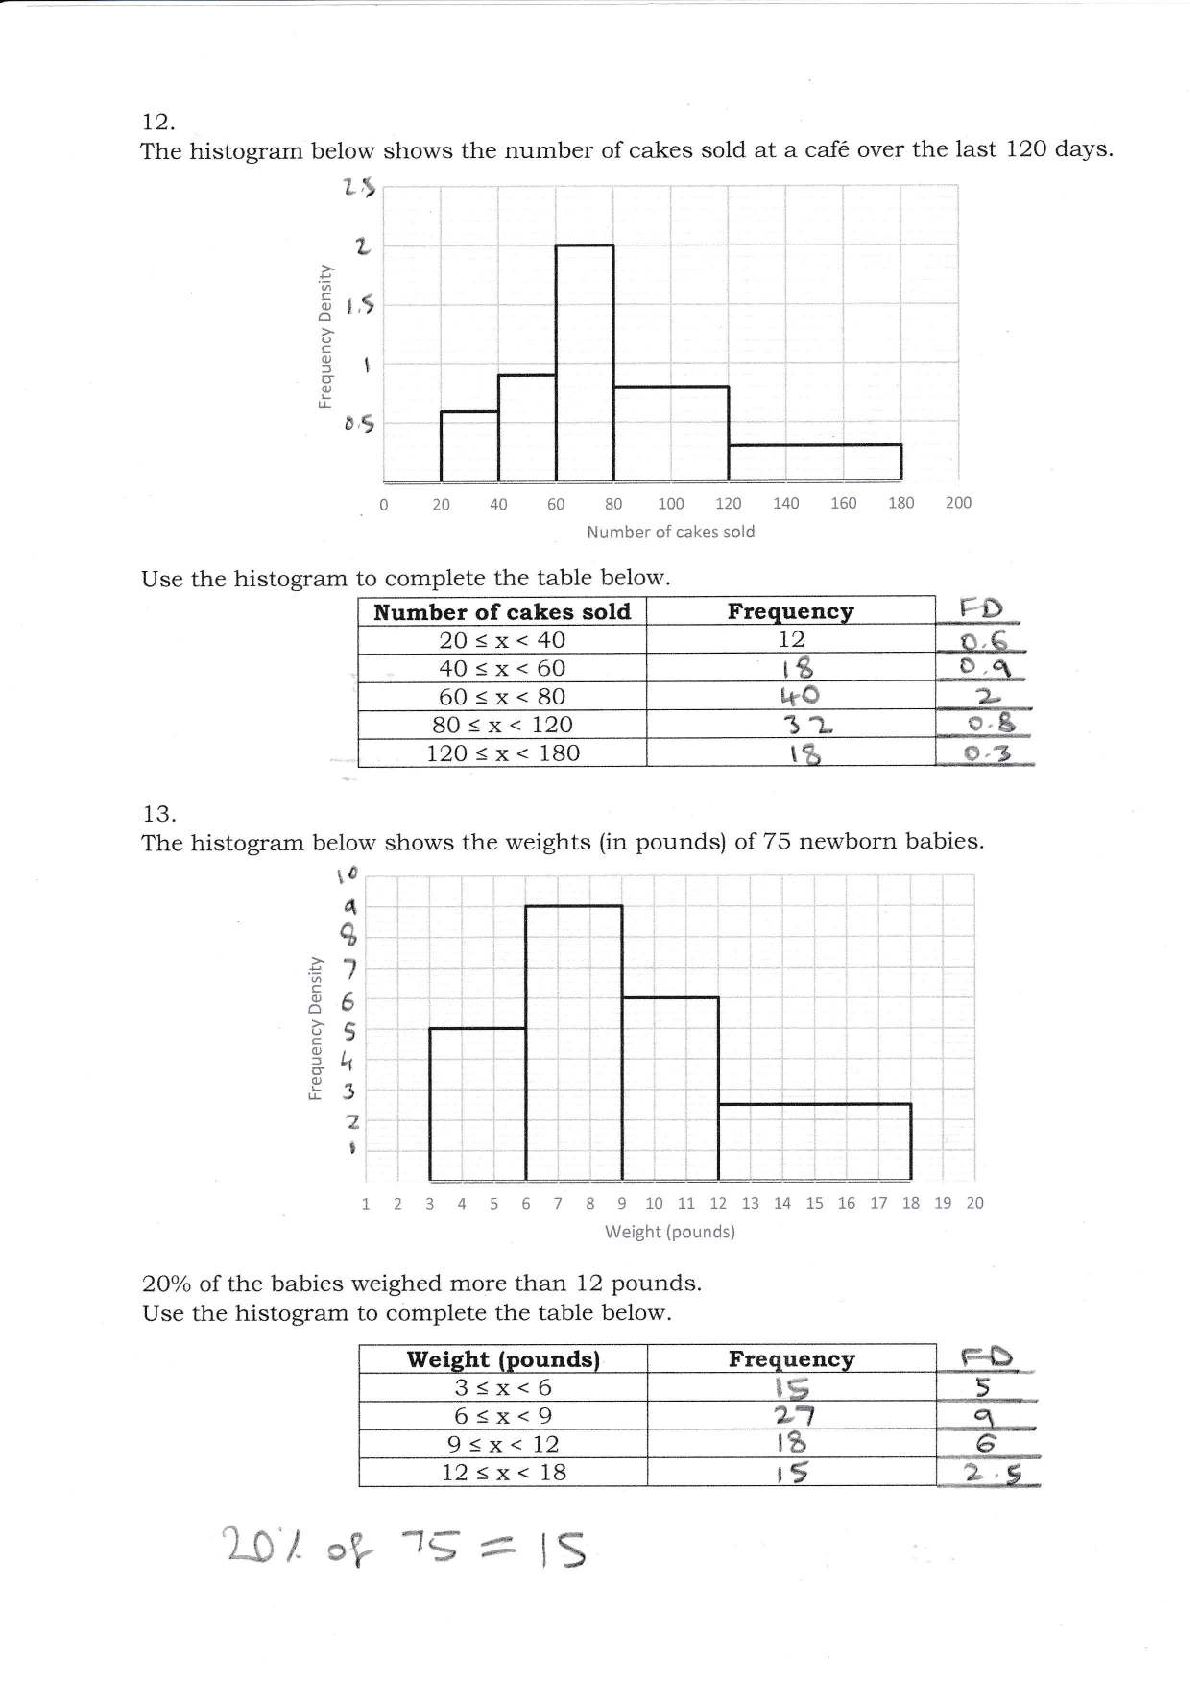
  7. 12. The histogram below shows the number of cakes sold

    at a cafe over the last 120 days. L2 L P a t,t C (U I I c 1 c) f .'",.-.---'"j I o o i i ! tt ! i i i 0,9 l i 20 40 . 0 80 100 120 1,40 60 200 Number of cakes sold Use the histogram to complete the table below. Number of cakes sold Frequencv 2O<x<44 fLl 12 40<x<60 60<x<80 80<x<12A 120<x< 180 t ';... :.i 1... ia-., l 13. The histogram below shows the weights (in pounds) of 75 newborn babies. t,{ ."1 t" .t o l, ,J Cf t:, o c i' ) 0) f o OJ L L t i iiL. 1234 .: 56789101112L3L4 Weight (pounds) 2A'% af the babies'"r,,eighed more than 12 pounds. Use the histogram to complete the table beiow. Weight {poundsl 3<x<6 6<x<9 9<x<12 12<x< LB L0'/ aV '7E, * lS Frequency {- i"} i7 ! ii; )5 (
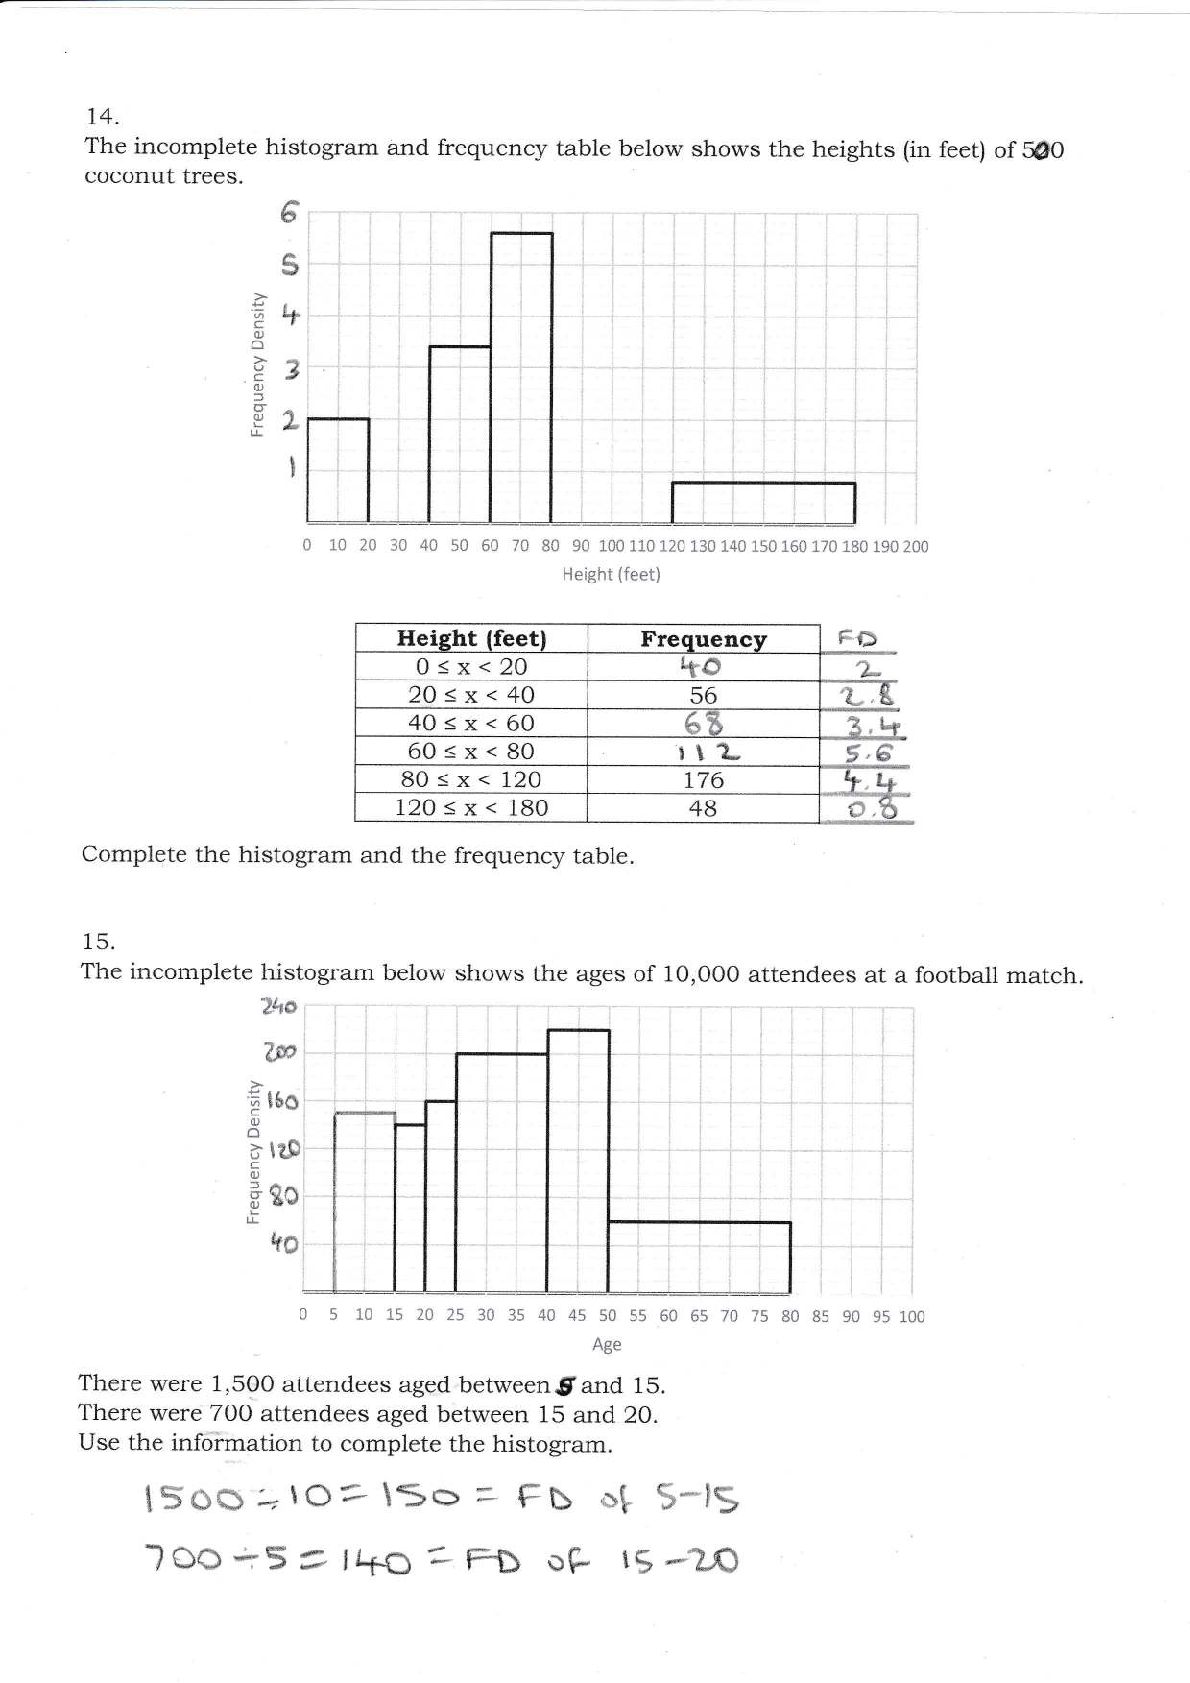
  8. 14. The incomplete histogram and frequency table beiow shows the

    heights (in feet) of 5f,0 coconut trees. 6i-'r 5 .t oc) U 0) (l, L + 3 L I 70 80 90 100 110 120 130 140 L50 160 170 180 190 200 Height (feet) Heieht {feet} Frequency O<x<20 ; i,i ii: i 2A<x<4O 40<x<6O ! (. 56 It2- 60sx<80 80<x<124 l2Os x< 180 176 48 €-l . Complete the histograrn and the frequency table. 15. The incomplete histogram below shows the ages of 10,000 attendees at a football match. Wo:"' i"_*]-I , III Itl w tl! i__r_i. ttt H t60 -r?p c i-t II tl iso i--i tr0 i-.*-l o) o ti o) ii L tiil 1ti: 0 5 10 1s 20 25 30 35 40 45 s0 55 50 6s Age There were 1,500 attendees aged between.$ald 15. There were 7OO attendees aged between 15 and 20. Use the information to complete the histogram. ISO$; iO= 15q = trb e! S*|S -?oo +5, l+O z F5, Df- g *:2sg iiri 85 90 95 100
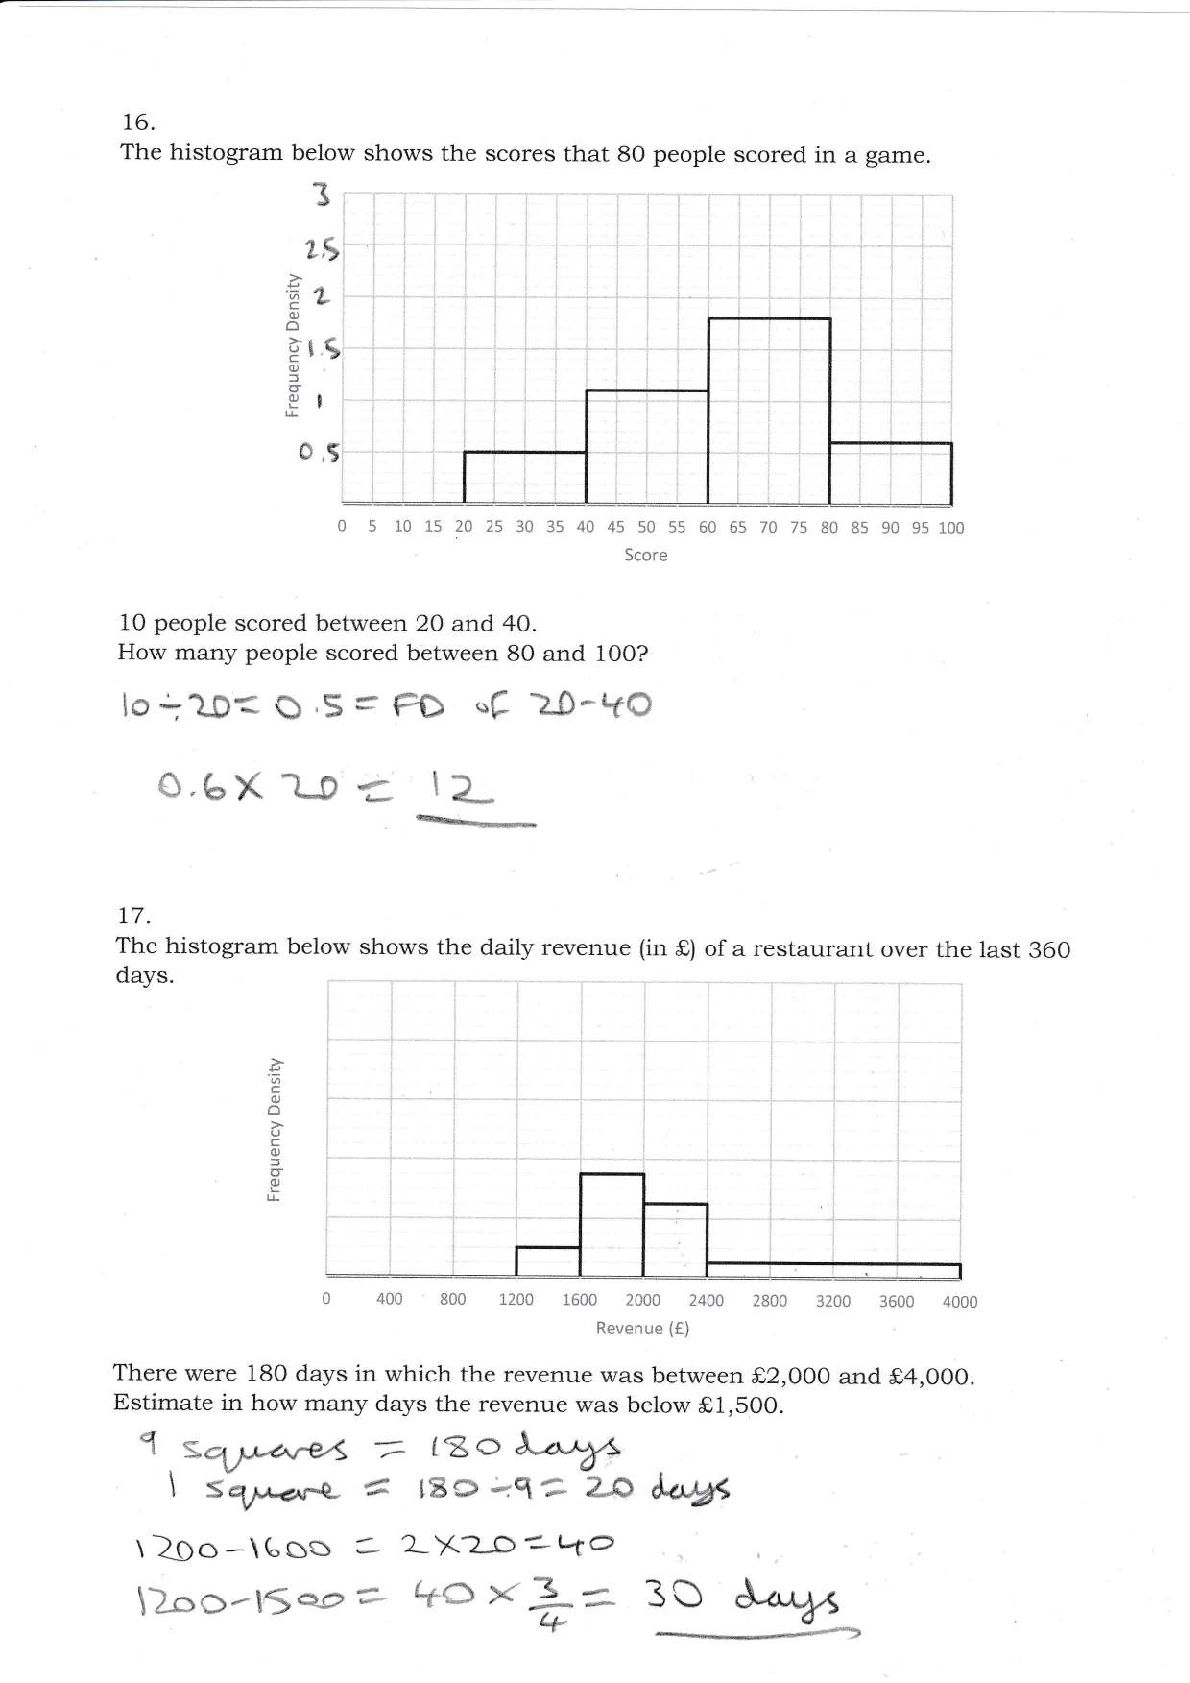
  9. \6. The histogram below shows the scores that 8o people

    scored in a game. T"!F.,!*"."r-_-T*_.r','&,r--."} e ,J c(u o U o 3 g OJ L r 45 50 55 60 55 70 75 80 85 90 Score 1O people scored between 20 and 4A. How many people scored between 80 and 10O? lo -zD= Q .s = FD o.6x'l--0 z "f ?$-to t1 -rre 77. The histogram Lrelow shows the daily revenue (in S) of a restaurant over the last 360 days. '6 o o U c o) f u o I 0 400 800 1200 1600 2000 2400 2800 3200 3600 4000 Revenue (f) There were 18O days in which the revenue was between €2,OO0 and S4,0OO. Estimate in how many days the revenue was below S1,5O0. q, t8O 4 = =n1ot^t+s i s aft<F.- = 18() -a? 2A A*,,t S \ 2oo -\tos ? 2-X2-O --qo l)sg--tgaoa 4a**= 3C W
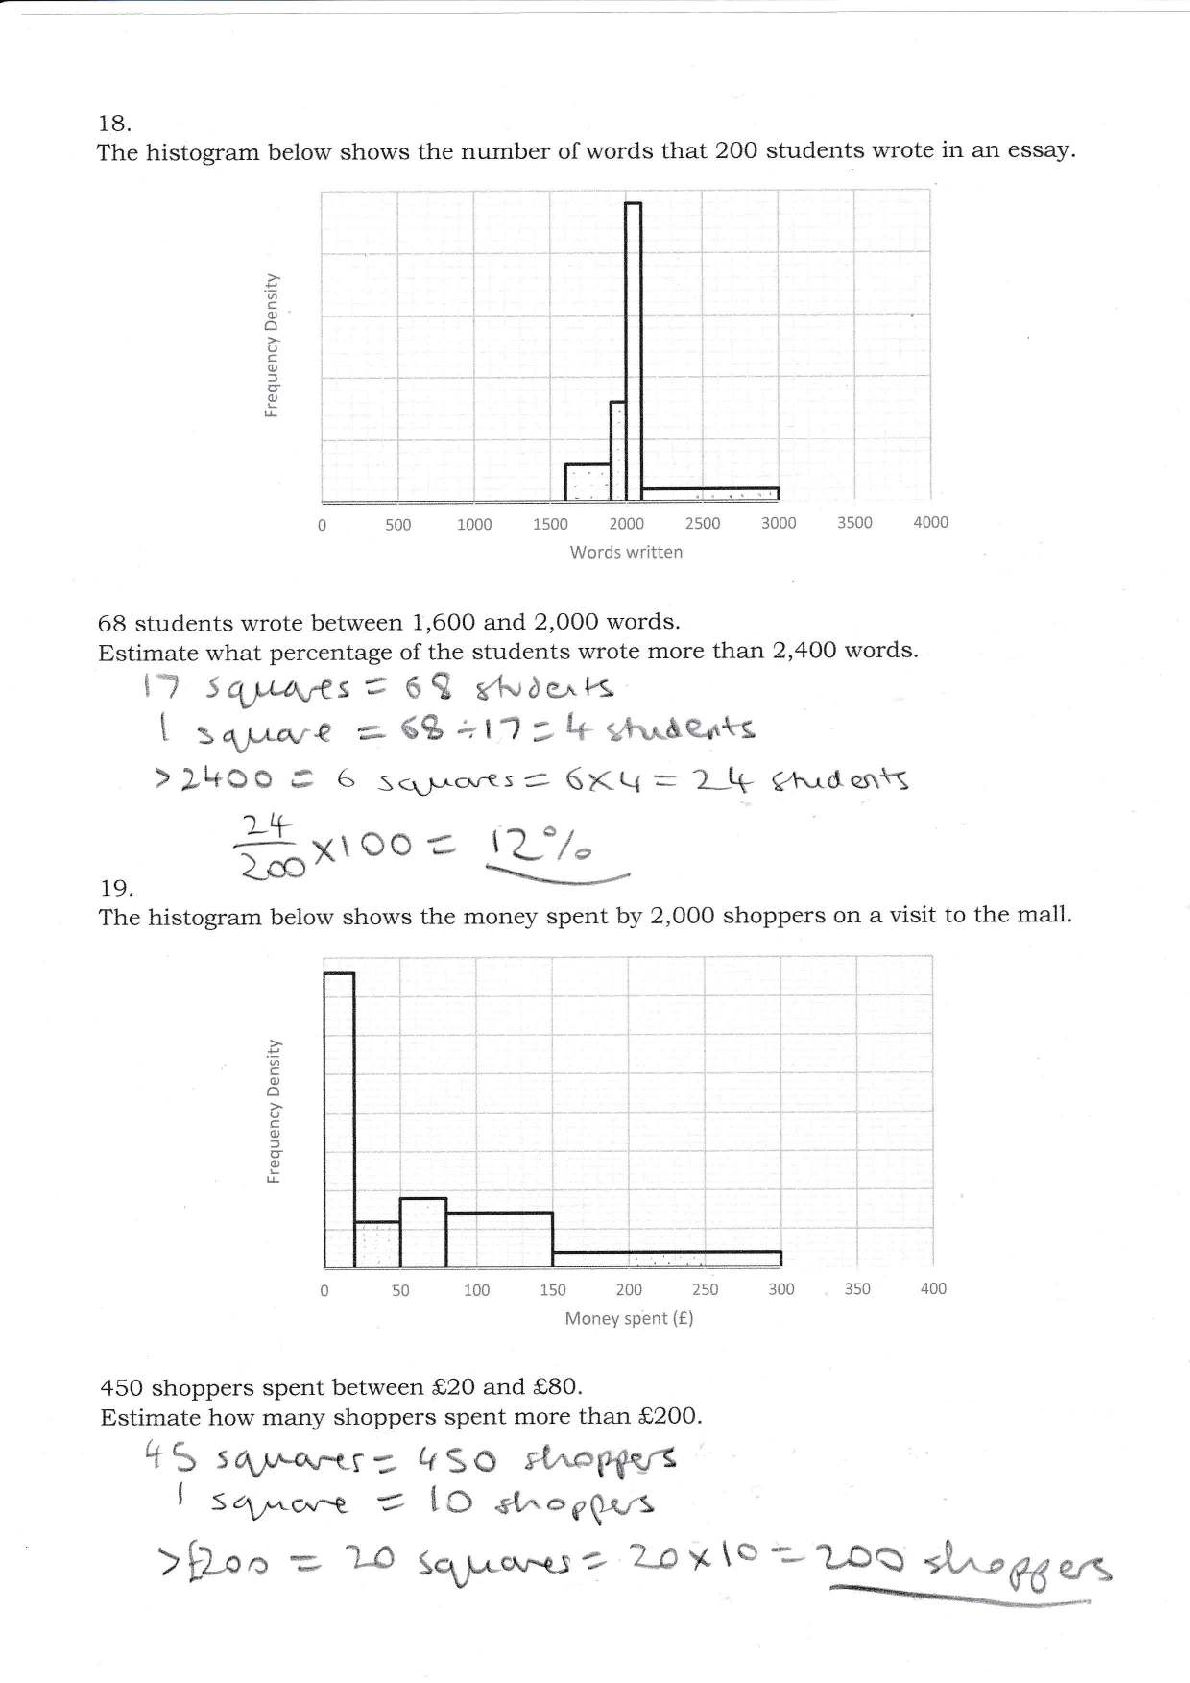
  10. 18. The histogram below shows the number of r,vords that

    200 students wrote in an essay. e c o0l U c 0) f (, L L 1000 1500 2000 2500 3500 Words written 68 students wrote between 1,600 and 2,AAO words. Estimate what percentage of the students wrote more than 2,4OO words. t? Sq1tt'cqfst 6g s6.,ae^fa I 3 fuLr.au€ s, 6B 111 ) 4 vhl&e,*{s, 2,koo c 6 scgr,.ores = 6Kt{ - 2-+ (4\rdef$ 1LL fix\oos Y 19. The histogram below shows the money spent by 2,000 shoppers on a visit to the mall. -I *_l ..t: c o0) u 0) f, 6 o) L L 150 200 ; Money spent (f) 450 shoppers spent betrnreen S20 and fl80. Estimate how many shoppers spent rnore than S200. q5 s{l.lar-tr; kso rt^cffifg 1 so\rc^^e u tC) c{noet&rs )12n" B -tA S11*-c,.nts nn 2A x [o ? LCQ 5)^ofl48A vLJ
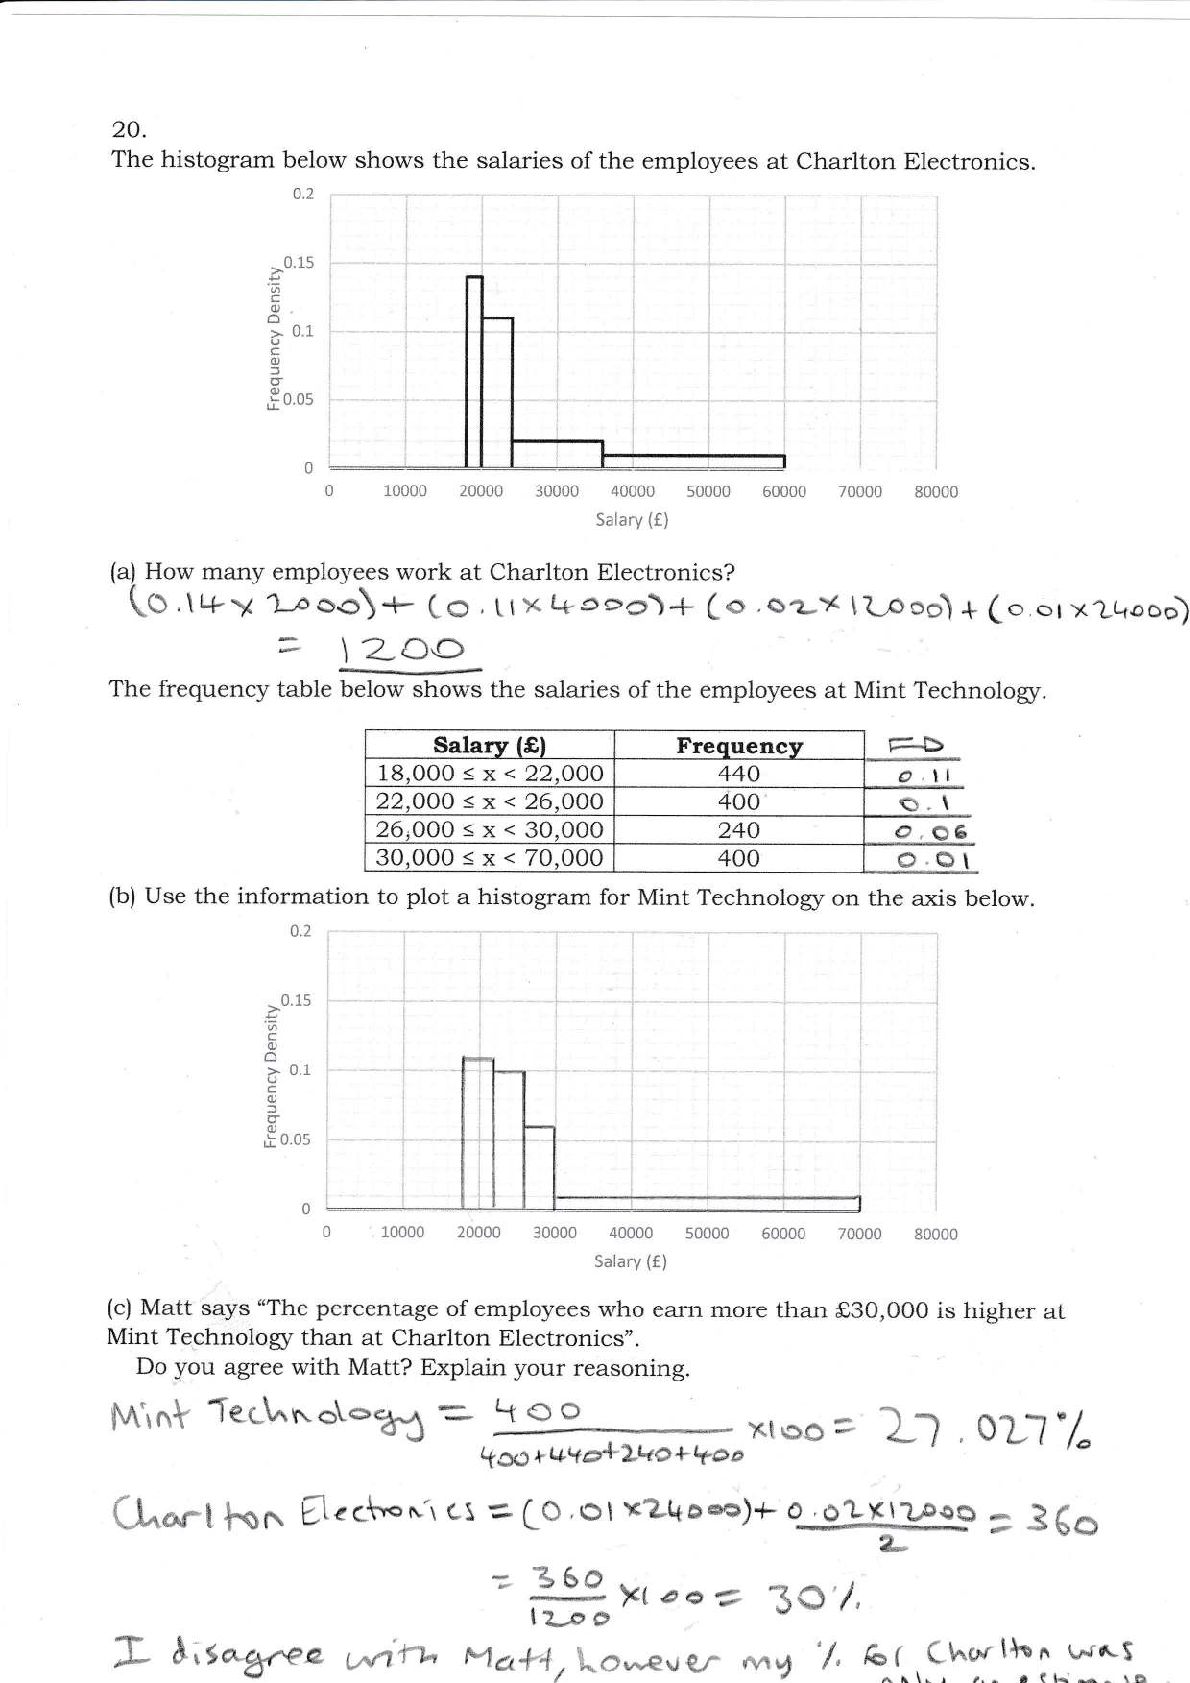
  11. 20. The histogram below sho',1,s the salaries of the employees

    at Charlton Electronics. o., I , i t I i l*_ * ,t>0.15 I I C oo, > 0.1 (J i .1 I t --! C (U i 3 (, ; l Pn n< '' '"4 i i l 0 0 10000 20000 30000 40000 s0000 60000 80000 Salary (€) (a) How many employees work at Charlton Electronics? (O ,lr-t-y f-ooo)+- Co , tr x L{.eeo)+ (o .oe-x tL,oool + (o.or xtkooo) = \ Z-oto The frequency table;;i;ilhrG the salaries of the employees at Mint Teehnolory. Salary {S} 18.000<x<22.AOA 22,OAO<x<25,000 26tOOA<x<30,000 30,000<x<70,000 Frequencv rD o,ll 44CI s.l 400 244 400 o.o6 o,o (b) Use the information to plot a histogram for Mint Technology on the axis below. t:, fi_0.15 '6 C c) o > (J 0.1 c(u I 5 e) t 0.0s i 1 ,1 i 0 , 10000 20000 30000 40000 s0000 50000 70000 80000 Salary (€) (c) Matt says "The percentage of empk:vees r.vho earn more than S30.CI00 is higher at Mint Technology- than at Charlton Electronics". Do 5rou agree rnith Matt? Explain your reasoning. $A\nt TecLr'o\c'cat =- koo ttocr rgtfa+L*o+?oo xr\Do3 2; ,o:fl,f. (L"rt l.on El'cc$oNi c! = LO,rcl xzqaaa)+ o;.ggl34lg ffd" "")PfqqJ^ ,d,._.. ILD O jo'1, L [;lag,*c vrir* v,a1o4rl"o*cvqr N\t)' /, ql,!f^T-tT:-:::_
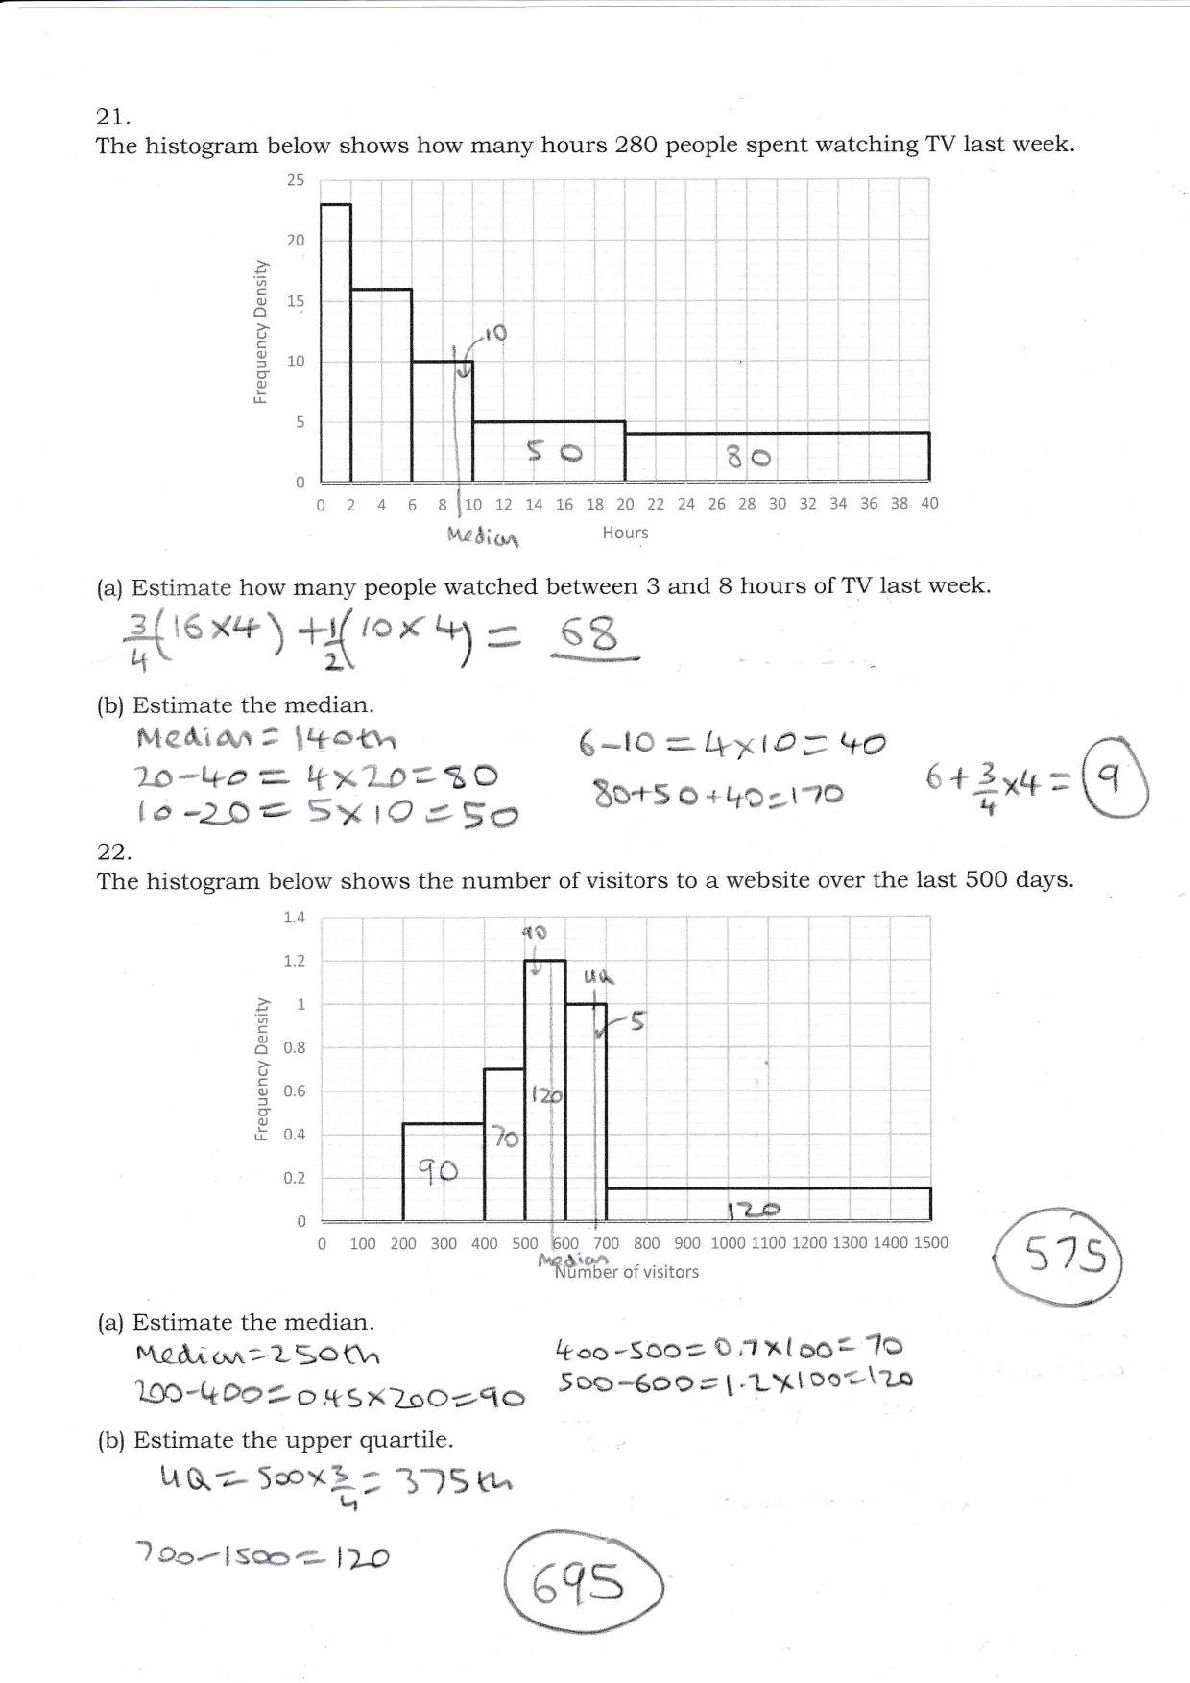
  12. 21. The histograrn below shows how many hours 280 people

    spent watching TV last week. li -J t I C oor L5 I U c 3ro (t o l" l u ; 1 t 5 FP \ 0 ii 1 I g lro rz L4 t6 tB 20 22 24 26 28 30 32 34 35 38 .ifl 4 t"',: i,;"., Hours (a) Estimate how many people watched between 3 and 8 hours of TV last week. #' 6*+) +{tor I r Sg_ (b) Estimate the median. MeAi*l i irraAn 6-10 =t+yto3 +O 1&*L*o a *X1O--t O lo -2-D €- 5Y tO egO 5+Ax$=O Eu+s o +tro :.11o 22. The histogram below shows the number of visitors to a website over the last 500 days. 7'4 , ,r{:' {/it II '^ I 1.2 I r -- -i-. , t 'a c i E o.a 6 3 o.e .r'I t I I r+ * -tr- cr ,i o.+ 6l ---i- -- fi'n -ryI 0.2 j I i (a) Estimate the median. M.qni<.rn>25oO^ 1gf--*Oo*o t+SX2-oO:zRo (b) Estimate the upper quartile. tl = a1S l oa.,-lsm e- l)s tqA la-,,./ I 0 100 200 300 400 sc 500 [40,-,- 5cox1 ill,'iili --i*1-*r*-T--r--il - 1o I I 0 n _-r+_+_+-+r-+EJ-_ tr^ :I ': i i 700 800 900 1000 1100 1200 1300 1400 1 5iilj hfiltffit of visitors leoo -Soo -- S ,? x t oo * 1ra 5og-6o0, ["LXl oot'\?^