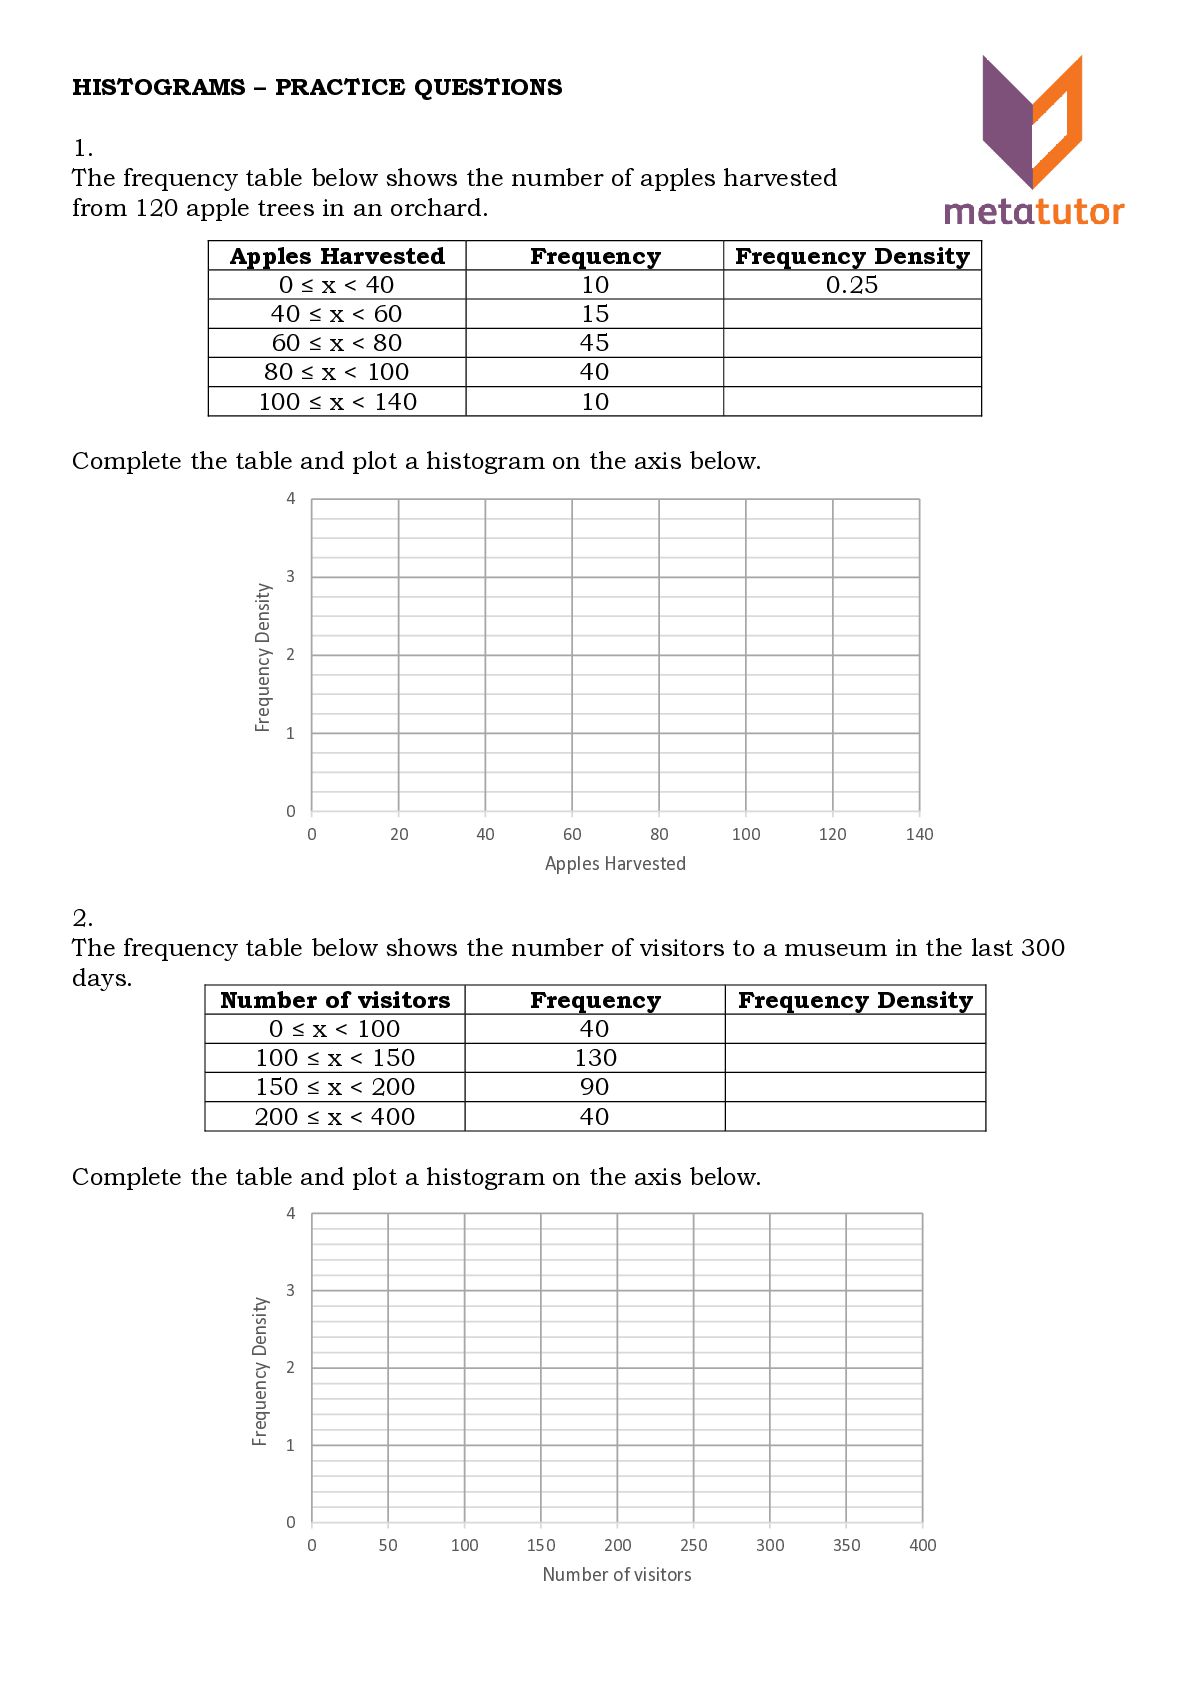
the number of apples harvested from 120 apple trees in an orchard. Apples Harvested 0 ≤ x < 40 40 ≤ x < 60 60 ≤ x < 80 80 ≤ x < 100 100 ≤ x < 140 Frequency 10 15 45 40 10 Frequency Density 0.25 Complete the table and plot a histogram on the axis below. Frequency Density 4 3 2 1 0 0 20 40 60 80 100 120 140 Apples Harvested 2. The frequency table below shows the number of visitors to a museum in the last 300 days. Number of visitors Frequency Frequency Density 0 ≤ x < 100 40 100 ≤ x < 150 130 150 ≤ x < 200 90 200 ≤ x < 400 40 Complete the table and plot a histogram on the axis below. Frequency Density 4 3 2 1 0 0 50 100 150 200 250 Number of visitors 300 350 400
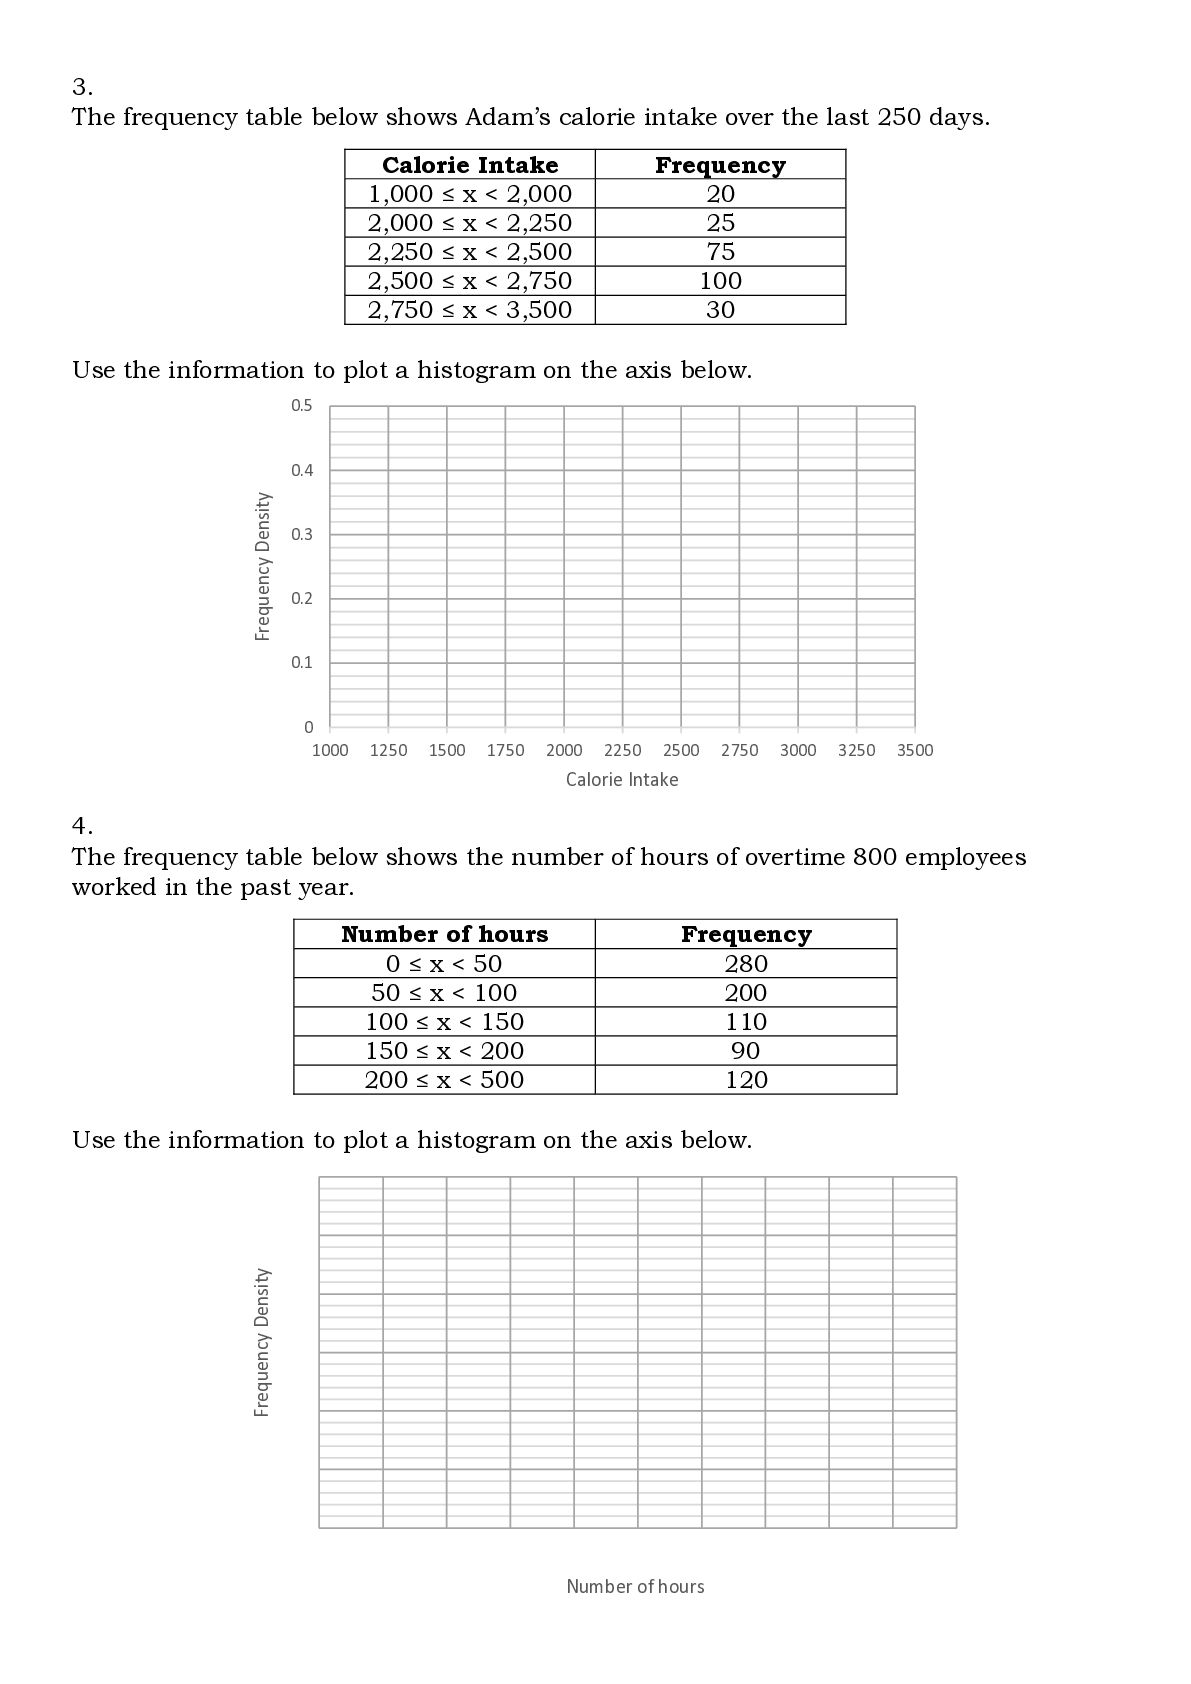
the last 250 days. Calorie Intake 1,000 ≤ x < 2,000 2,000 ≤ x < 2,250 2,250 ≤ x < 2,500 2,500 ≤ x < 2,750 2,750 ≤ x < 3,500 Frequency 20 25 75 100 30 Use the information to plot a histogram on the axis below. 0.5 Frequency Density 0.4 0.3 0.2 0.1 0 1000 1250 1500 1750 2000 2250 2500 2750 3000 3250 3500 Calorie Intake 4. The frequency table below shows the number of hours of overtime 800 employees worked in the past year. Number of hours 0 ≤ x < 50 50 ≤ x < 100 100 ≤ x < 150 150 ≤ x < 200 200 ≤ x < 500 Frequency 280 200 110 90 120 Frequency Density Use the information to plot a histogram on the axis below. Number of hours
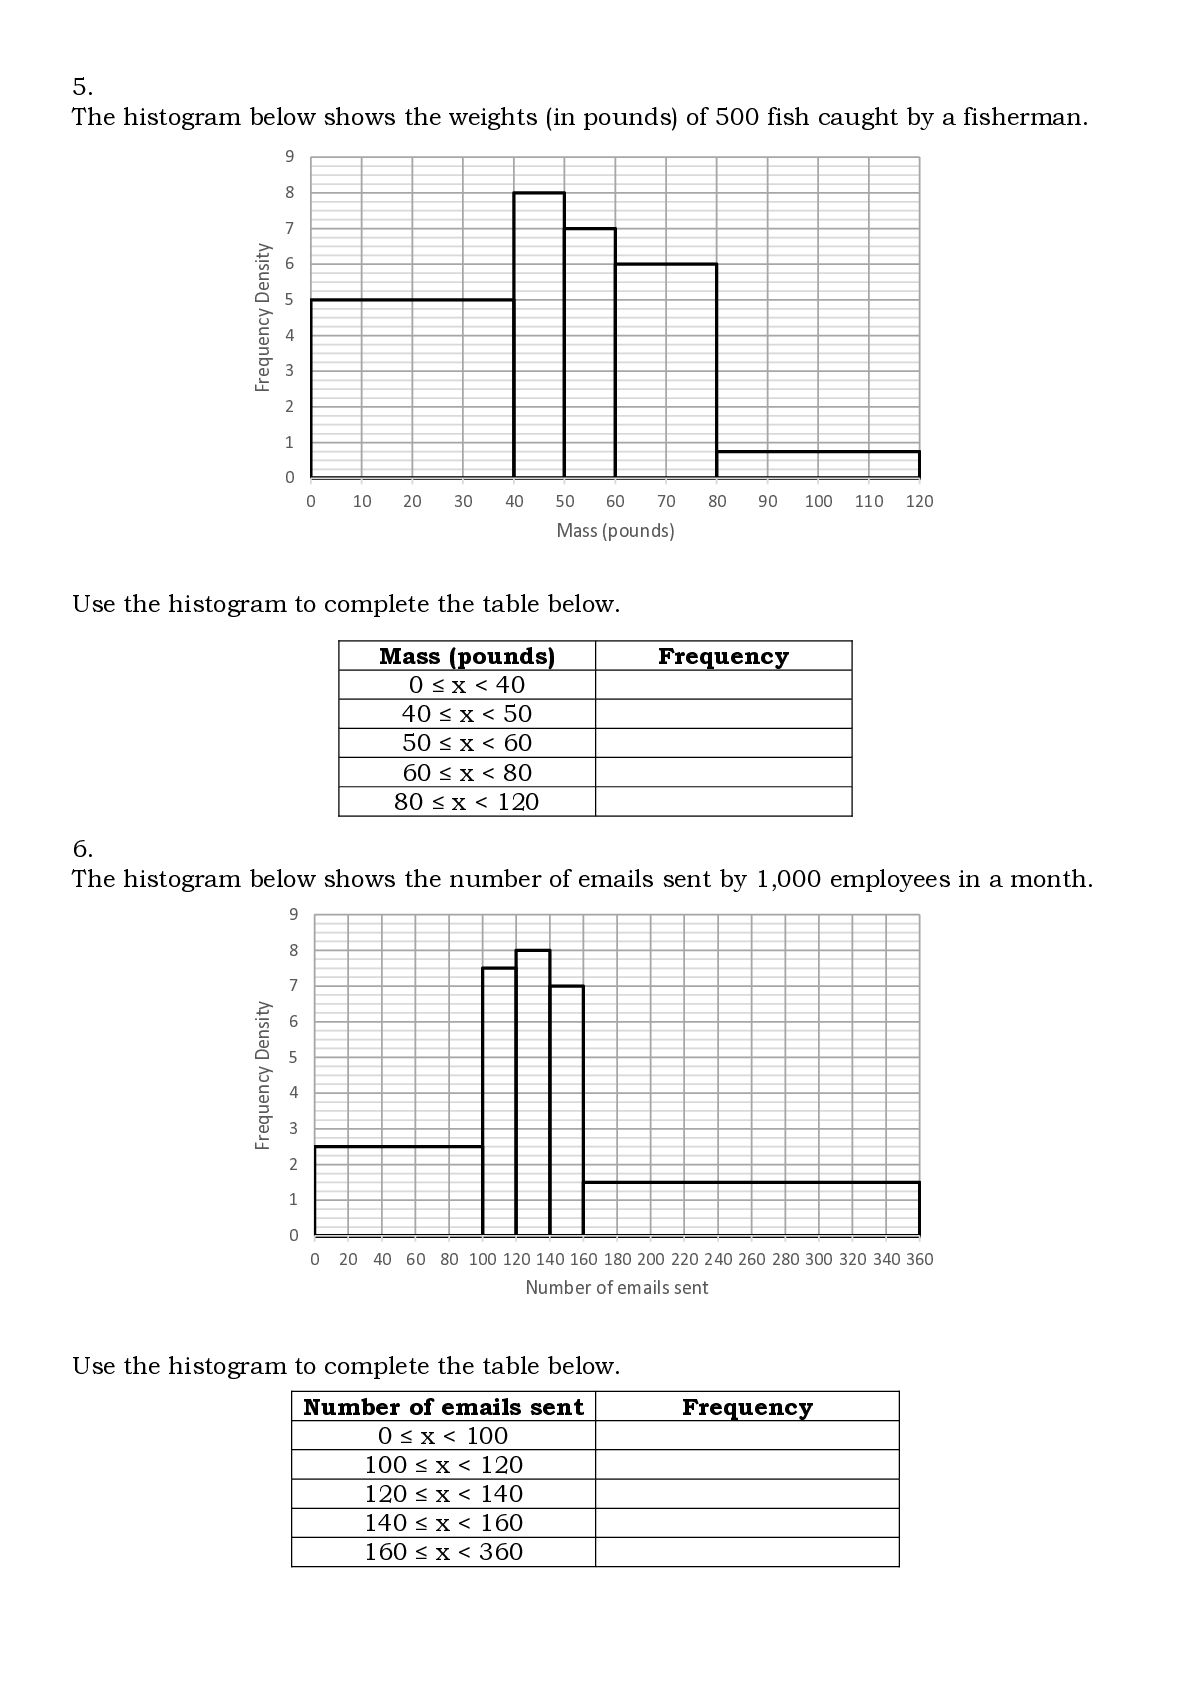
500 fish caught by a fisherman. 9 8 Frequency Density 7 6 5 4 3 2 1 0 0 10 20 30 40 50 60 70 80 90 100 110 120 Mass (pounds) Use the histogram to complete the table below. Mass (pounds) 0 ≤ x < 40 40 ≤ x < 50 50 ≤ x < 60 60 ≤ x < 80 80 ≤ x < 120 Frequency 6. The histogram below shows the number of emails sent by 1,000 employees in a month. 9 8 Frequency Density 7 6 5 4 3 2 1 0 0 20 40 60 80 100 120 140 160 180 200 220 240 260 280 300 320 340 360 Number of emails sent Use the histogram to complete the table below. Number of emails sent 0 ≤ x < 100 100 ≤ x < 120 120 ≤ x < 140 140 ≤ x < 160 160 ≤ x < 360 Frequency
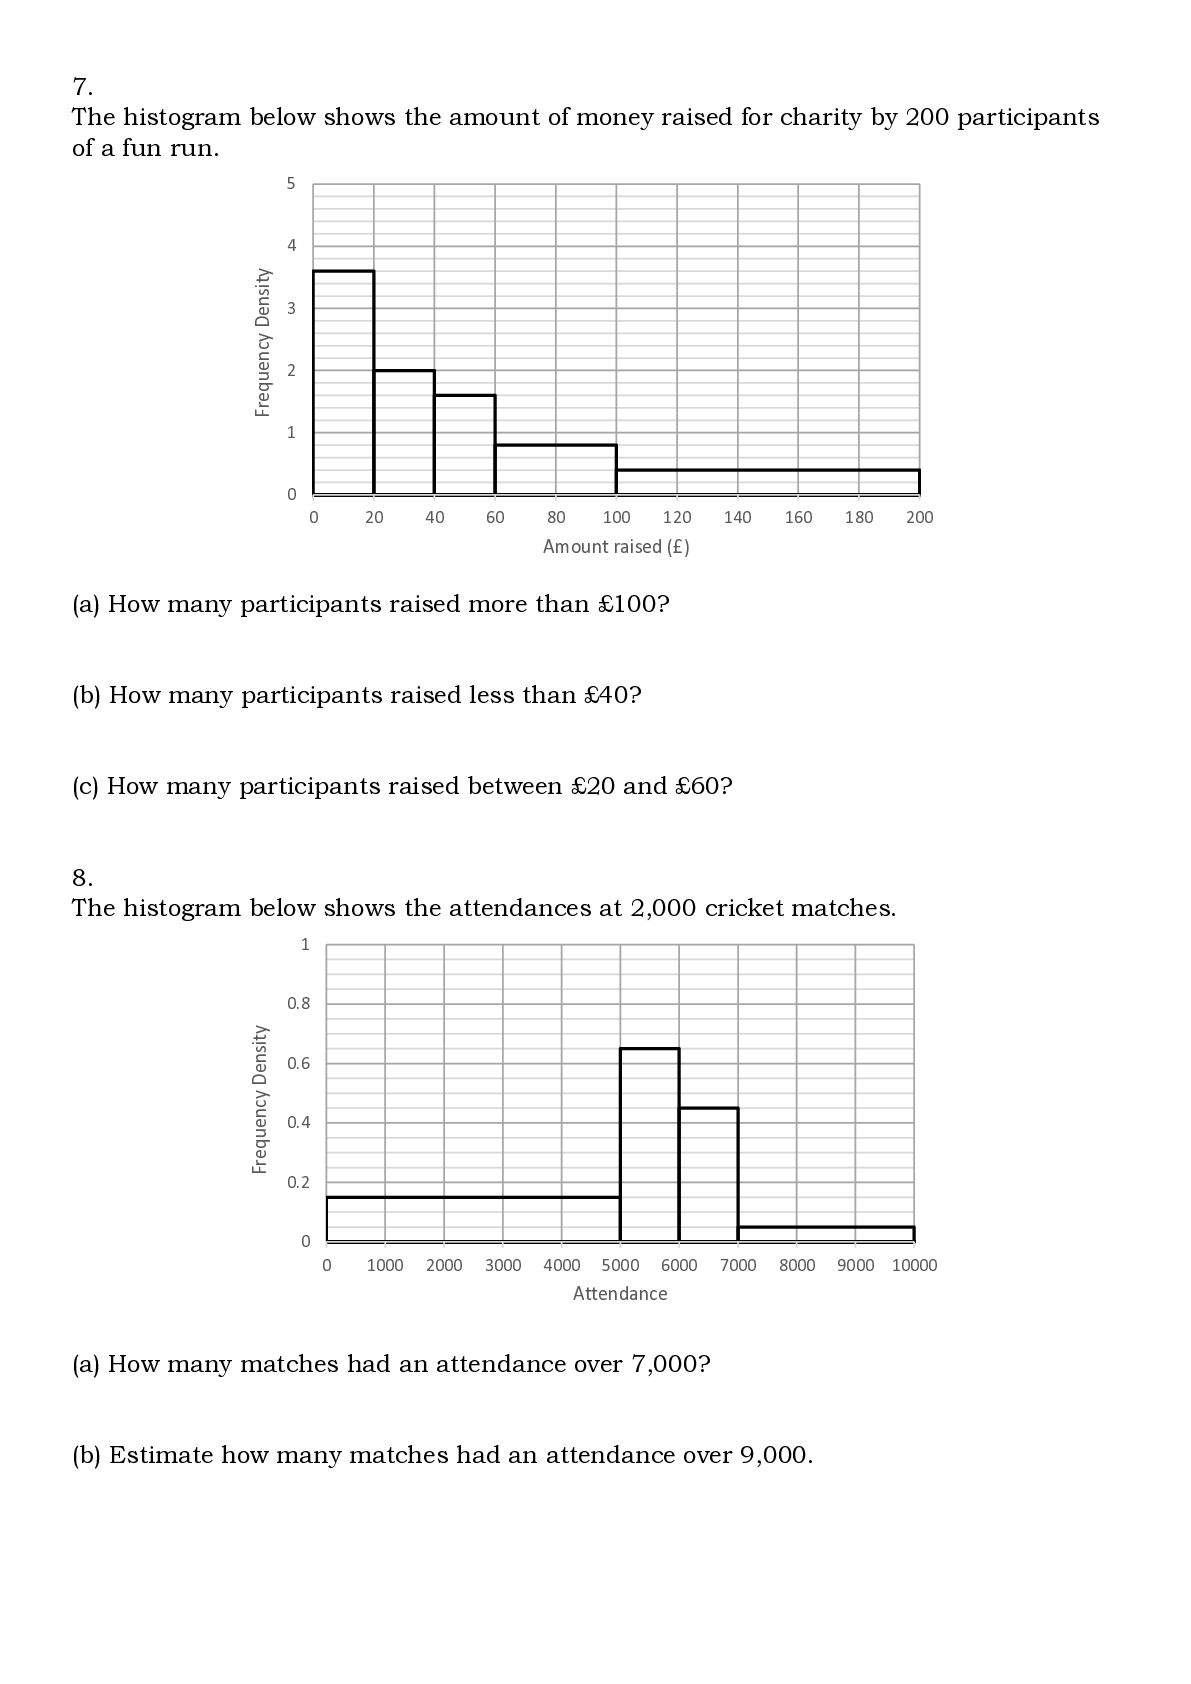
for charity by 200 participants of a fun run. 5 Frequency Density 4 3 2 1 0 0 20 40 60 80 100 120 140 160 180 200 Amount raised (£) (a) How many participants raised more than £100? (b) How many participants raised less than £40? (c) How many participants raised between £20 and £60? 8. The histogram below shows the attendances at 2,000 cricket matches. 1 Frequency Density 0.8 0.6 0.4 0.2 0 0 1000 2000 3000 4000 5000 6000 7000 8000 Attendance (a) How many matches had an attendance over 7,000? (b) Estimate how many matches had an attendance over 9,000. 9000 10000
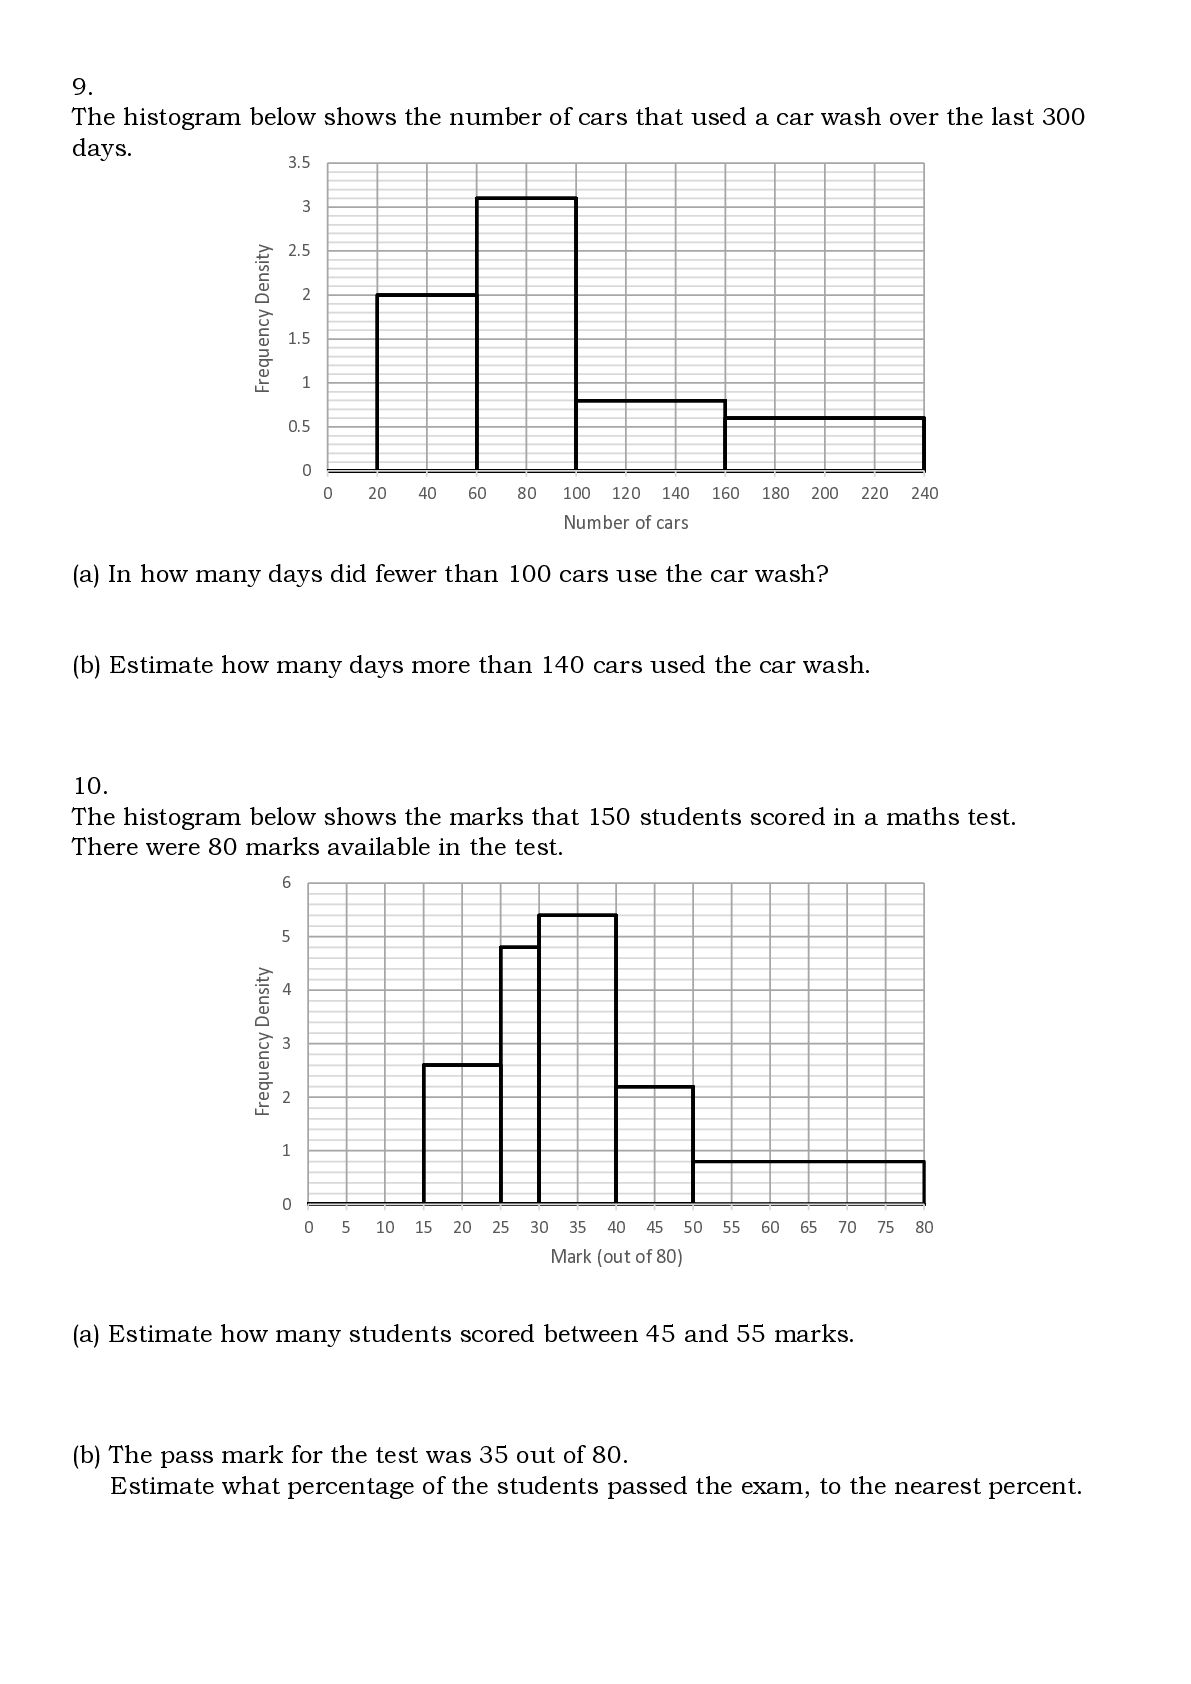
used a car wash over the last 300 days. 3.5 Frequency Density 3 2.5 2 1.5 1 0.5 0 0 20 40 60 80 100 120 140 160 180 200 220 240 Number of cars (a) In how many days did fewer than 100 cars use the car wash? (b) Estimate how many days more than 140 cars used the car wash. 10. The histogram below shows the marks that 150 students scored in a maths test. There were 80 marks available in the test. 6 Frequency Density 5 4 3 2 1 0 0 5 10 15 20 25 30 35 40 45 50 55 60 65 70 75 80 Mark (out of 80) (a) Estimate how many students scored between 45 and 55 marks. (b) The pass mark for the test was 35 out of 80. Estimate what percentage of the students passed the exam, to the nearest percent.
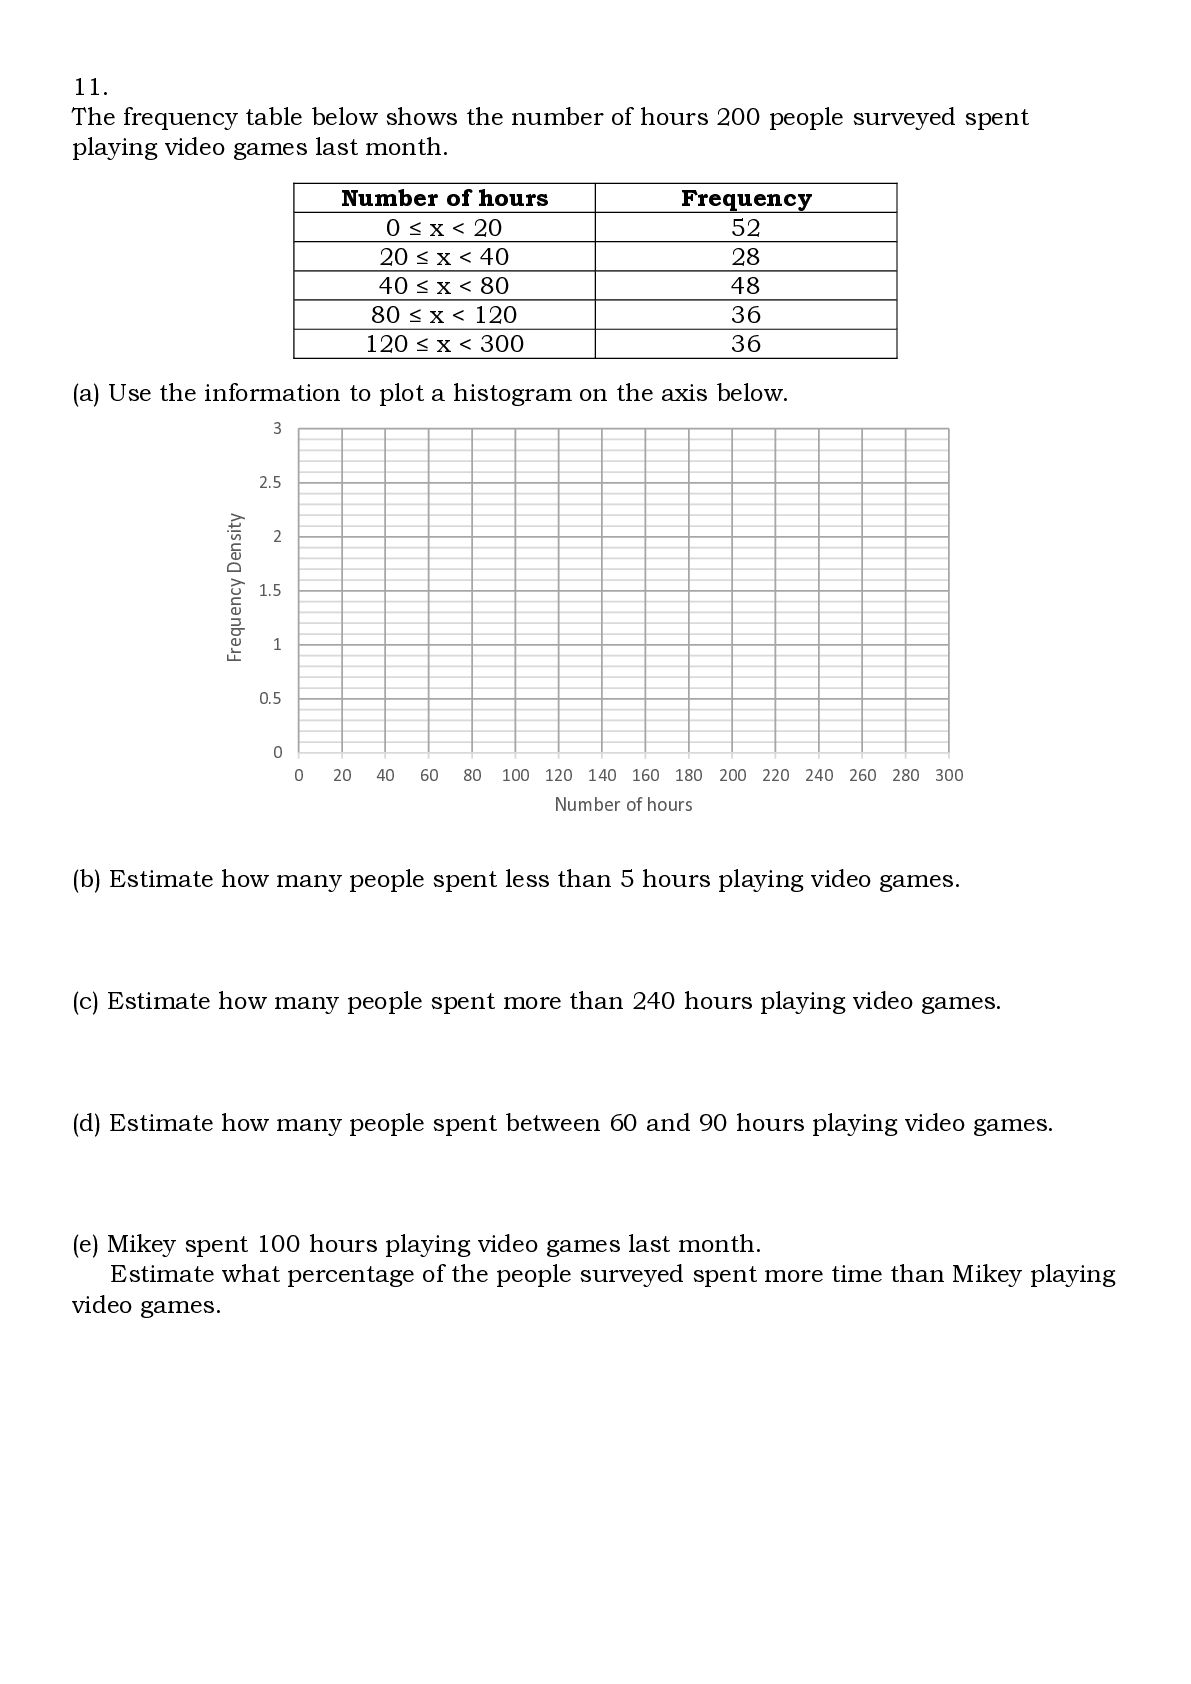
200 people surveyed spent playing video games last month. Number of hours 0 ≤ x < 20 20 ≤ x < 40 40 ≤ x < 80 80 ≤ x < 120 120 ≤ x < 300 Frequency 52 28 48 36 36 (a) Use the information to plot a histogram on the axis below. 3 Frequency Density 2.5 2 1.5 1 0.5 0 0 20 40 60 80 100 120 140 160 180 200 220 240 260 280 300 Number of hours (b) Estimate how many people spent less than 5 hours playing video games. (c) Estimate how many people spent more than 240 hours playing video games. (d) Estimate how many people spent between 60 and 90 hours playing video games. (e) Mikey spent 100 hours playing video games last month. Estimate what percentage of the people surveyed spent more time than Mikey playing video games.
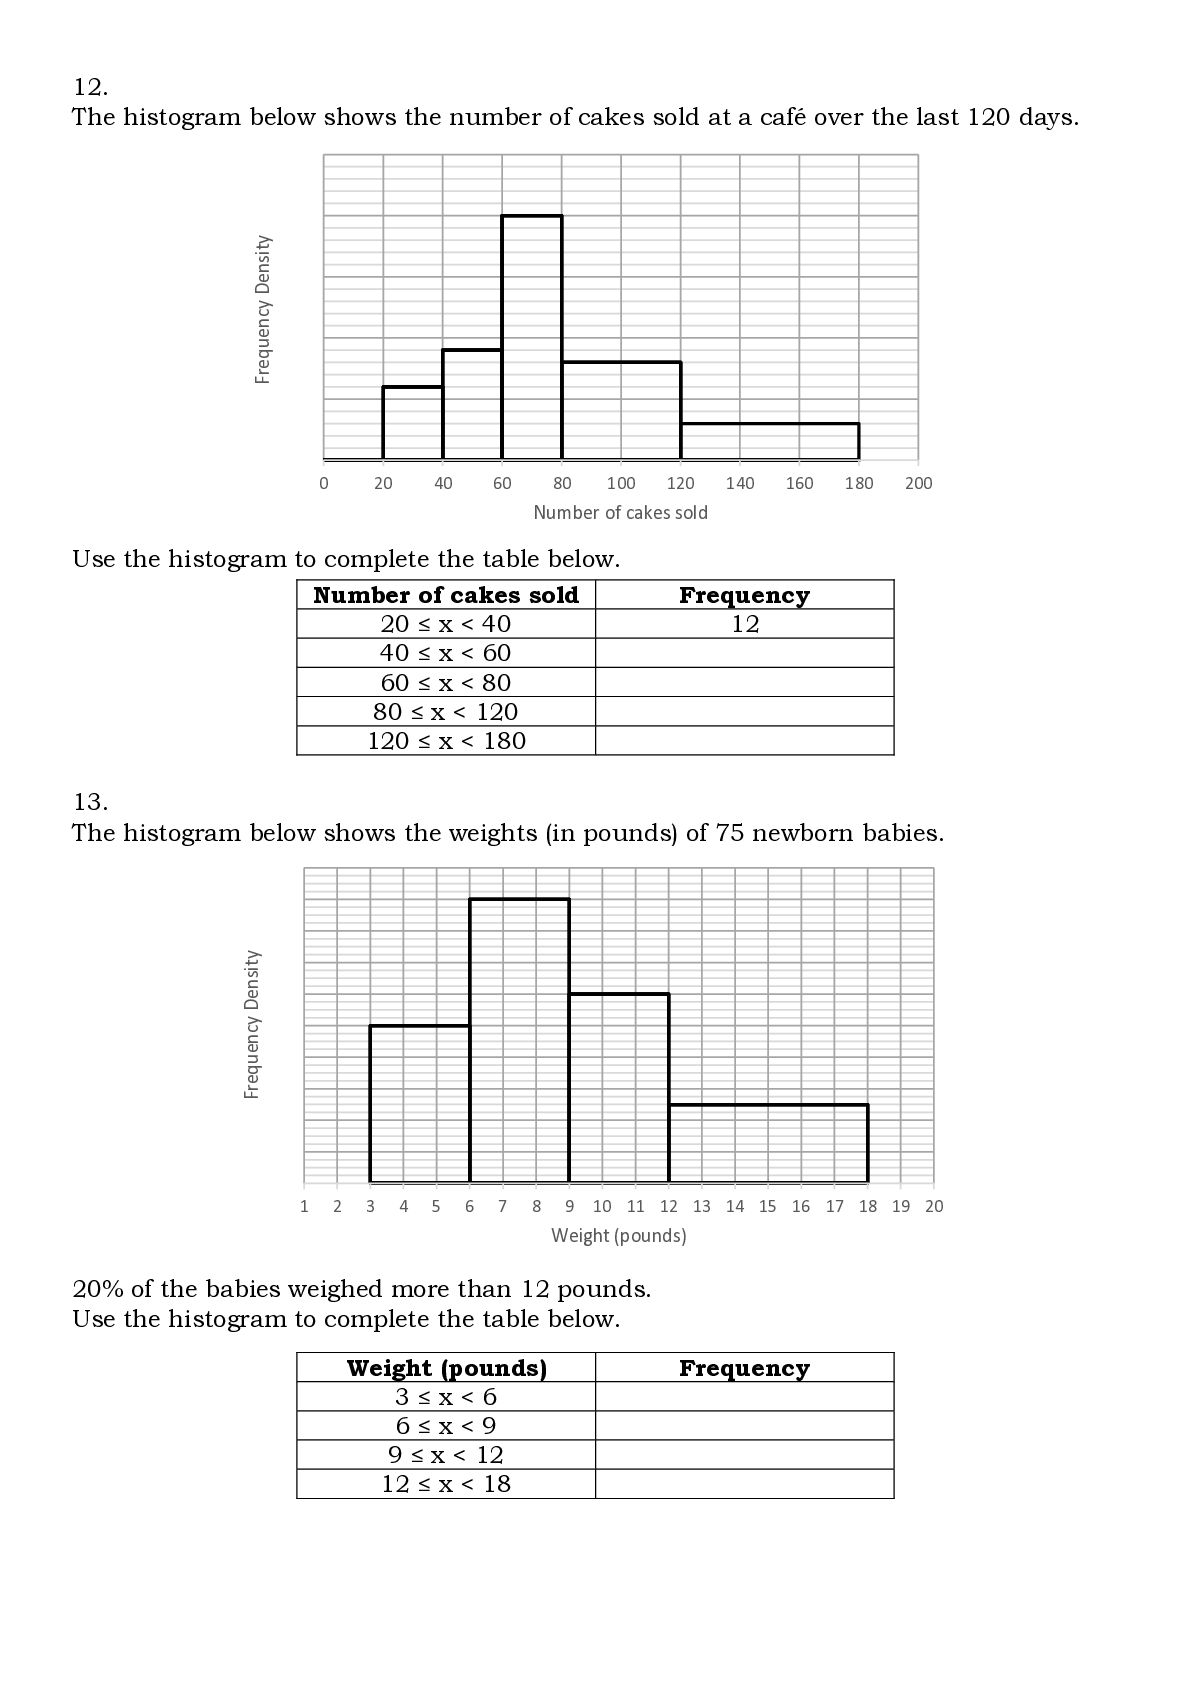
cakes sold at a café over the last 120 days. 0 20 40 60 80 100 120 140 160 180 200 Number of cakes sold Use the histogram to complete the table below. Number of cakes sold 20 ≤ x < 40 40 ≤ x < 60 60 ≤ x < 80 80 ≤ x < 120 120 ≤ x < 180 Frequency 12 Frequency Density 13. The histogram below shows the weights (in pounds) of 75 newborn babies. 1 2 3 4 5 6 7 8 9 10 11 12 13 14 15 16 17 18 19 20 Weight (pounds) 20% of the babies weighed more than 12 pounds. Use the histogram to complete the table below. Weight (pounds) 3≤x<6 6≤x<9 9 ≤ x < 12 12 ≤ x < 18 Frequency
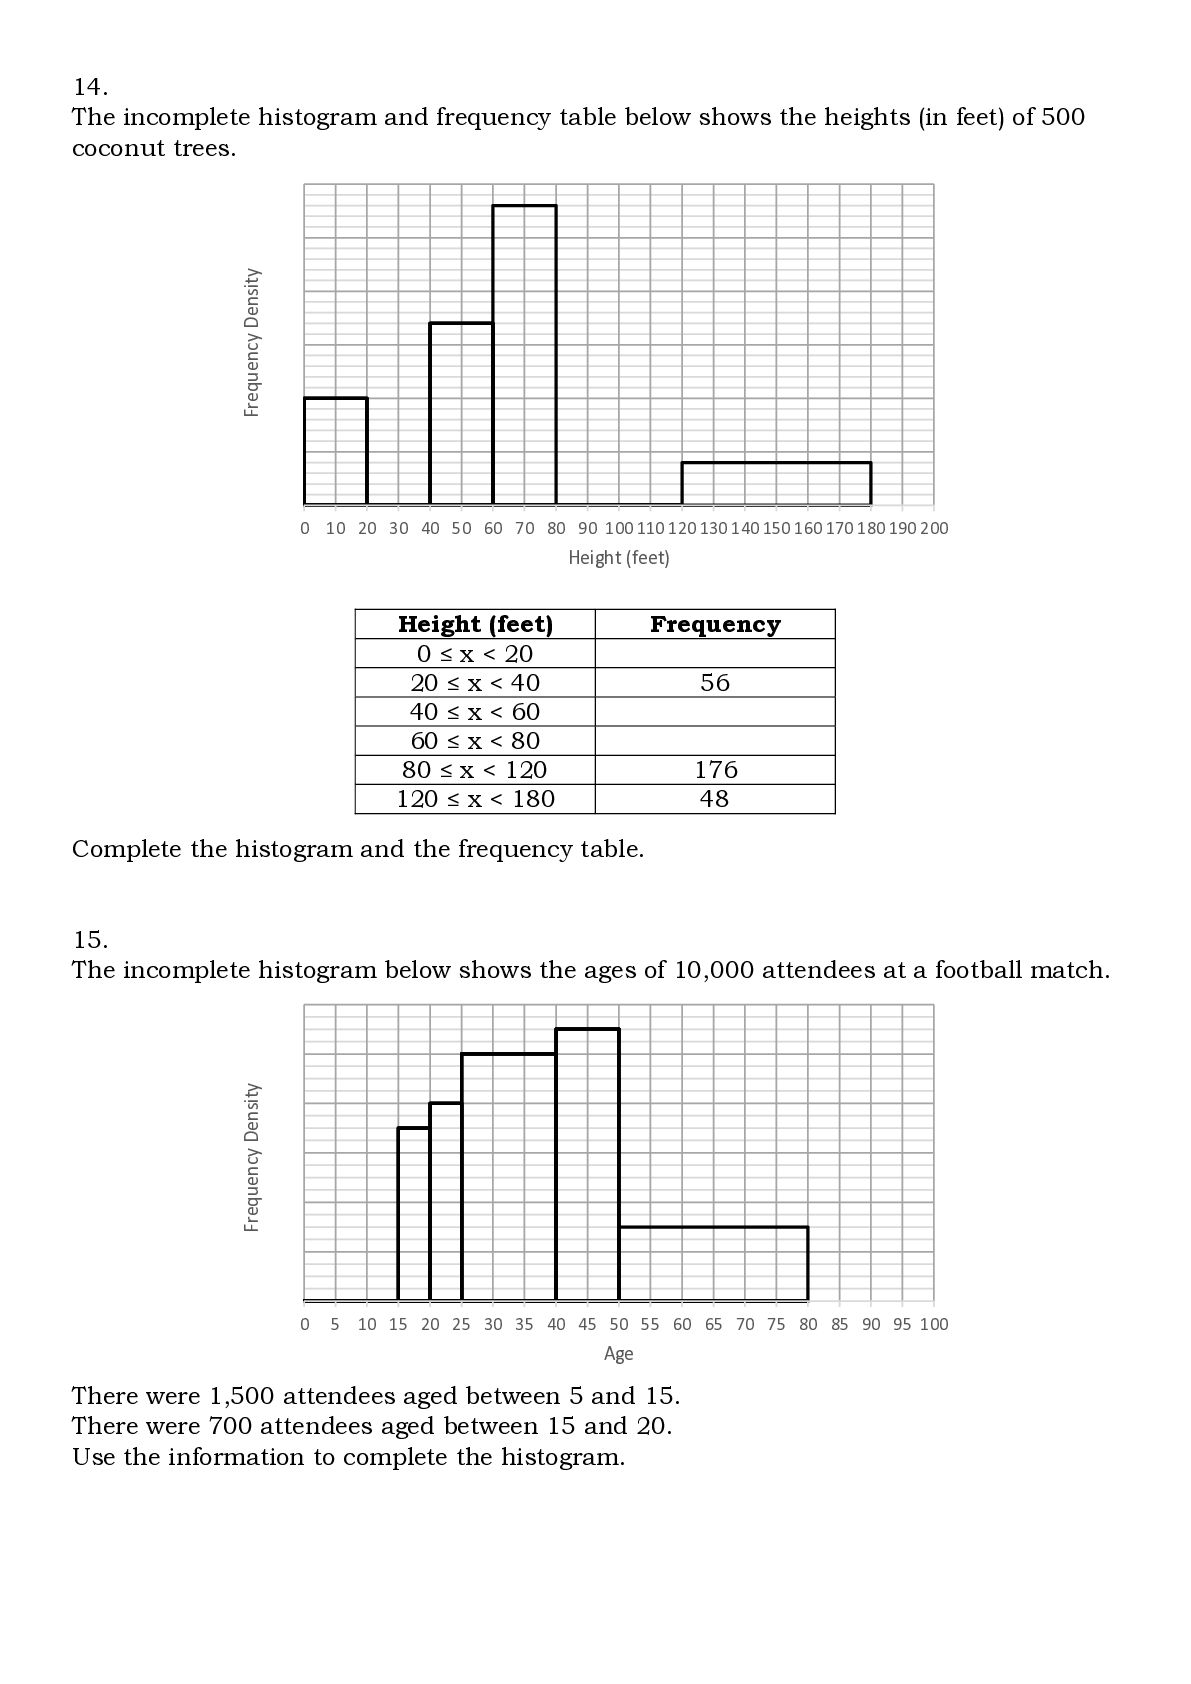
shows the heights (in feet) of 500 coconut trees. 0 10 20 30 40 50 60 70 80 90 100 110 120 130 140 150 160 170 180 190 200 Height (feet) Height (feet) 0 ≤ x < 20 20 ≤ x < 40 40 ≤ x < 60 60 ≤ x < 80 80 ≤ x < 120 120 ≤ x < 180 Frequency 56 176 48 Complete the histogram and the frequency table. Frequency Density 15. The incomplete histogram below shows the ages of 10,000 attendees at a football match. 0 5 10 15 20 25 30 35 40 45 50 55 60 65 70 75 80 85 90 95 100 Age There were 1,500 attendees aged between 5 and 15. There were 700 attendees aged between 15 and 20. Use the information to complete the histogram.
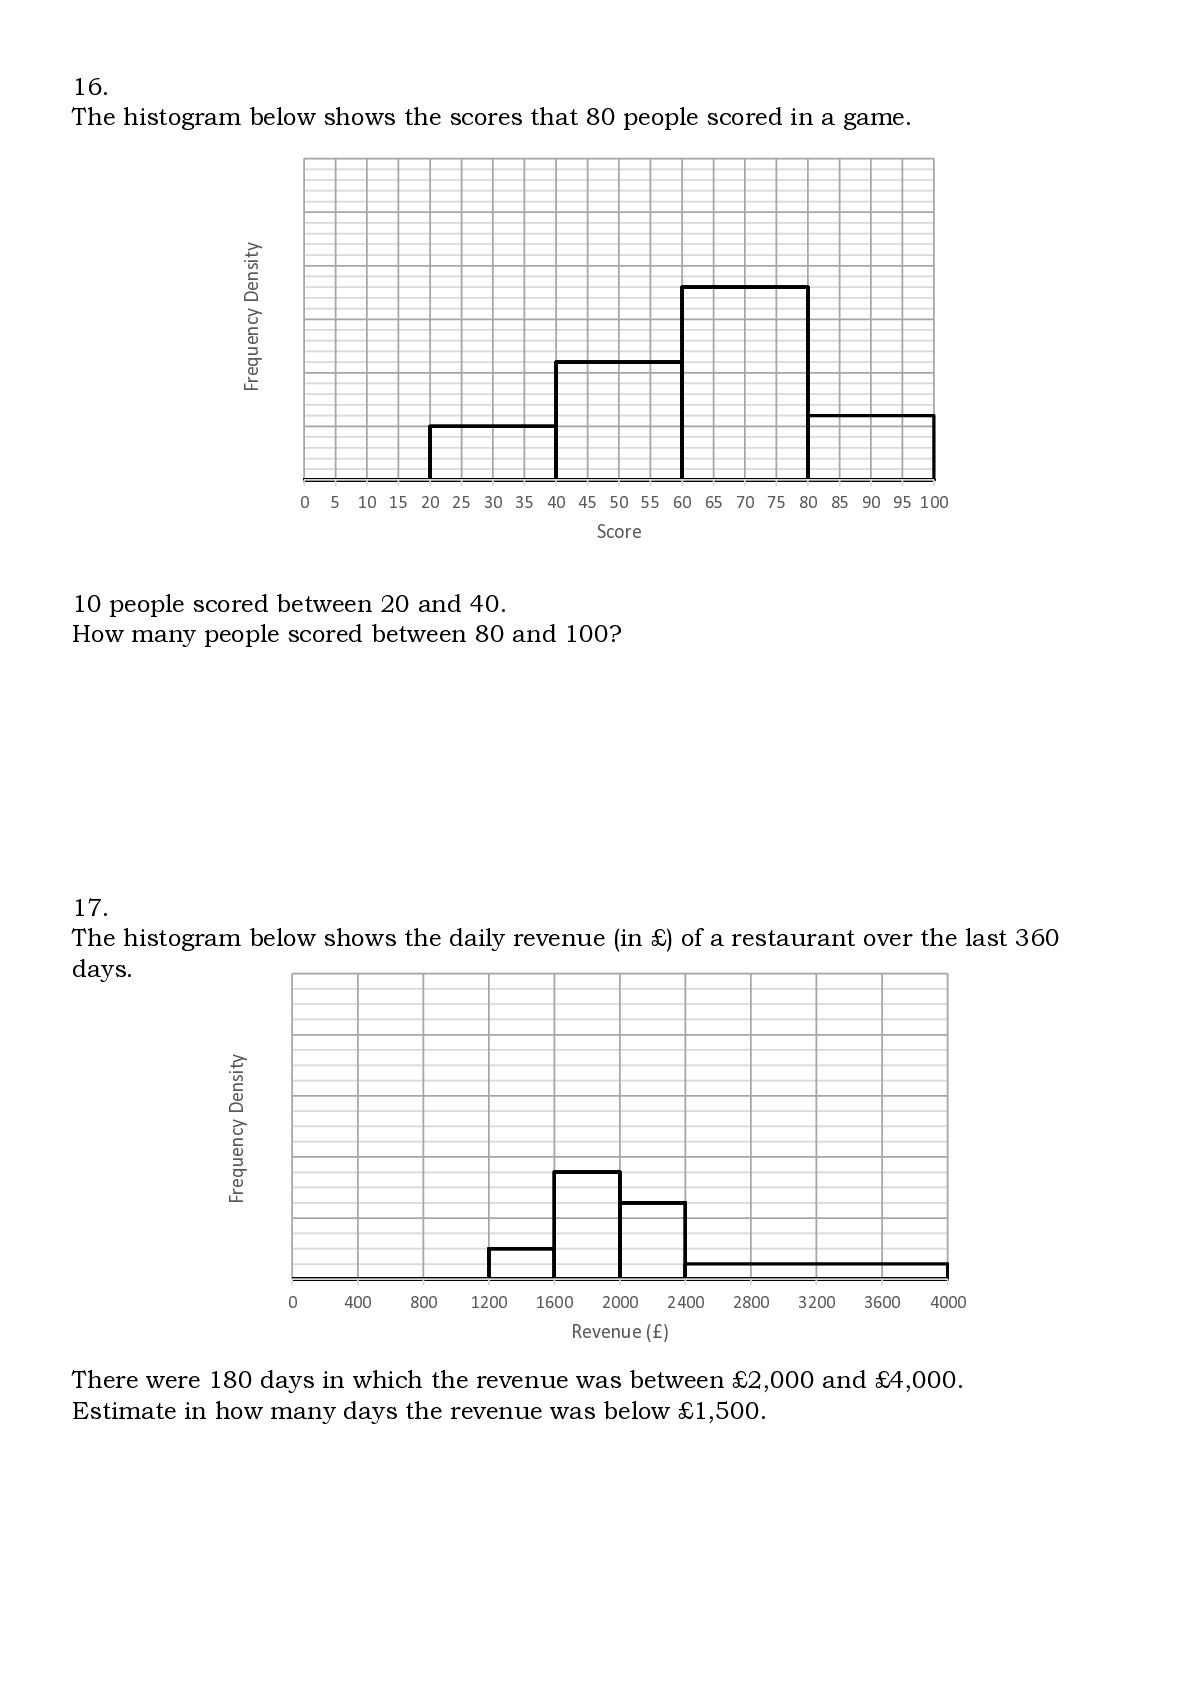
80 people scored in a game. 0 5 10 15 20 25 30 35 40 45 50 55 60 65 70 75 80 85 90 95 100 Score 10 people scored between 20 and 40. How many people scored between 80 and 100? Frequency Density 17. The histogram below shows the daily revenue (in £) of a restaurant over the last 360 days. 0 400 800 1200 1600 2000 2400 2800 3200 3600 4000 Revenue (£) There were 180 days in which the revenue was between £2,000 and £4,000. Estimate in how many days the revenue was below £1,500.
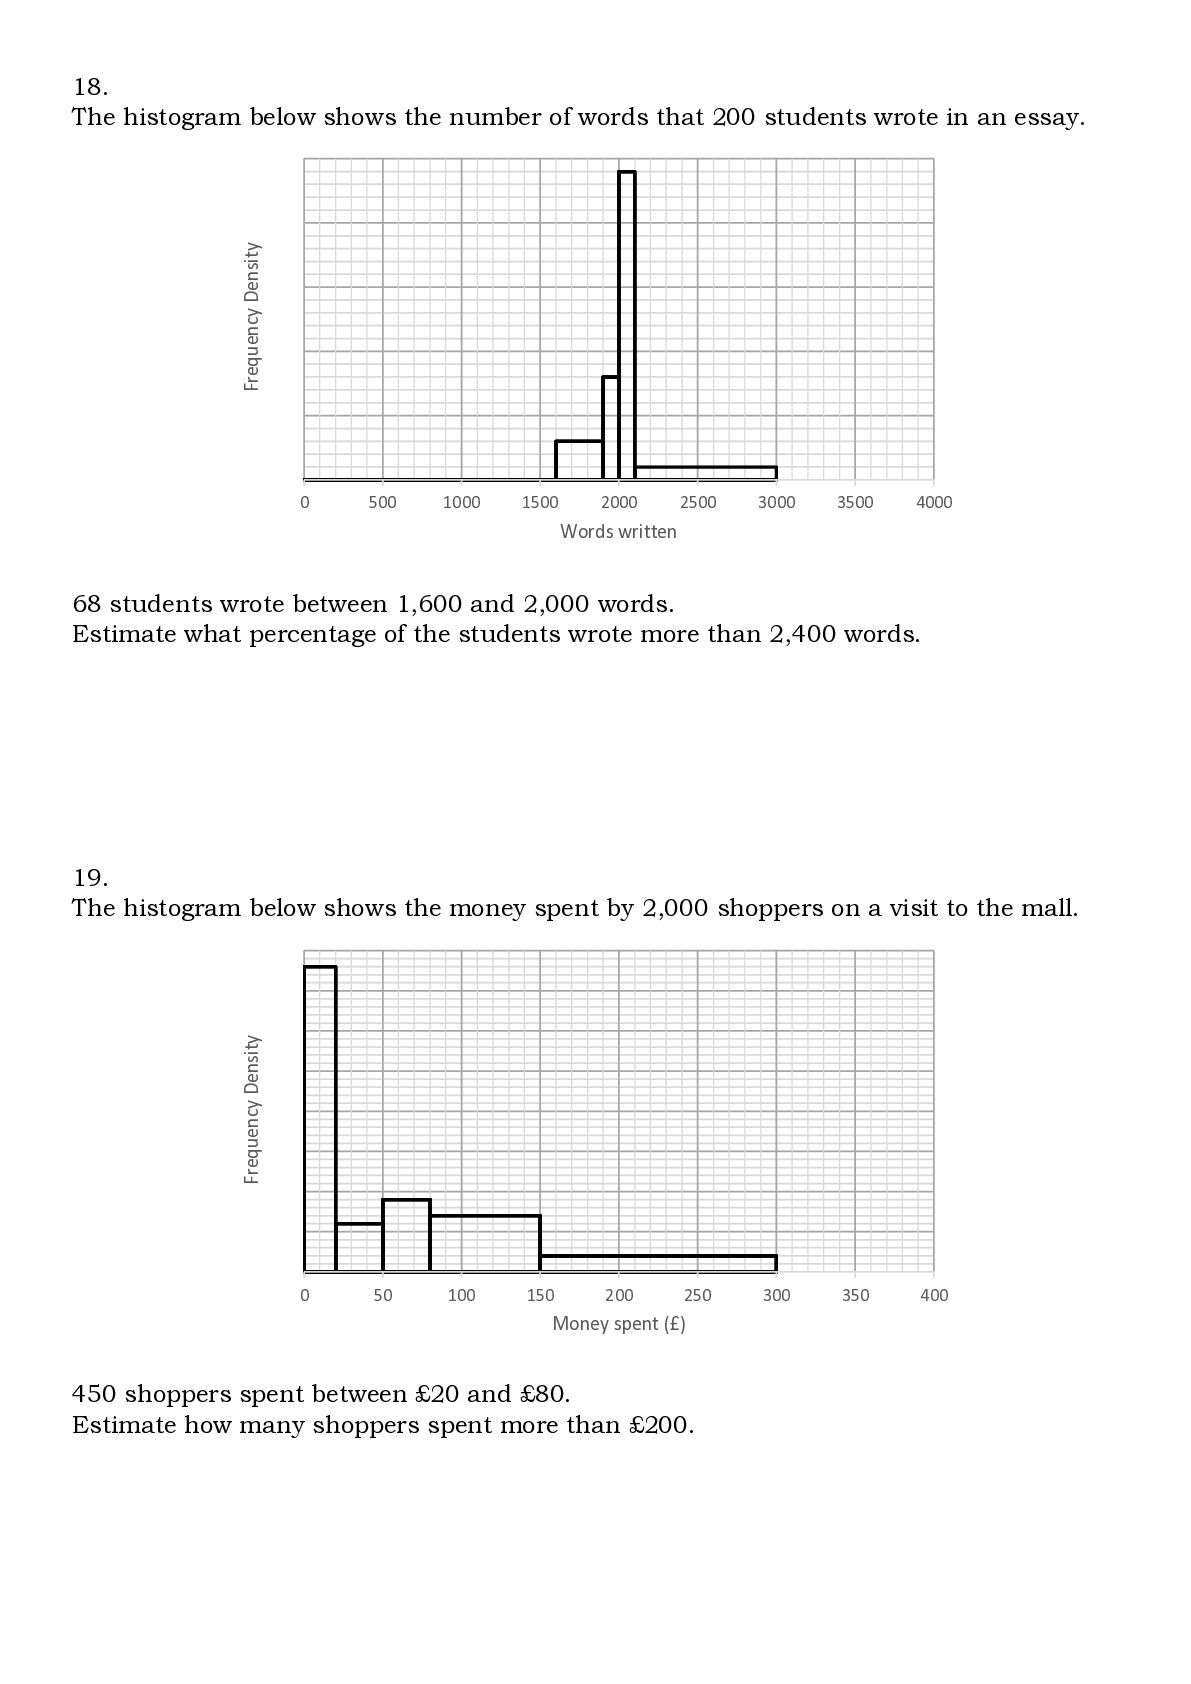
words that 200 students wrote in an essay. 0 500 1000 1500 2000 2500 3000 3500 4000 Words written 68 students wrote between 1,600 and 2,000 words. Estimate what percentage of the students wrote more than 2,400 words. Frequency Density 19. The histogram below shows the money spent by 2,000 shoppers on a visit to the mall. 0 50 100 150 200 250 Money spent (£) 450 shoppers spent between £20 and £80. Estimate how many shoppers spent more than £200. 300 350 400
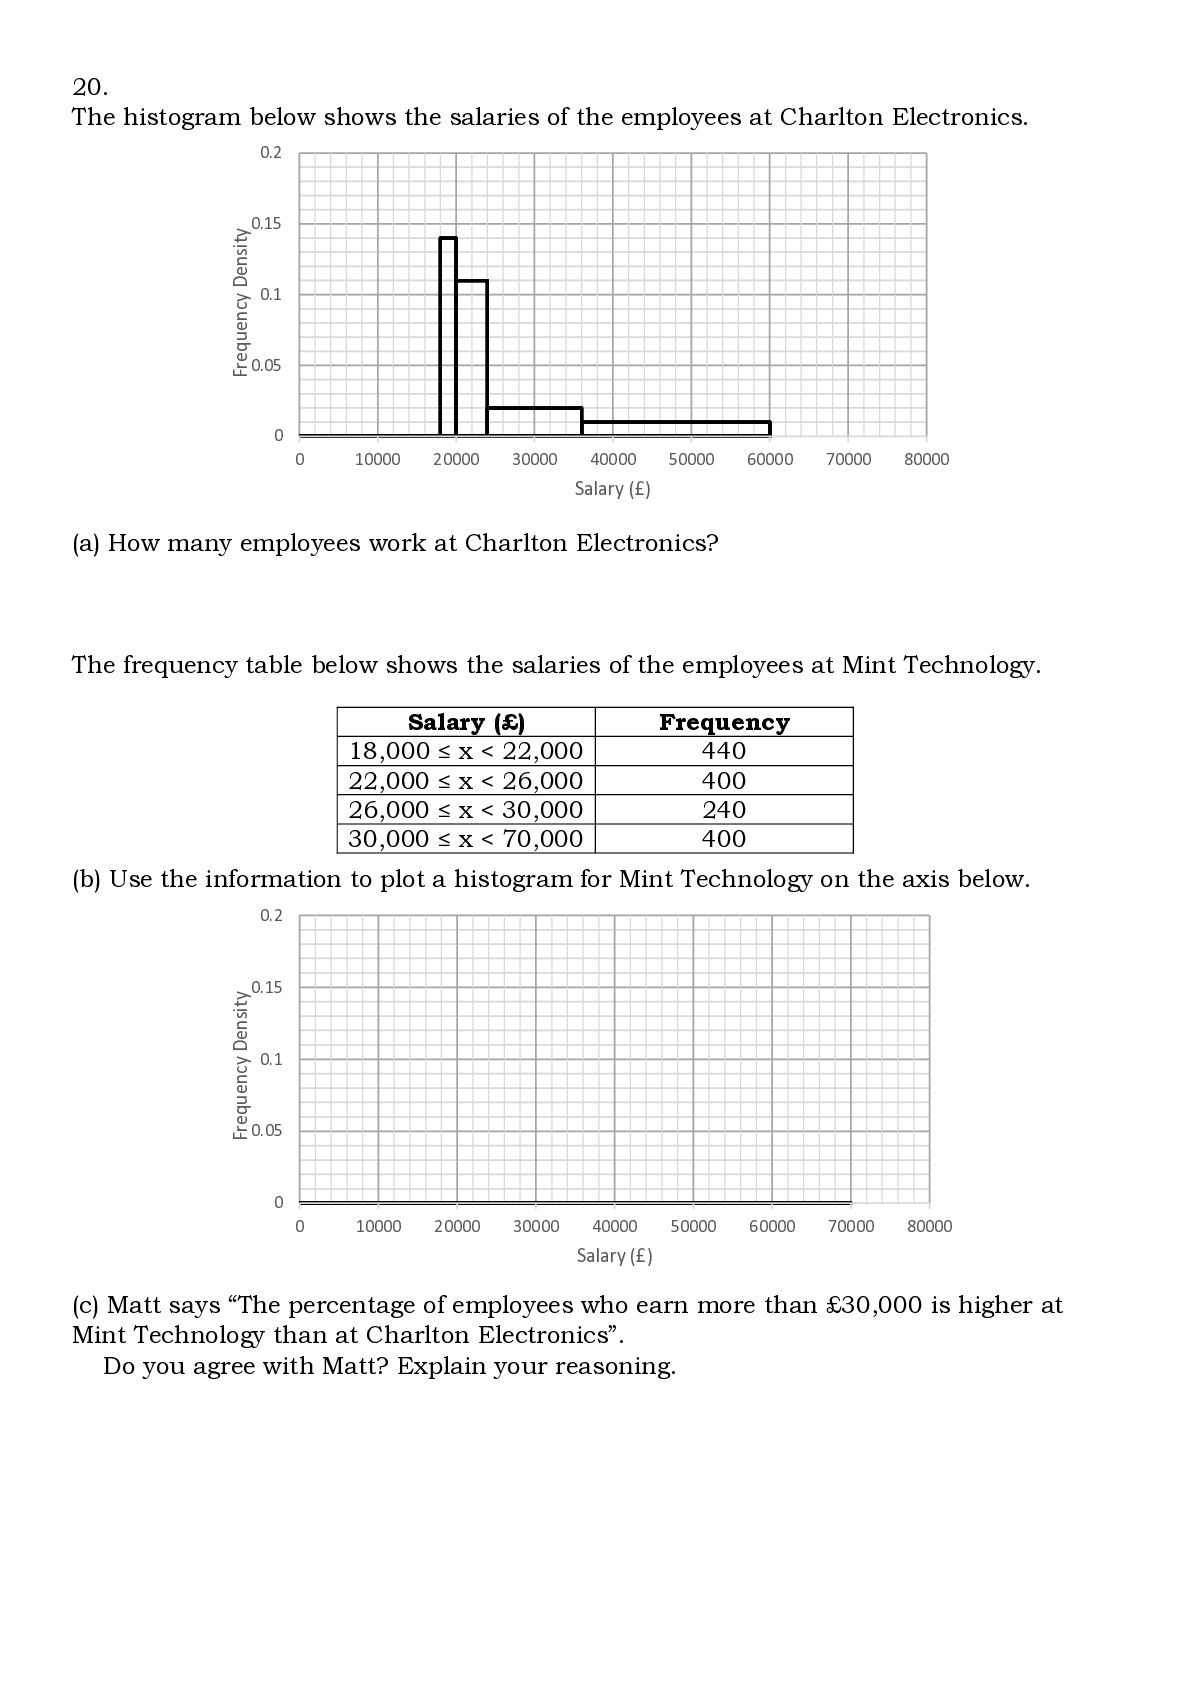
at Charlton Electronics. 0.2 Frequency Density 0.15 0.1 0.05 0 0 10000 20000 30000 40000 50000 60000 70000 80000 Salary (£) (a) How many employees work at Charlton Electronics? The frequency table below shows the salaries of the employees at Mint Technology. Salary (£) 18,000 ≤ x < 22,000 22,000 ≤ x < 26,000 26,000 ≤ x < 30,000 30,000 ≤ x < 70,000 Frequency 440 400 240 400 (b) Use the information to plot a histogram for Mint Technology on the axis below. 0.2 Frequency Density 0.15 0.1 0.05 0 0 10000 20000 30000 40000 50000 60000 70000 80000 Salary (£) (c) Matt says “The percentage of employees who earn more than £30,000 is higher at Mint Technology than at Charlton Electronics”. Do you agree with Matt? Explain your reasoning.
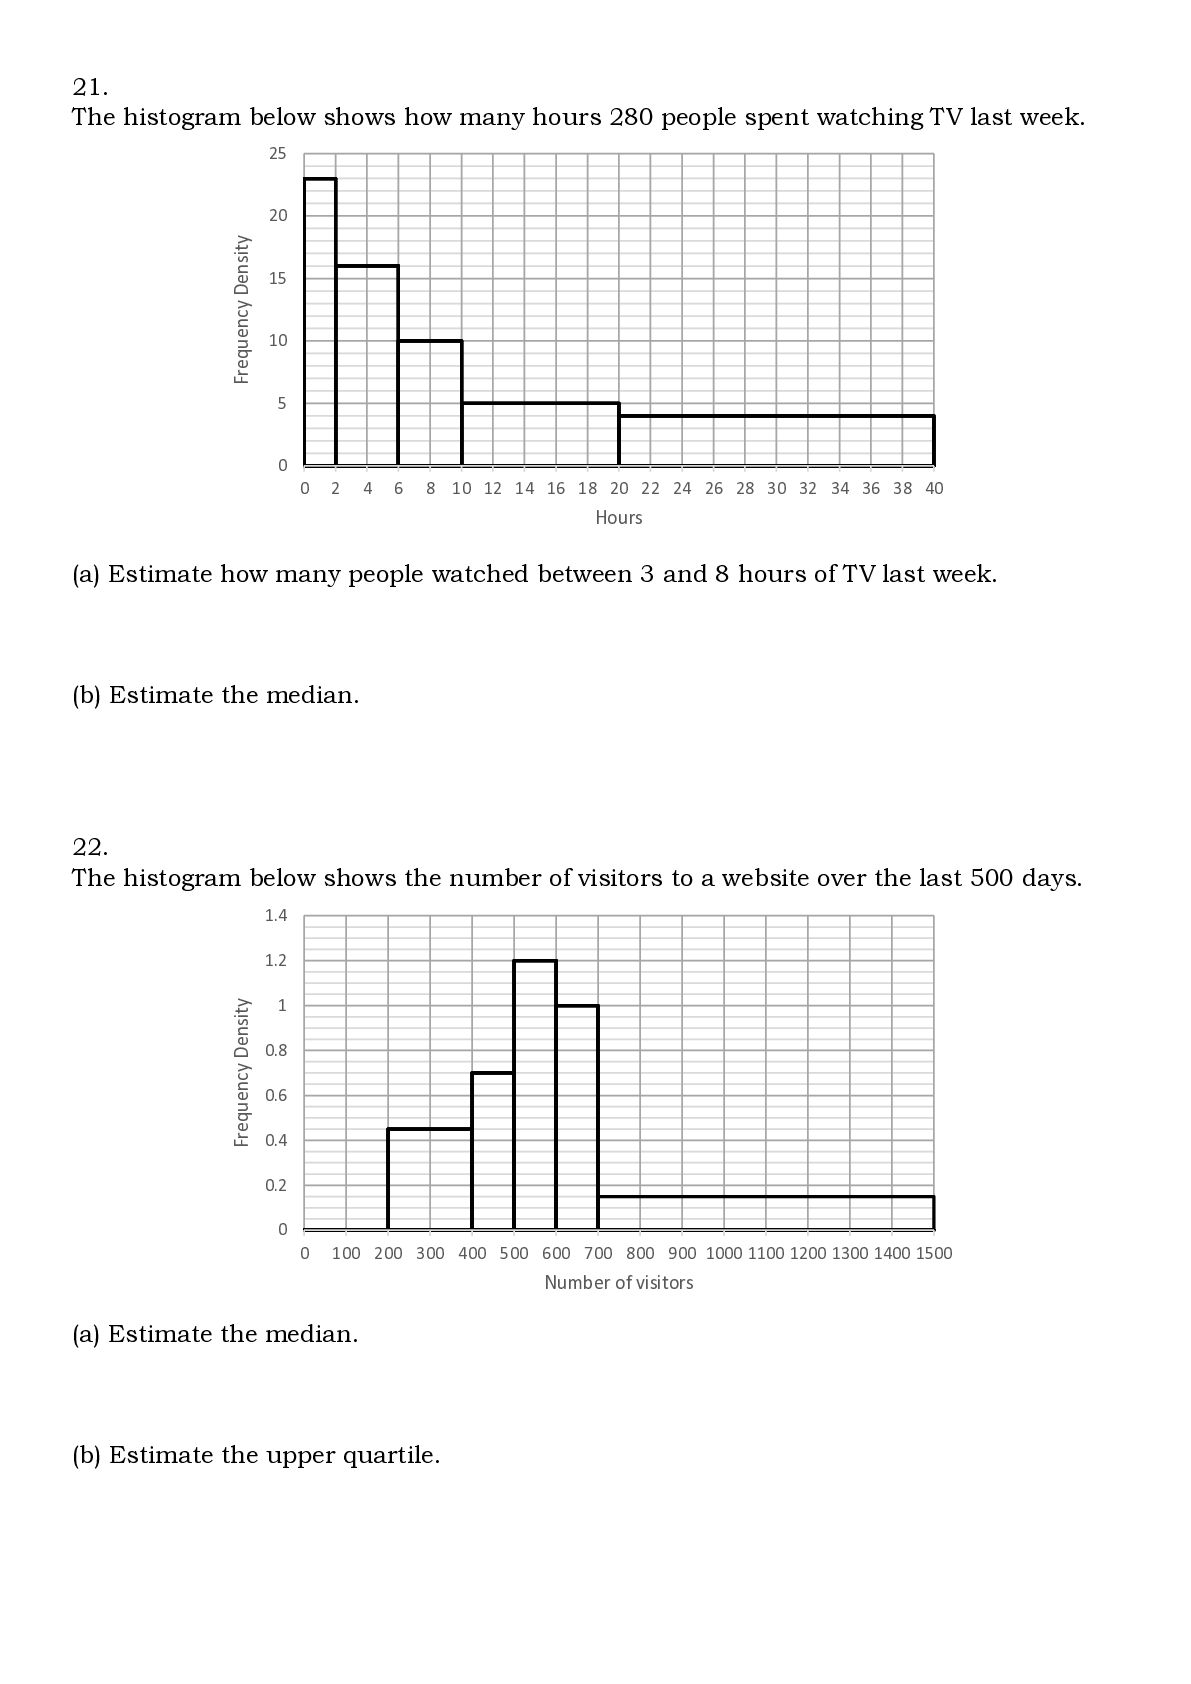
spent watching TV last week. 25 Frequency Density 20 15 10 5 0 0 2 4 6 8 10 12 14 16 18 20 22 24 26 28 30 32 34 36 38 40 Hours (a) Estimate how many people watched between 3 and 8 hours of TV last week. (b) Estimate the median. 22. The histogram below shows the number of visitors to a website over the last 500 days. 1.4 Frequency Density 1.2 1 0.8 0.6 0.4 0.2 0 0 100 200 300 400 500 600 700 800 900 1000 1100 1200 1300 1400 1500 Number of visitors (a) Estimate the median. (b) Estimate the upper quartile.


 alisontutors23
 terasawat
 bvr7352
 signer
 hiola
 yatabe
 soudai
 pawan_pharm
 akiraasano
 fmarot
 kekekenta
 techseoconnect
 stuffmc
 nikkihalliwell
 ianozsvald
 kastner
 michaelherold
 inesmontani
 jcasabona
 schlessera
 deanohume
 madoxten
 addyosmani