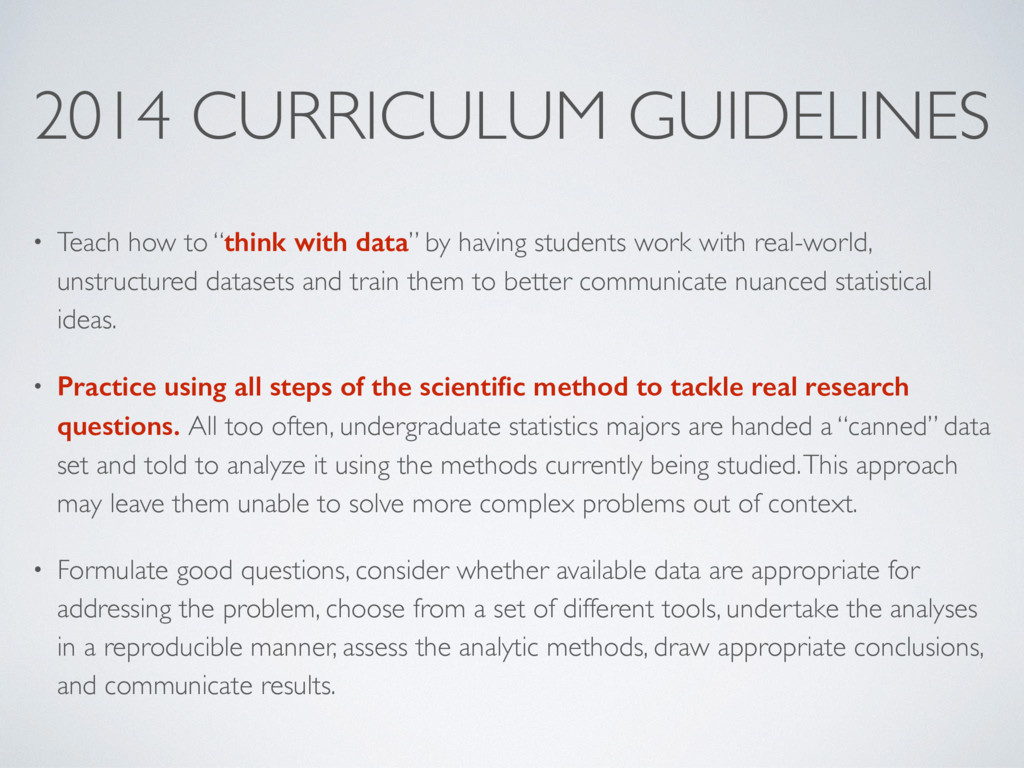
by having students work with real-world, unstructured datasets and train them to better communicate nuanced statistical ideas. • Practice using all steps of the scientific method to tackle real research questions. All too often, undergraduate statistics majors are handed a “canned” data set and told to analyze it using the methods currently being studied. This approach may leave them unable to solve more complex problems out of context. • Formulate good questions, consider whether available data are appropriate for addressing the problem, choose from a set of different tools, undertake the analyses in a reproducible manner, assess the analytic methods, draw appropriate conclusions, and communicate results.
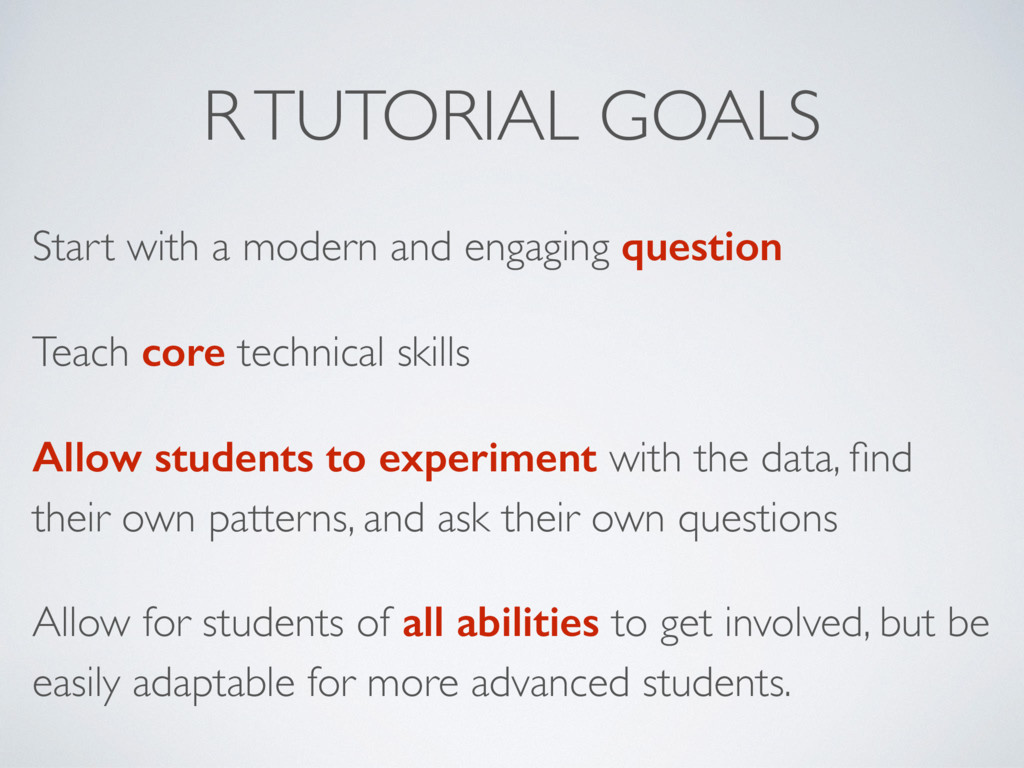
Teach core technical skills Allow students to experiment with the data, find their own patterns, and ask their own questions Allow for students of all abilities to get involved, but be easily adaptable for more advanced students.
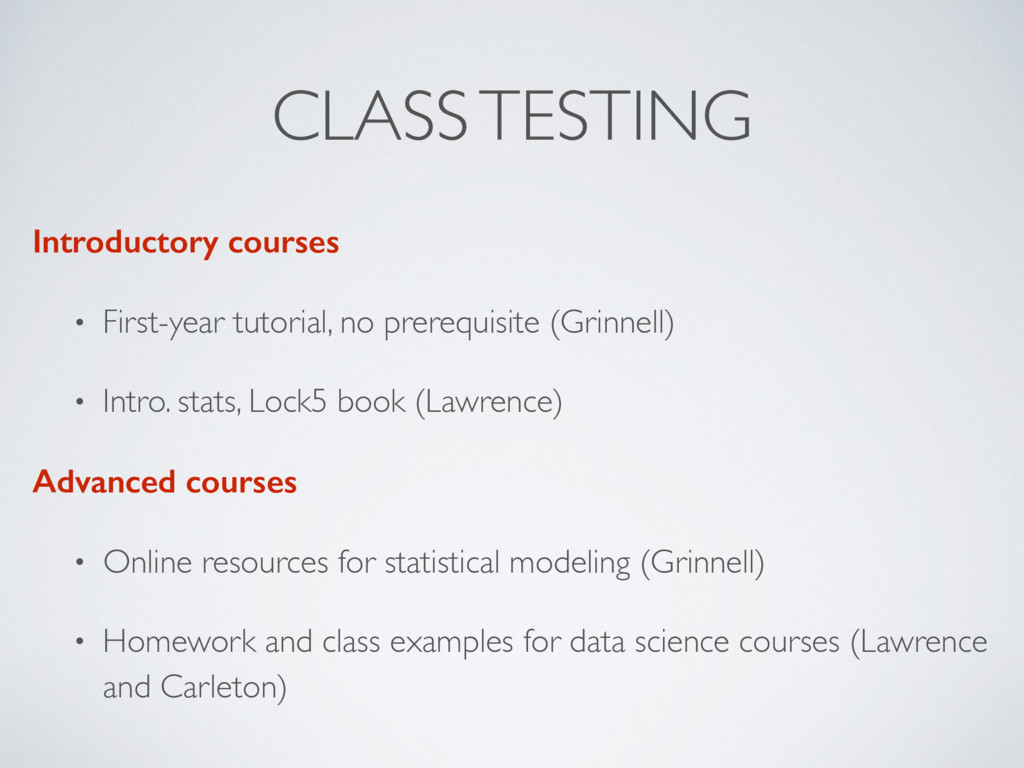
• Intro. stats, Lock5 book (Lawrence) Advanced courses • Online resources for statistical modeling (Grinnell) • Homework and class examples for data science courses (Lawrence and Carleton)
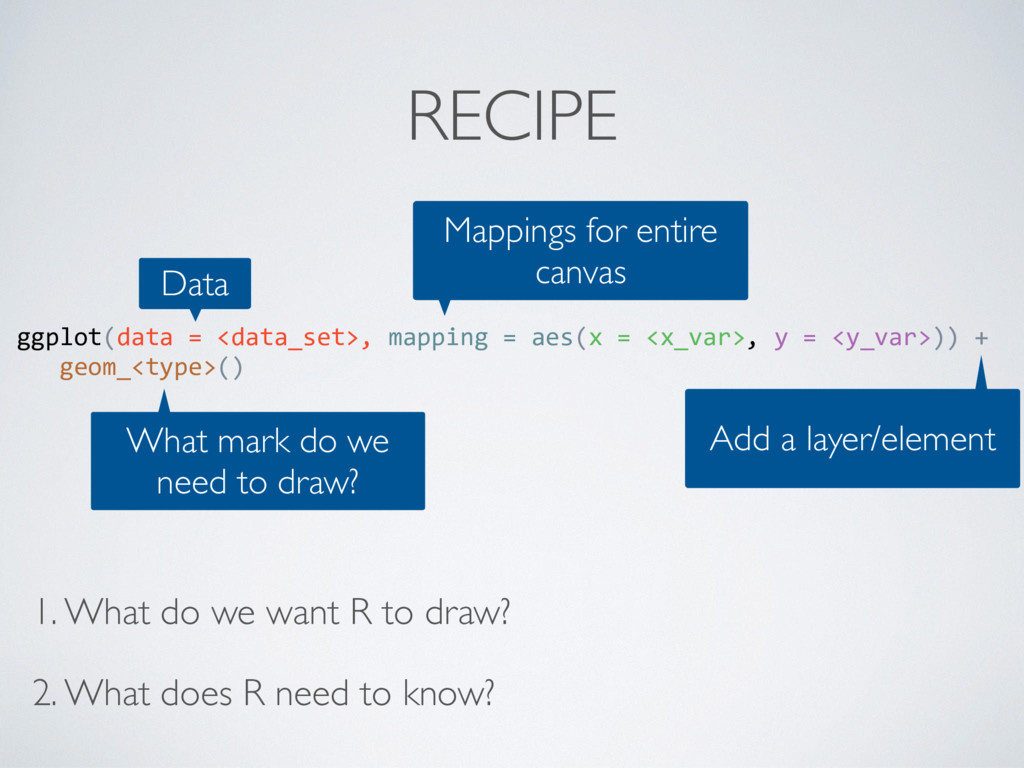
= <y_var>)) + geom_<type>() Data Mappings for entire canvas Add a layer/element What mark do we need to draw? 1. What do we want R to draw? 2. What does R need to know?
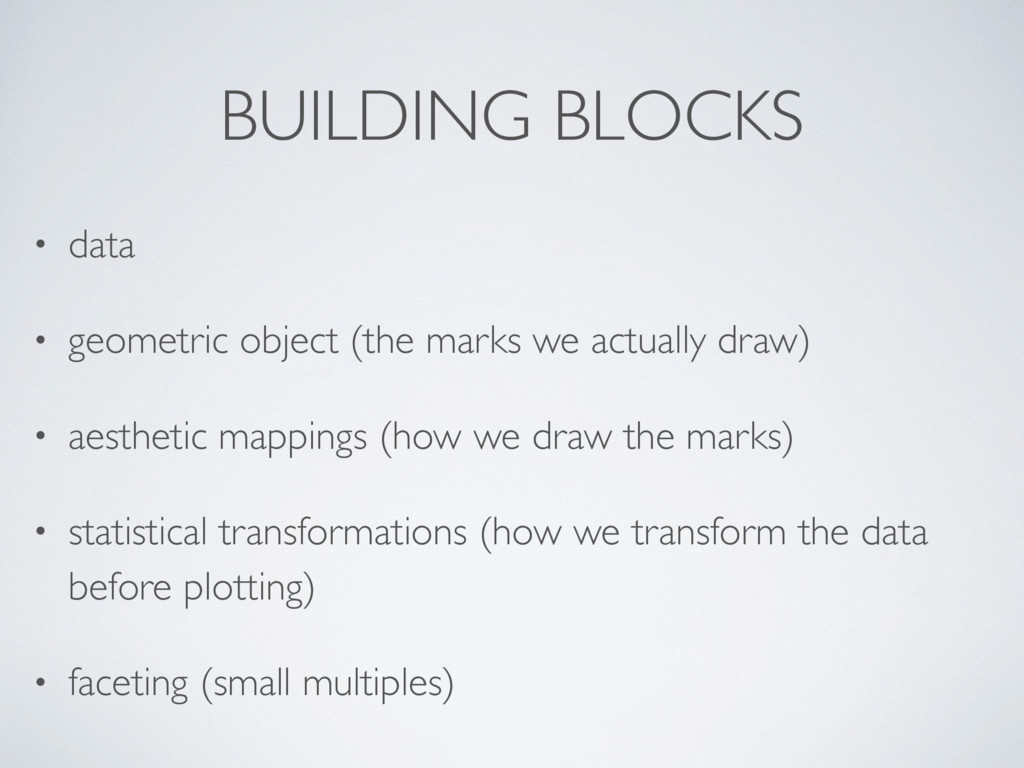
actually draw) • aesthetic mappings (how we draw the marks) • statistical transformations (how we transform the data before plotting) • faceting (small multiples)
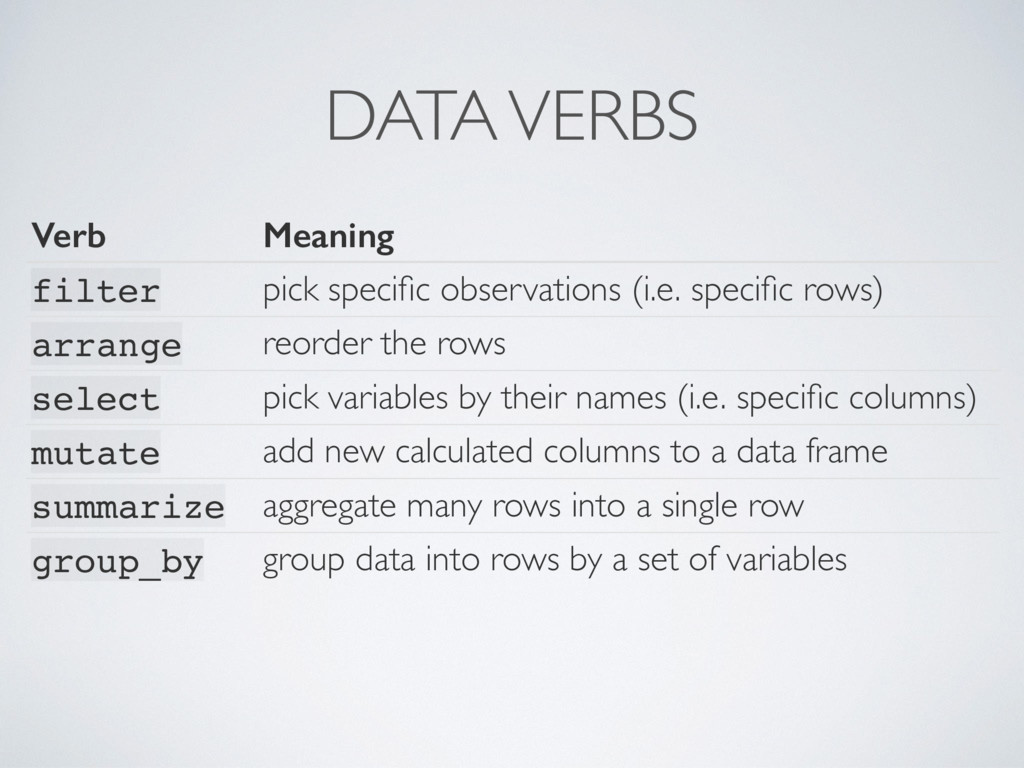
rows) arrange reorder the rows select pick variables by their names (i.e. specific columns) mutate add new calculated columns to a data frame summarize aggregate many rows into a single row group_by group data into rows by a set of variables
• Extra help in lab is necessary • Ask IT early to install/update packages and activate .Rmd sharing • Review what code chunks are and how they work for the first few weeks