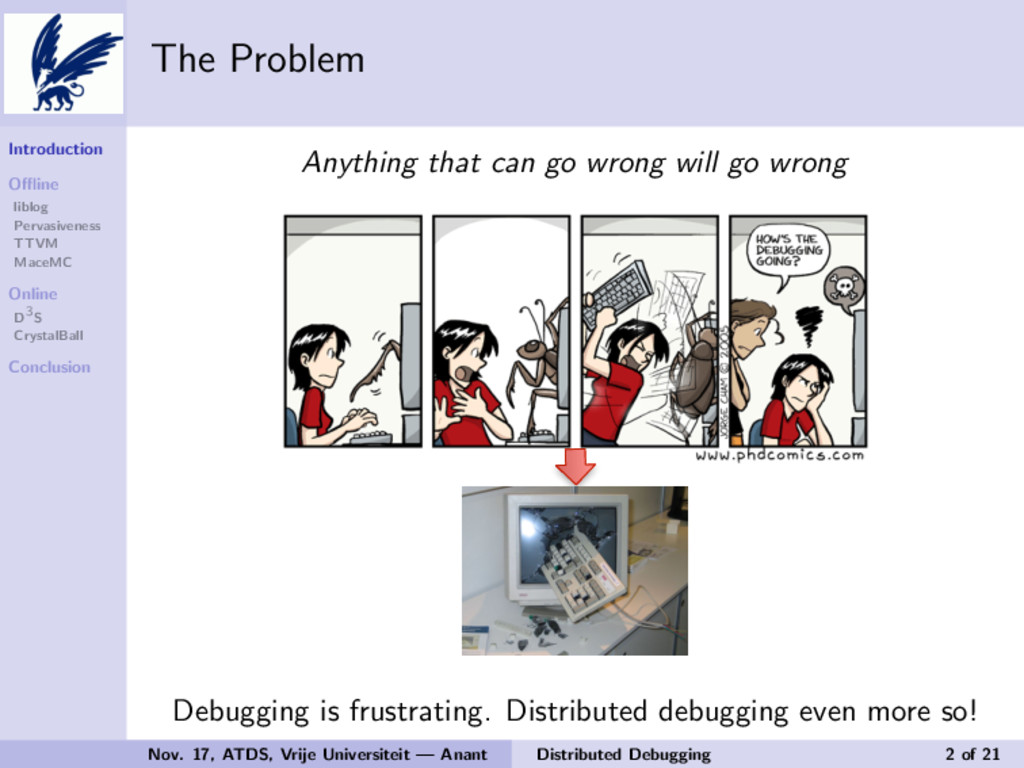
The Problem Anything that can go wrong will go wrong Debugging is frustrating. Distributed debugging even more so! Nov. 17, ATDS, Vrije Universiteit — Anant Distributed Debugging 2 of 21
Why is this hard? Errors are rarely reproducible Non-determinism plays a big role in distributed systems Remote machines appear to crash more often! Interactions between several different components (possibly written in different languages) running on different computers are extremely intricate Communication is unreliable and asynchronous Existing debuggers are simply inadequate Nov. 17, ATDS, Vrije Universiteit — Anant Distributed Debugging 3 of 21
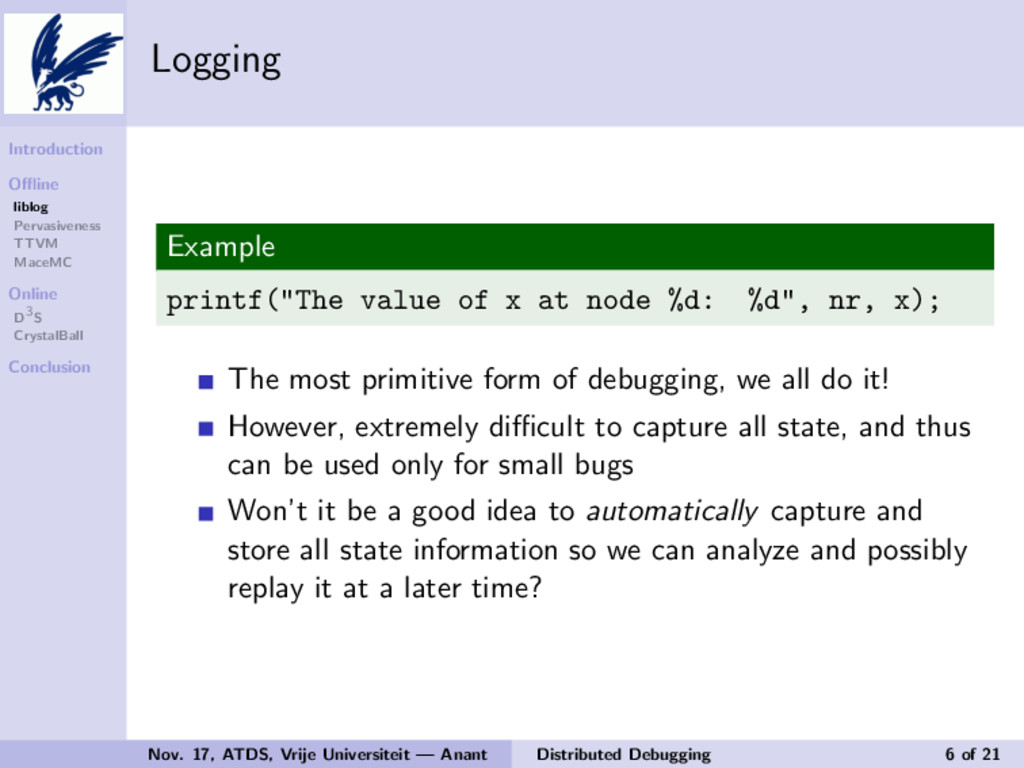
Logging Example printf("The value of x at node %d: %d", nr, x); The most primitive form of debugging, we all do it! However, extremely difficult to capture all state, and thus can be used only for small bugs Won’t it be a good idea to automatically capture and store all state information so we can analyze and possibly replay it at a later time? Nov. 17, ATDS, Vrije Universiteit — Anant Distributed Debugging 6 of 21
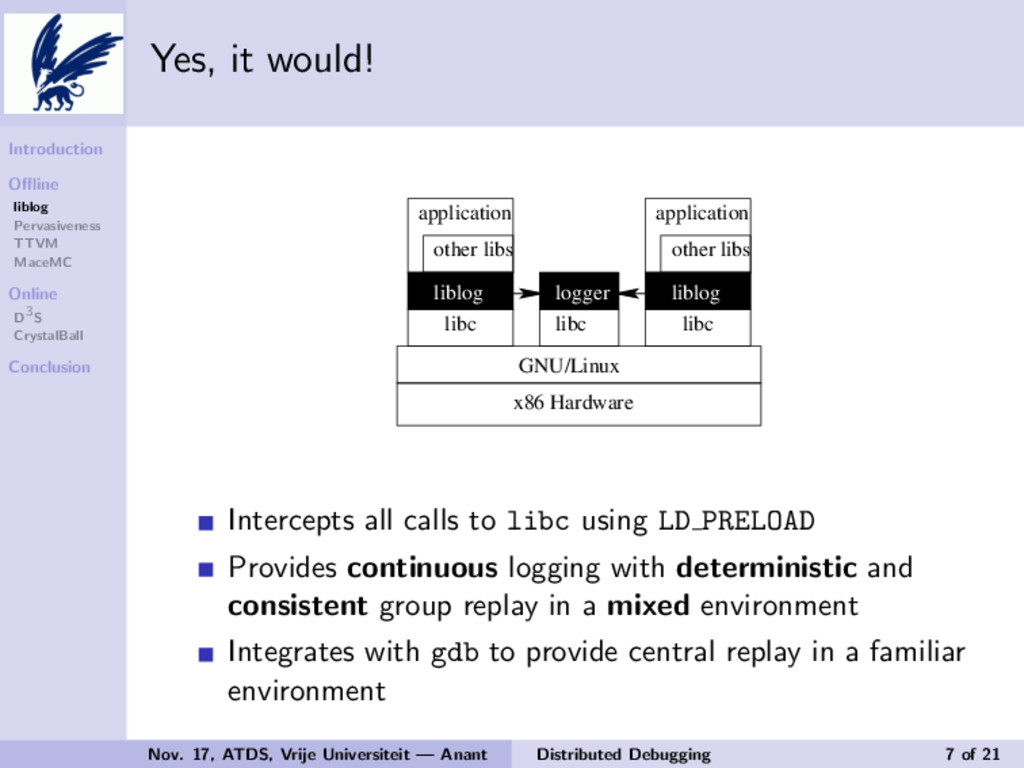
Yes, it would! application libc other libs application libc other libs libc GNU/Linux x86 Hardware liblog liblog logger Figure 1: Logging: liblog intercepts calls to libc and sends results to logger process. The latter asynchronously compresses and writes the logs to local storage. 2.1 Shared Library Implementation The core of our debugging tool is a shared library (the eponym liblog), which intercepts calls to libc (e.g., select, gettimeofday) and logs their results. Our start-up scripts use the LD PRELOAD linker variable to interpose liblog between libc and the application and its other libraries (see Figure 1). liblog runs on Linux/x86 computers and supports POSIX C/C++ appli- cations. We chose to build a library-based tool because op- 2.2 Message Tagging and The second defining aspect of our proach to replaying network com contents of all incoming message process can be replayed independ This flexibility comes at the space (cf. Section 5) but is w projects have tried the alternative, and regenerating message conte cannot do so because we operate i with non-logging processes. Eve tion logs may be unavailable for ing disk or network failure. So far we satisfy one requireme to coordinate these individual re vide another, Consistent Group R we embed 8-byte Lamport clocks ing messages during execution an clocks to schedule replay. The c ensures that the timestamps in eac “happens-before” relationship. Th venient way to correlate messag ception events, so we can trace co chine to machine. To make the virtual clocks mor Intercepts all calls to libc using LD PRELOAD Provides continuous logging with deterministic and consistent group replay in a mixed environment Integrates with gdb to provide central replay in a familiar environment Nov. 17, ATDS, Vrije Universiteit — Anant Distributed Debugging 7 of 21
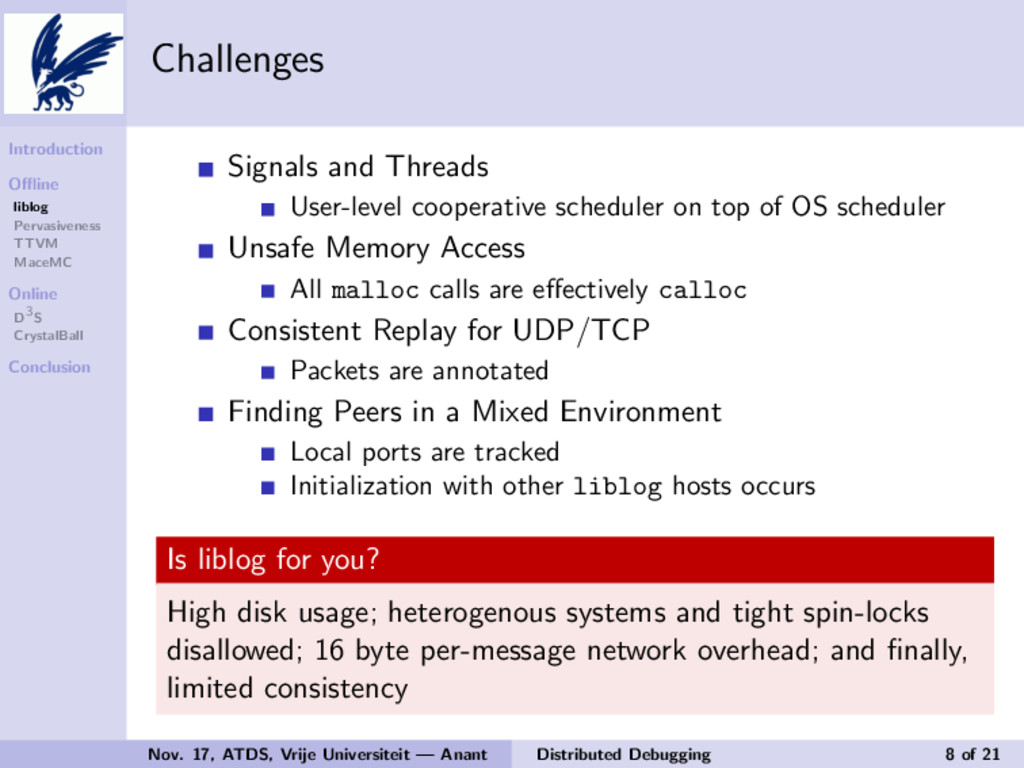
Challenges Signals and Threads User-level cooperative scheduler on top of OS scheduler Unsafe Memory Access All malloc calls are effectively calloc Consistent Replay for UDP/TCP Packets are annotated Finding Peers in a Mixed Environment Local ports are tracked Initialization with other liblog hosts occurs Is liblog for you? High disk usage; heterogenous systems and tight spin-locks disallowed; 16 byte per-message network overhead; and finally, limited consistency Nov. 17, ATDS, Vrije Universiteit — Anant Distributed Debugging 8 of 21
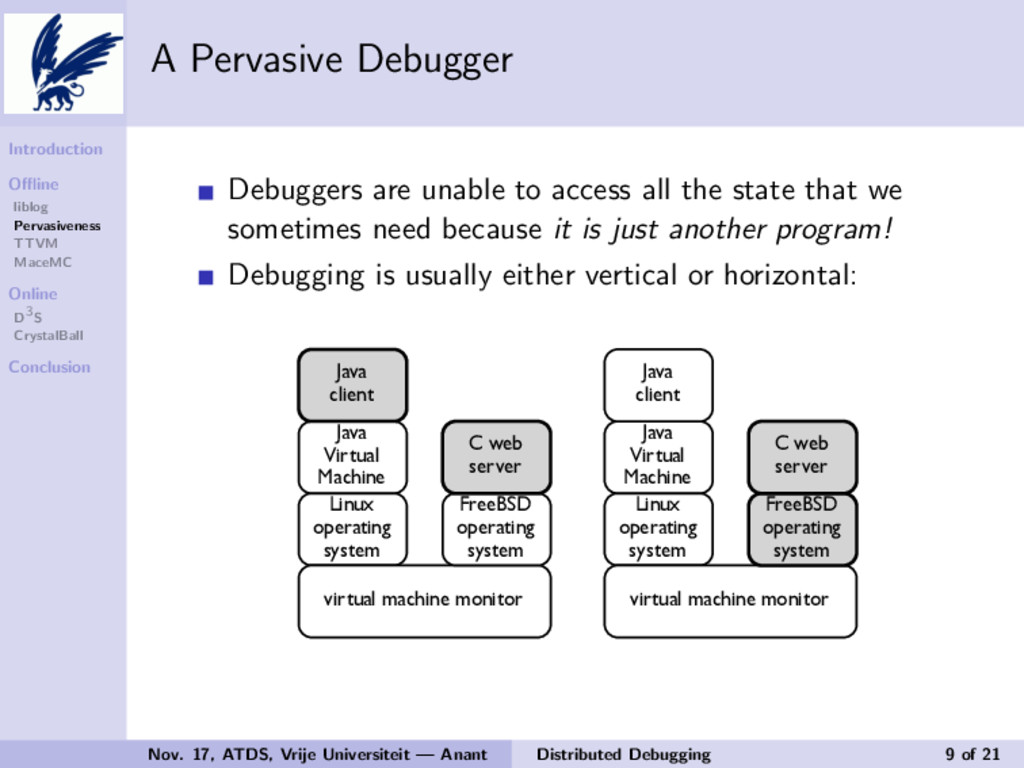
A Pervasive Debugger Debuggers are unable to access all the state that we sometimes need because it is just another program! Debugging is usually either vertical or horizontal: Java Virtual Machine Java client Linux operating system virtual machine monitor FreeBSD operating system C web server Java Virtual Machine Java client Linux operating system virtual machine monitor FreeBSD operating system C web server (a) (b) Figure 1: (a) Horizontal debugging with multiple Although and cont point in the targe issued ex debug ta 2.2 E The st of its me of each e debug ta software each targ threads, Auxilia cannot d Nov. 17, ATDS, Vrije Universiteit — Anant Distributed Debugging 9 of 21
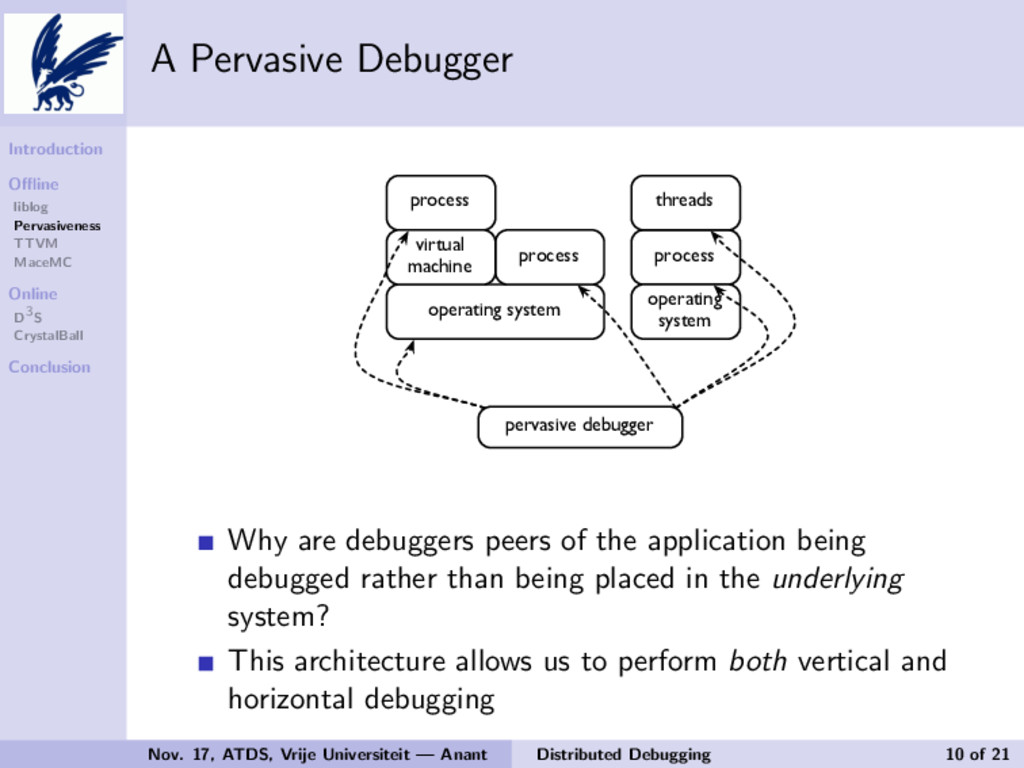
A Pervasive Debugger process operating system process virtual machine process operating system threads pervasive debugger Figure 2: The pervasive debugger enables both hor- izontal and vertical debugging. nipulate a process or thread. Pervasive debugging extends this to include the underlying software and hardware layers; all interactions between the process and its environment can be examined. We term this vertical debugging. The environment in which an operating system executes encompasses more than just memory and processor state. The operating system can access all of the various hardware devices attached to the machine. Therefore, in the context 3.1 Ext Each deb its environm memory ad ters) of the amine the include the example, a file that ha 3.1.1 Ob Since the target, the environmen scheme sim vironment. identify a fi length to id connections the name a If we con then we can records in t be read, th Why are debuggers peers of the application being debugged rather than being placed in the underlying system? This architecture allows us to perform both vertical and horizontal debugging Nov. 17, ATDS, Vrije Universiteit — Anant Distributed Debugging 10 of 21
Let’s Look at an Application A Virtual Machine Monitor (VMM) is capable of monitoring and logging a lot more state than is possible by a userspace library! By running an application inside a VM, we are able to log not just CPU instructions, memory, network and disk I/O, but also interrupts, clock values, signals We can also log byte-for-byte network, memory and disk Remember, device drivers can have bugs too! Time-traveling virtual machines take advantage of all this by using User Mode Linux (UML) and integrating with gdb to provide a unified, easy to use debugging environment Nov. 17, ATDS, Vrije Universiteit — Anant Distributed Debugging 11 of 21
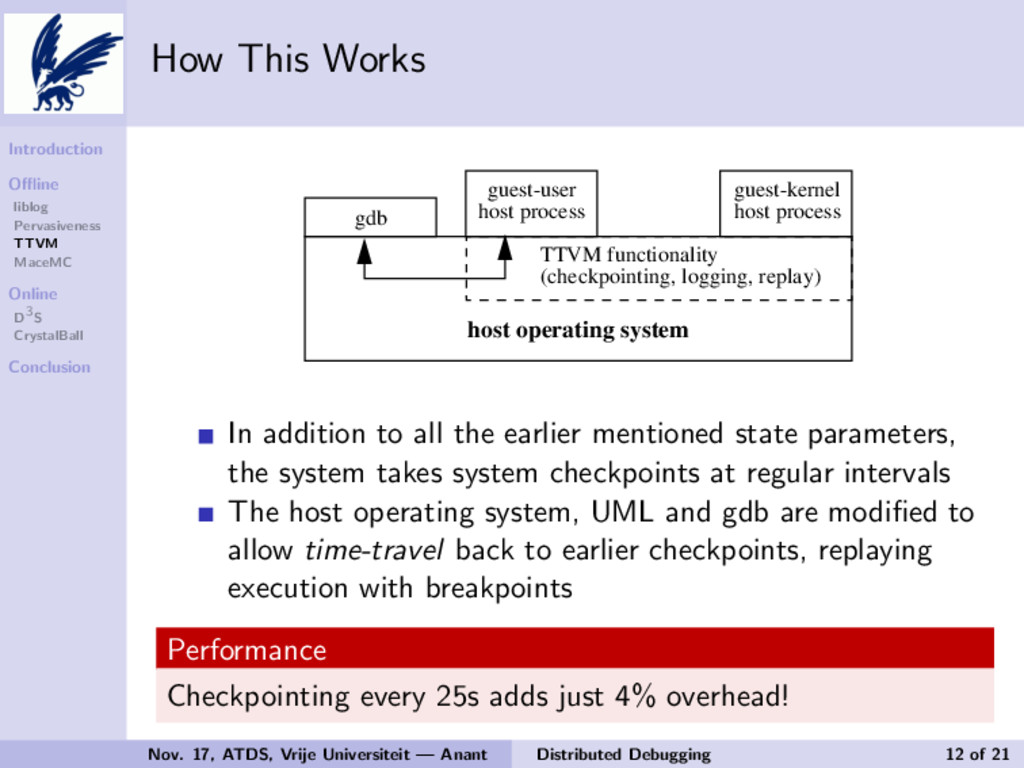
How This Works host operating system guest-kernel host process guest-user host process gdb TTVM functionality (checkpointing, logging, replay) Figure 1: System structure: UML runs as two user pro- cesses on the host Linux OS, the guest-kernel host pro- cess and the guest-user host process. TTVM’s ability to travel forward and back in time is implemented by mod- ifying the host OS. We extend gdb to make use of this time traveling functionality. gdb communicates with the guest-kernel host process via a remote serial protocol. Finally, a VMM offers a narrow and well-defined in- terface: the interface of a physical machine. This inter- card is emu driver; the mmap and m vice interru GIO signals output. The uses these h ware. Using a raises the is to an OS t that one ca ging the gu VMM: as th the hardwa para-virtual and it becom be debugge may also m In addition to all the earlier mentioned state parameters, the system takes system checkpoints at regular intervals The host operating system, UML and gdb are modified to allow time-travel back to earlier checkpoints, replaying execution with breakpoints Performance Checkpointing every 25s adds just 4% overhead! Nov. 17, ATDS, Vrije Universiteit — Anant Distributed Debugging 12 of 21
Model Checking We’ve seen what tools we can use after a bug has been found, is there anything we can do before deploying an application? Model checkers, which basically perform state space exploration, can be used to gain confidence in a system MaceMC is one such model checker, tailored for verifying large distributed applications Definition Safety Property A property that should always be satisfied Liveness Property A property that should always be eventually satisfied Nov. 17, ATDS, Vrije Universiteit — Anant Distributed Debugging 13 of 21
Life, Death and the Critical Transition Each node is a state machine At each step in the execution, an event handler for a particular pending event at a node is called Thus, the entire system is to be represented as a giant state machine with specific event handlers defined Of course, liveness and safety properties are required by MaceMC to start the checks Definition Critical transition A transition from a live state to a dead state, from which a liveness property can never be satisfied Nov. 17, ATDS, Vrije Universiteit — Anant Distributed Debugging 14 of 21
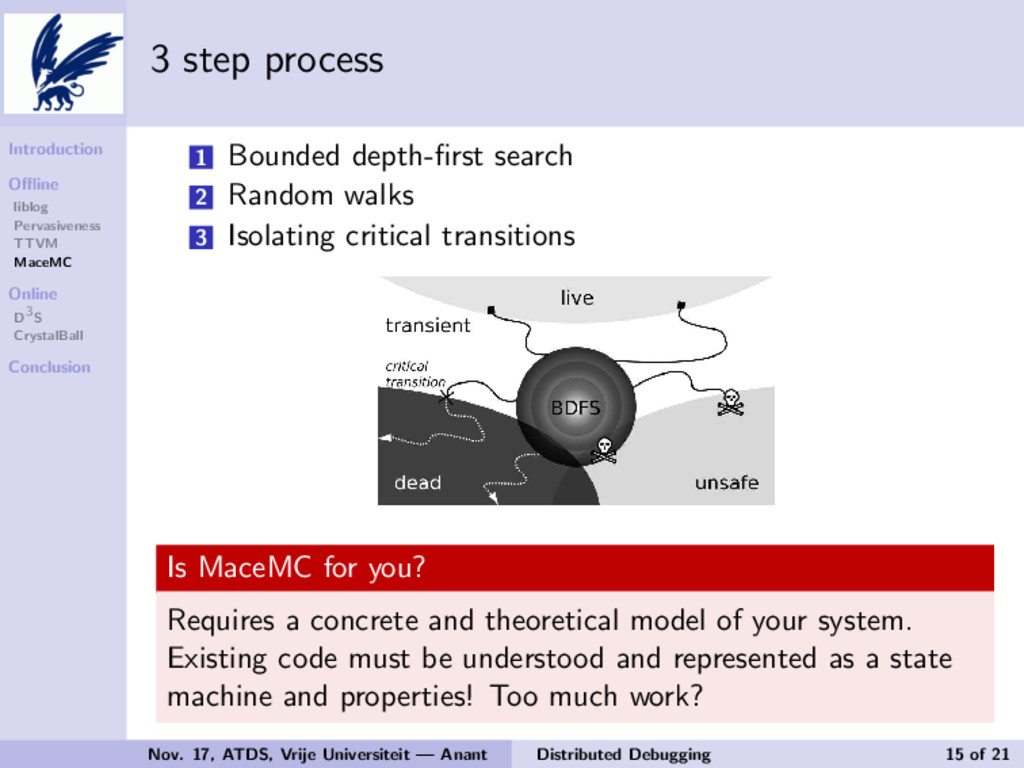
3 step process 1 Bounded depth-first search 2 Random walks 3 Isolating critical transitions operty would have to capture the following: “Al- each message in the inflight queue or retrans- mer queue, either the message is in flight (in the or in the destination’s receive socket buffer, or ver’s corresponding IncomingConnection.next han the message sequence number, or an ac- gment is in flight from the destination to the ith a sequence number greater than or equal to age sequence number, or the same acknowledg- n the sender’s receive socket buffer, or a re- ge is in flight between the sender and receiver direction), or . . .” Thus, attempting to spec- n conditions with safety properties quickly be- erwhelming and hopelessly complicated, espe- en contrasted with the simplicity and succinct- he liveness property: “Eventually, for all n in inflightSize() = 0,” i.e., that eventually there no packets in flight. we recommend the following iterative process for ubtle protocol errors in complex concurrent envi- . A developer begins by writing desirable high- ness properties. As these liveness properties typ- Figure 1: State Exploration We perform bounded depth-first search (BDFS) from the initial state (or search prefix): most pe- riphery states are indeterminate, i.e., not live, and thus are either dead or transient. We execute random walks from the periphery states and flag walks not reaching live states as suspected violat- ing executions. tialization typically takes many more transitions (cf. Fig- ure 2), the vast majority of states reached at the periphery of the exhaustive search are not live. We call these states Is MaceMC for you? Requires a concrete and theoretical model of your system. Existing code must be understood and represented as a state machine and properties! Too much work? Nov. 17, ATDS, Vrije Universiteit — Anant Distributed Debugging 15 of 21
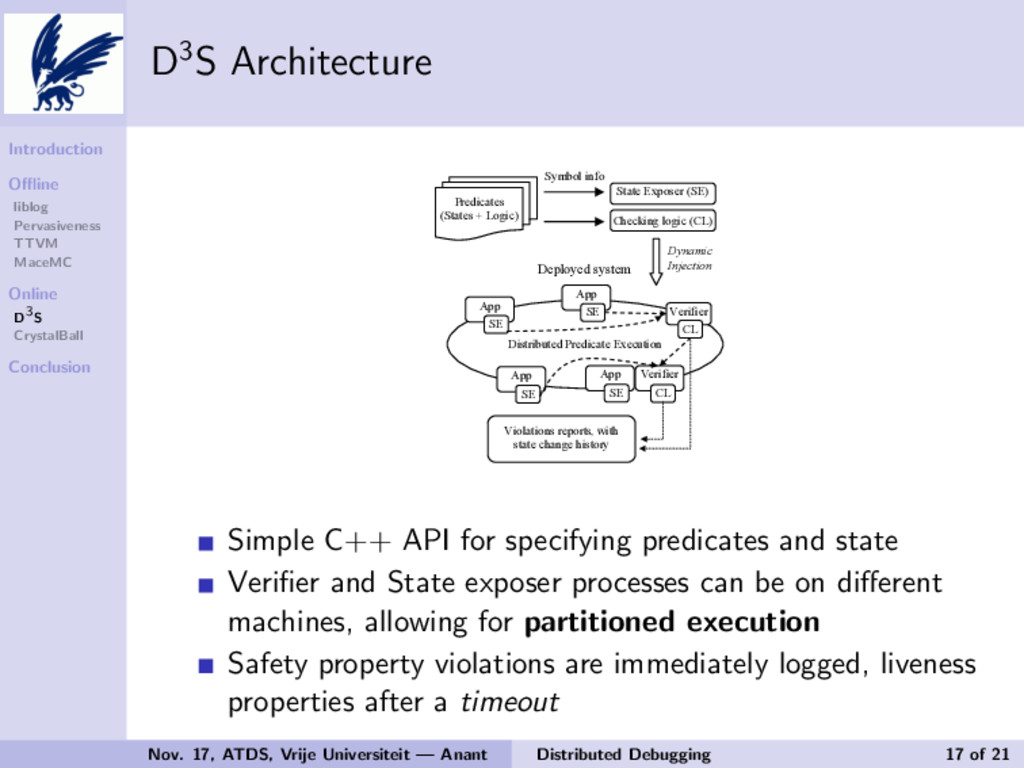
Debugging Deployed Solutions Because real debuggers run on a live, deployed system! Instead of verifying liveness properties in advance, why not let the system itself do a state space search for you? D3S does exactly that by letting the developer specify predicates that are automatically verified by the system on-the-fly. Key Challenge Allowing developers to express predicates easily, verify those predicates in a distributed manner with minimal overhead, and without disrupting the system! Nov. 17, ATDS, Vrije Universiteit — Anant Distributed Debugging 16 of 21
Steering Deployed Solutions So, D3S can detect property violations but can we do anything about it? CrystalBall attempts to give us an ultimate solution by gazing at the future and steering the application away from disaster! Many distributed application block on network I/O, let’s use those free CPU cycles for some useful work... Packet transmission is faster in simulation than in reality Can we stay one-state-step ahead at all times? Nov. 17, ATDS, Vrije Universiteit — Anant Distributed Debugging 18 of 21
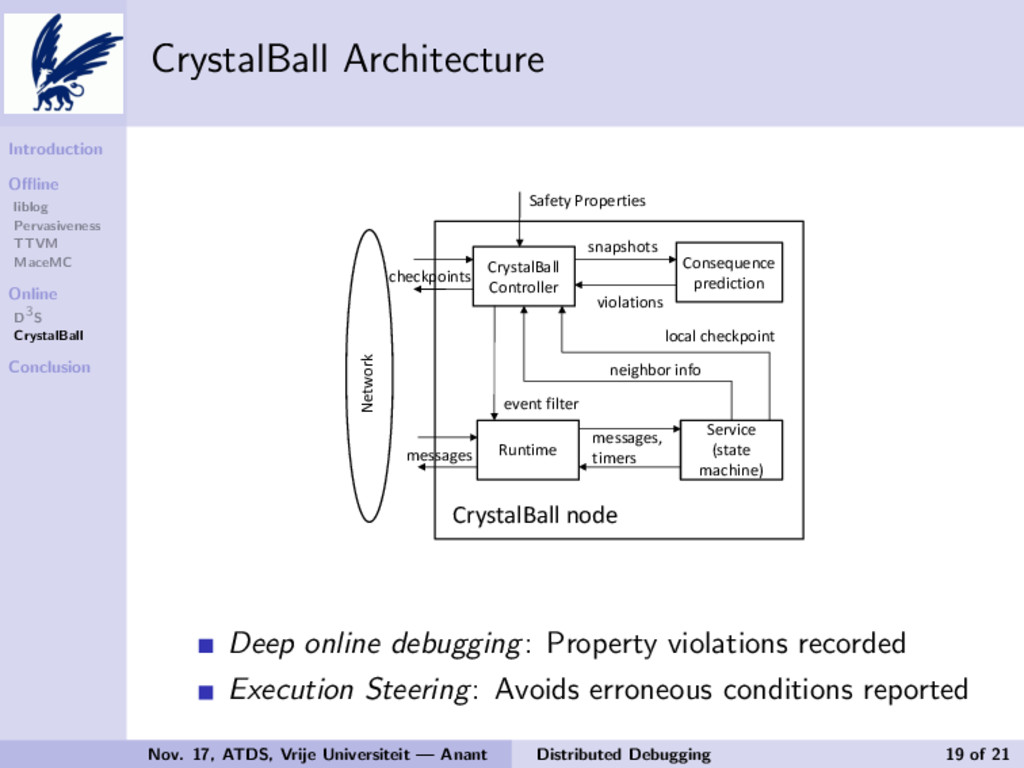
CrystalBall Architecture n low-probability events, timately triggered the in- can take a very long time ncounter such a scenario, ssible bugs difficult. Our ves system debugging by e that combines some of nd static analysis. consistencies before they ssible because the model ket transmission in time tency, and because it can me shorter than than the aspect of our approach sibility: adapt the behav- n the fly and avoid an in- echnique execution steer- ly on a history of past in- !"#$%&'(&'') !*+%"*''," !*+$,-.,+/,) 0",12/%2*+ /3,/40*2+%$ $+&0$3*%$ '*/&')/3,/40*2+% 52*'&%2*+$ 6,%7*"4 +,2839*")2+:* ;&:,%#)<"*0,"%2,$ =.+%2>, ;,"52/, ?$%&%,) >&/32+,@ ,5,+%):2'%," >,$$&8,$A) %2>,"$ >,$$&8,$) !"#$%&'(&'')+*1, 6,%7*"4 +,2839*")2+:* Figure 4: High-level overview of CrystalBall join request of n13 and to break the TCP connection with it. Node n13 eventually succeeds joining the random tree (perhaps after some other nodes have joined first). The stale information about n13 in n9 is removed once n9 Deep online debugging: Property violations recorded Execution Steering: Avoids erroneous conditions reported Nov. 17, ATDS, Vrije Universiteit — Anant Distributed Debugging 19 of 21
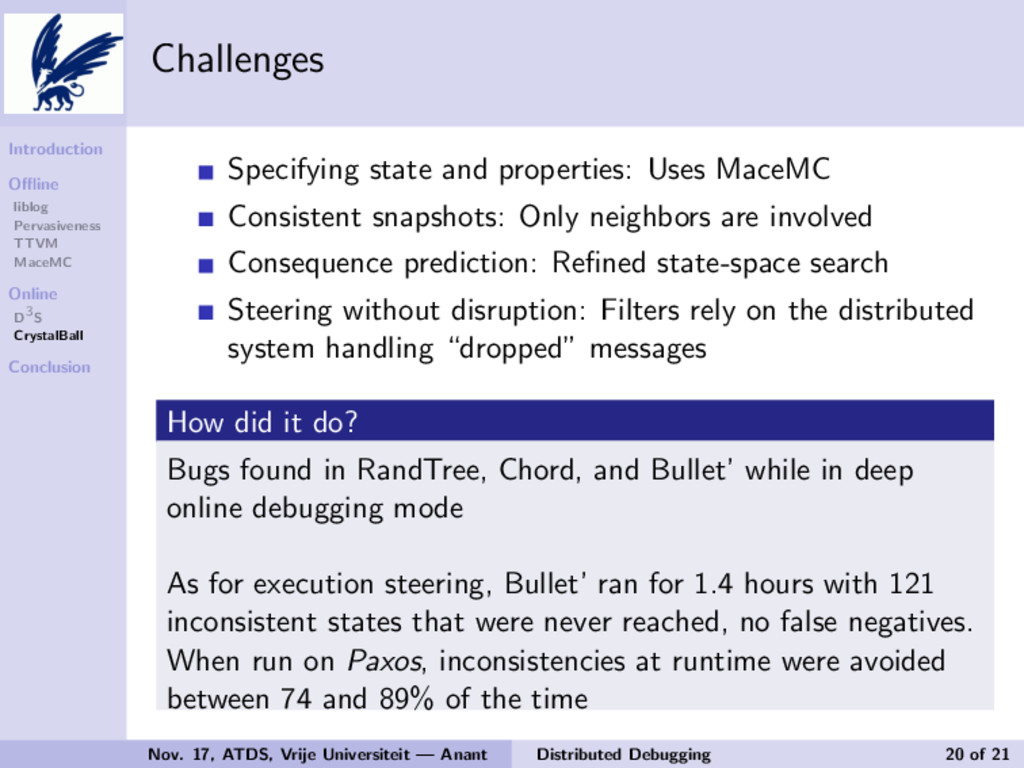
Challenges Specifying state and properties: Uses MaceMC Consistent snapshots: Only neighbors are involved Consequence prediction: Refined state-space search Steering without disruption: Filters rely on the distributed system handling “dropped” messages How did it do? Bugs found in RandTree, Chord, and Bullet’ while in deep online debugging mode As for execution steering, Bullet’ ran for 1.4 hours with 121 inconsistent states that were never reached, no false negatives. When run on Paxos, inconsistencies at runtime were avoided between 74 and 89% of the time Nov. 17, ATDS, Vrije Universiteit — Anant Distributed Debugging 20 of 21
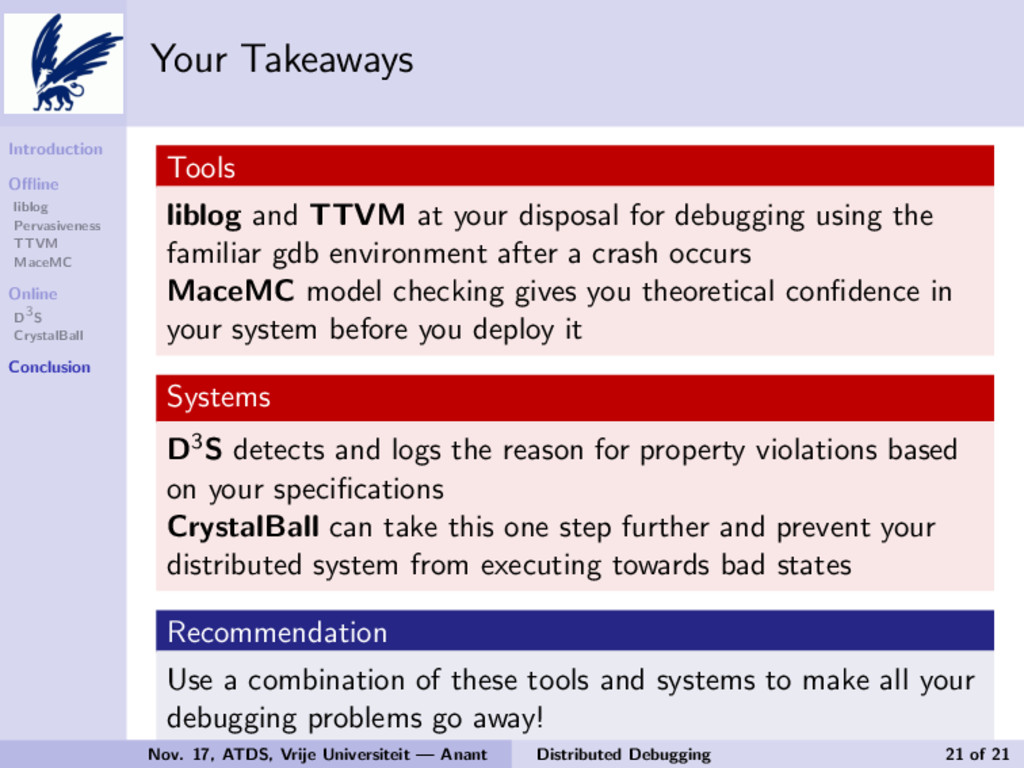
Your Takeaways Tools liblog and TTVM at your disposal for debugging using the familiar gdb environment after a crash occurs MaceMC model checking gives you theoretical confidence in your system before you deploy it Systems D3S detects and logs the reason for property violations based on your specifications CrystalBall can take this one step further and prevent your distributed system from executing towards bad states Recommendation Use a combination of these tools and systems to make all your debugging problems go away! Nov. 17, ATDS, Vrije Universiteit — Anant Distributed Debugging 21 of 21
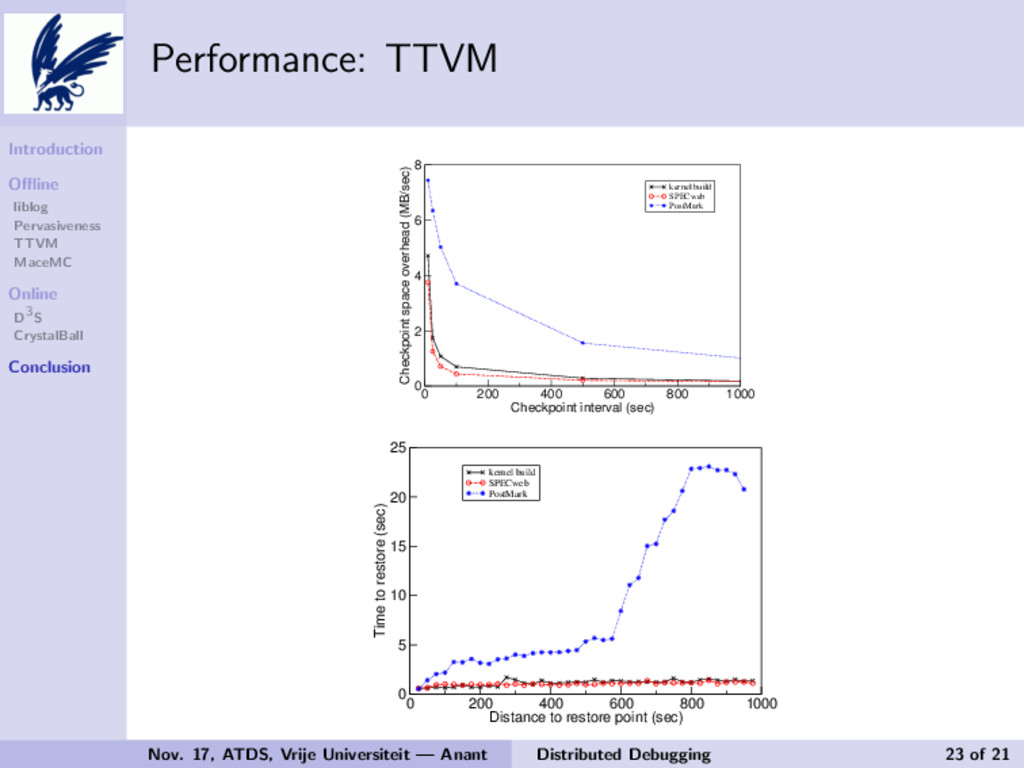
Performance: TTVM 0 200 400 600 800 1000 Checkpoint interval (sec) 0 2 4 6 8 Checkpoint space overhead (MB/sec) kernel build SPECweb PostMark Figure 5: Space overhead of checkpoints. For long runs, programmers will cap the maximum space used by checkpoints by deleting selected checkpoints. ten after a checkpoint. More frequent checkpoints thus cause the disk block allocation to resemble a pure log- ging disk, which improved the spatial locality for writes for PostMark. Because checkpointing adds little time overhead, it is reasonable to perform long debugging runs while checkpointing relatively often (say, every 25 seconds). 0 200 4 Distance 0 5 10 15 20 25 Time to restore (sec) kernel build SPECweb PostMark Figure 6: Time to 6 Experience and In this section, we descr to track down four kern verse gdb commands si rience provides anecdot reverse debugging is a u does not constitute an u ing the benefits of rever 200 400 600 800 1000 Checkpoint interval (sec) kernel build SPECweb PostMark ce overhead of checkpoints. For long ers will cap the maximum space used by 0 200 400 600 800 1000 Distance to restore point (sec) 0 5 10 15 20 25 Time to restore (sec) kernel build SPECweb PostMark Nov. 17, ATDS, Vrije Universiteit — Anant Distributed Debugging 23 of 21
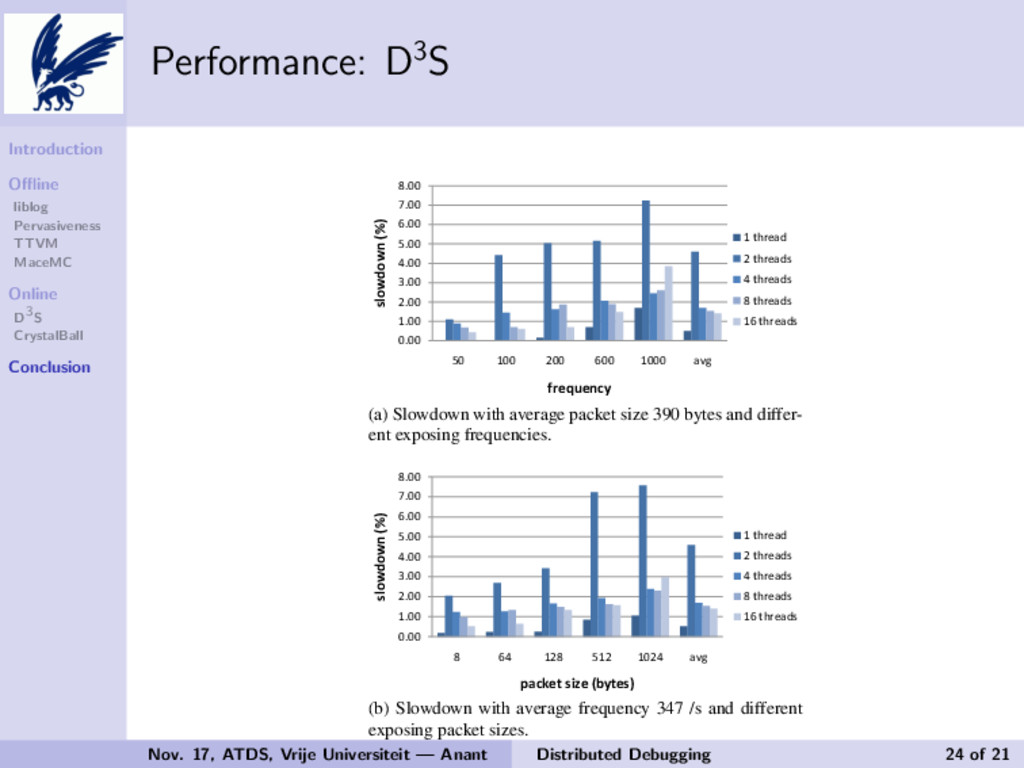
Performance: D3S 21 26 31 36 41 46 51 56 Peer index ons of peers (free riders are 46∼56). n whether or not we have useful When a system already has spec- s (e.g., at the component level), omplex, well designed systems, e the predicates can check the in- edicates is mostly an easy task for ey are allowed to use sequential pshots. When a system doesn’t on (e.g., in performance debug- 0.00 1.00 2.00 3.00 4.00 5.00 6.00 7.00 8.00 50 100 200 600 1000 avg slowdown (%) frequency 1 thread 2 threads 4 threads 8 threads 16 threads (a) Slowdown with average packet size 390 bytes and differ- ent exposing frequencies. 0.00 1.00 2.00 3.00 4.00 5.00 6.00 7.00 8.00 8 64 128 512 1024 avg slowdown (%) packet size (bytes) 1 thread 2 threads 4 threads 8 threads 16 threads (b) Slowdown with average frequency 347 /s and different exposing packet sizes. Nov. 17, ATDS, Vrije Universiteit — Anant Distributed Debugging 24 of 21
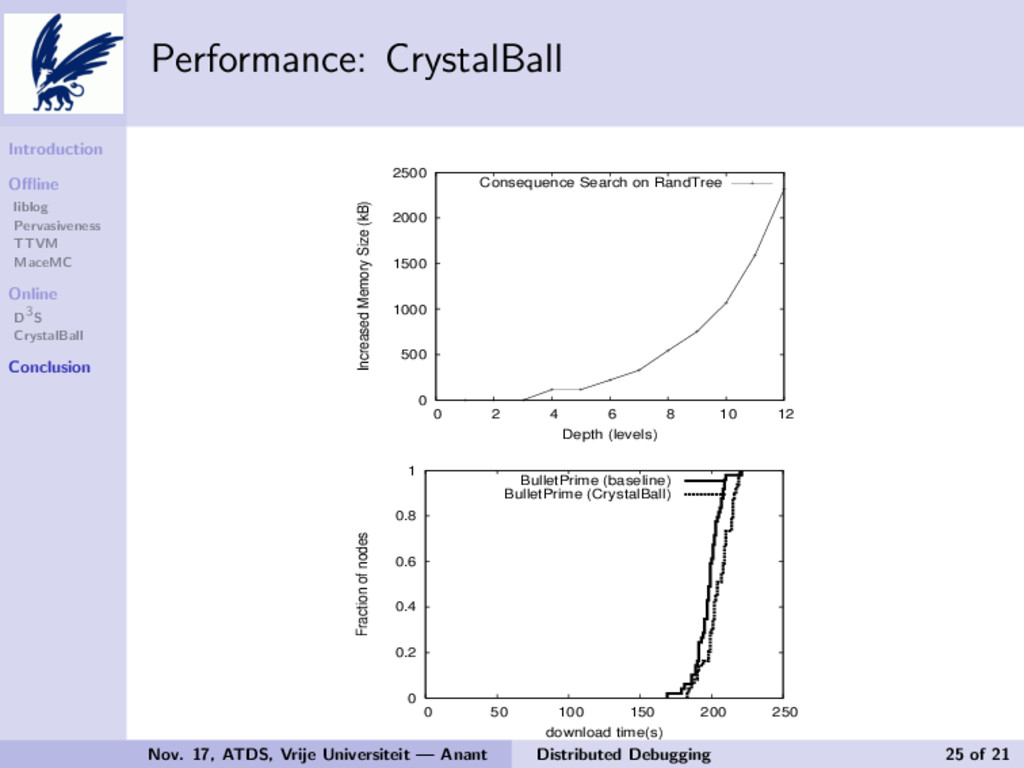
Performance: CrystalBall ween rounds uniformly at random be- seconds. As we can see in Figure 9, ecution steering is successful in avoid- tency at runtime 74% and 89% of the nd bug2, respectively. In these cases, s model checking after node C recon- es checkpoints from other participants. e model checker for 3.3 seconds, C suc- s that the scenario in the second round violation of the safety property, and it event filter. The avoidance by execution s when C rejects the Propose message ution steering is more effective for bug2 s the former involves resetting B. This ore time for the model checker to redis- m by: i) consequence prediction, or ii) ously identified erroneous scenario. Im- heck engages 25% and 7% of the time, cases when model checking did not have uncover the inconsistency), and prevents y from occurring later, by dropping the rom C at node B. CrystalBall could not tion for only 1% and 4% of the runs, re- cause for these false negatives was the of the set of checkpoints. 0 500 1000 1500 2000 2500 0 2 4 6 8 10 12 Increased Memory Size (kB) Depth (levels) Consequence Search on RandTree Figure 10: The memory consumed by consequence prediction (RandTree, depths 7 to 8) fits in an L2 CPU cache. 0.2 0.4 0.6 0.8 1 Fraction of nodes BulletPrime (baseline) BulletPrime (CrystalBall) tween rounds uniformly at random be- 0 seconds. As we can see in Figure 9, xecution steering is successful in avoid- stency at runtime 74% and 89% of the and bug2, respectively. In these cases, ts model checking after node C recon- ves checkpoints from other participants. he model checker for 3.3 seconds, C suc- ts that the scenario in the second round violation of the safety property, and it event filter. The avoidance by execution ns when C rejects the Propose message cution steering is more effective for bug2 as the former involves resetting B. This more time for the model checker to redis- em by: i) consequence prediction, or ii) iously identified erroneous scenario. Im- check engages 25% and 7% of the time, cases when model checking did not have uncover the inconsistency), and prevents cy from occurring later, by dropping the from C at node B. CrystalBall could not ation for only 1% and 4% of the runs, re- cause for these false negatives was the of the set of checkpoints. mance Impact of CrystalBall , and bandwidth consumption. Be- 0 500 1000 1500 2000 2500 0 2 4 6 8 10 12 Increased Memory Size (kB) Depth (levels) Consequence Search on RandTree Figure 10: The memory consumed by consequence prediction (RandTree, depths 7 to 8) fits in an L2 CPU cache. 0 0.2 0.4 0.6 0.8 1 0 50 100 150 200 250 Fraction of nodes download time(s) BulletPrime (baseline) BulletPrime (CrystalBall) Nov. 17, ATDS, Vrije Universiteit — Anant Distributed Debugging 25 of 21