Upgrade to Pro — share decks privately, control downloads, hide ads and more …

Belgian Data Gaps

Belgian Data Gaps

A small study of Biodiversity data published by Belgium.

André Heughebaert

March 10, 2017
Tweet

More Decks by André Heughebaert

Other Decks in Research

Transcript

  1. BELGIAN DATA GAPS GBIF Webinar, 23 March 2017 , André

    Heughebaert Belgian Biodiversity Platform
  2. “the purpose of the ‘Data Gap Analysis’ is to identify

    discrepancies between current and ideal states (Research Data Strategy Working Group 2008) of the entire enterprise of biodiversity data management leading up to its publishing and usage (Chavan et al. 2010).” Best Practice Guide for Data Gap Analysis for Biodiversity Stakeholders Arturo H. Ariño, Vishwas Chavan and Javier Otegui
  3. AIMS Assess Data published by the Belgian BIF Find our

    strengths and weaknesses Determine where our Data Gaps lie ASSUMPTION Data published from Belgium should not differ from neighboring countries
  4. METHODOLOGY Use relative, NOT absolute numbers Compare Belgian percentages to

    France, Germany and the Netherlands (all VPs since 2001) Strength = significantly above Weakness = significantly below
  5. TOPICS 1. Type of data 2. Data completeness 3. Taxonomy,

    geography, time distribution 4. Georeferencing 5. Licensing 6. Indexing issues 7. Data repatriation 8. Multimedia
  6. RESULTS (1) BasisOfRecord Human Obs. 72.28% 70.22% 69.19% 68.90% Machine

    Obs. 20.54% 0.00% 0.00% 0.00% Specimen 5.05% 9.97% 17.90% 29.05% Fossil 0.00% 2.67% 0.70% 1.68%
  7. RESULTS (2) TaxonGroup Arachnids 2.64% 0.65% 0.02% 1.40% Bony fish

    4.38% 0.28% 1.07% 4.13% Insects 15.21% 9.23% 1.88% 10.27% Mammals 0.06% 1.40% 1.55% 0.20% Molluscs 0.19% 0.57% 0.45% 2.09% Sac Fungi 0.04% 0.63% 0.15% 0.63%
  8. RESULTS (3) Year < 1900 0.25% 0.73% 1.38% 1.07% 1900..1924

    0.45% 0.70% 0.56% 3.06% 1925..1949 4.78% 7.56% 0.44% 5.75% 1950..1974 11.47% 4.13% 0.90% 10.59% 1975..1999 22.50% 22.74% 3.25% 41.98% 2000..2017 58.59% 25.64% 11.18% 22.56%
  9. BELGIAN GAPS FOUND Whenever possible, we should try mobilize: 1.

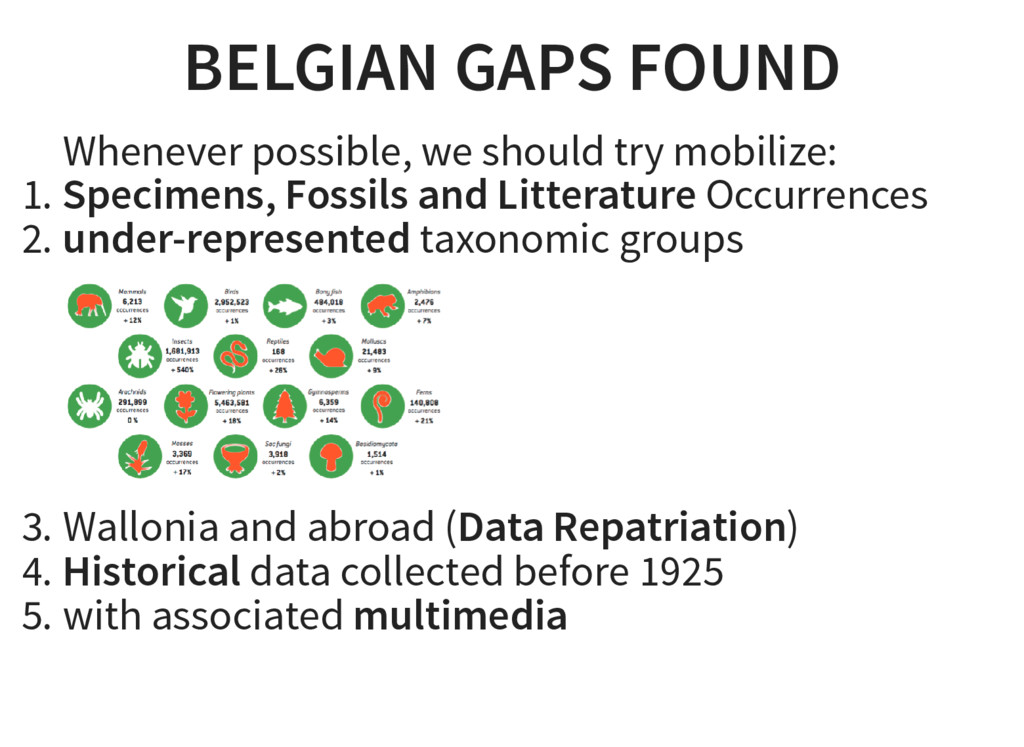
    Specimens, Fossils and Litterature Occurrences 2. under-represented taxonomic groups 3. Wallonia and abroad (Data Repatriation) 4. Historical data collected before 1925 5. with associated multimedia
  10. TAKE HOME MESSAGE Easy exercice ( < 2 man days)

    O en confirm our feeling, still some surprising results! Baseline for mobilization strategy Opportunity to expand our network
  11. THANK YOU , Made with HTML presentation framework, icons by

    Vathanx. This presentation is open under CC-BY-SA license. André Heughebaert Belgian Biodiversity Platform reveal.js