Upgrade to Pro — share decks privately, control downloads, hide ads and more …

Lessons Learned in Performance Optimization | C...

Lessons Learned in Performance Optimization | Capital Go 2018

I talk about how I learned to optimize Go code, at an algorithmic and code level, through the iterations on Capital One's format-preserving encryption project, and why I did so.

In particular, I go through my use of pprof and benchmarking, and most importantly, learning not to a) prematurely optimize (correctness is more important!) and b) where to draw the line as you dive into profiling. I touch on the Go toolchain's awesome utilities that are available, and then I'll go into how I actually used them to systematically find hotspots in my code. Further, I'll explain some of the common algorithmic and memory-usage optimizations I added.

And of course, all the lessons along the way!

Avatar for Anit Gandhi

Anit Gandhi

June 22, 2018

Other Decks in Programming

Transcript

  1. Lessons Learned in Performance Optimization Capital Go | Arlington, VA

    | June 22 2018 Anit Gandhi Capital One @anitgandhi @anitgandhi1 (Twitter)
  2. About Me • Software Engineer at Capital One and Critical

    Stack • Developing in Go for ~2 years • Built a high-performance service in Go used by every application at C1 that deals with sensitive data • Recently made my first contribution to Go • Maintain https://github.com/capitalone/fpe
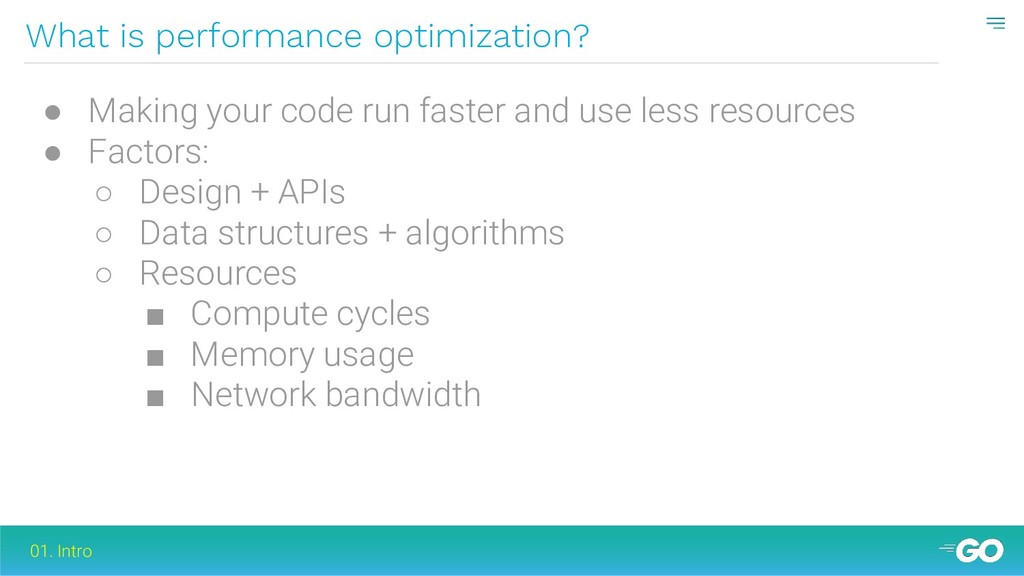
  3. What is performance optimization? 01. Intro • Making your code

    run faster and use less resources • Factors: ◦ Design + APIs ◦ Data structures + algorithms ◦ Resources ▪ Compute cycles ▪ Memory usage ▪ Network bandwidth
  4. Why is it important? 01. Intro • Better and/or faster

    user experience • More efficient use of resources • Save $$$
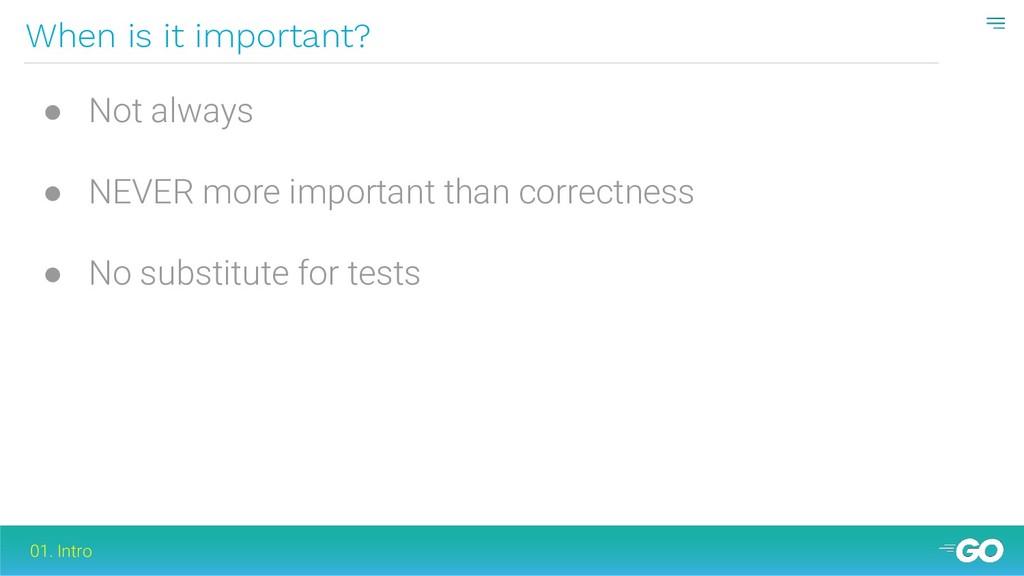
  5. When is it important? 01. Intro • Not always •

    NEVER more important than correctness • No substitute for tests
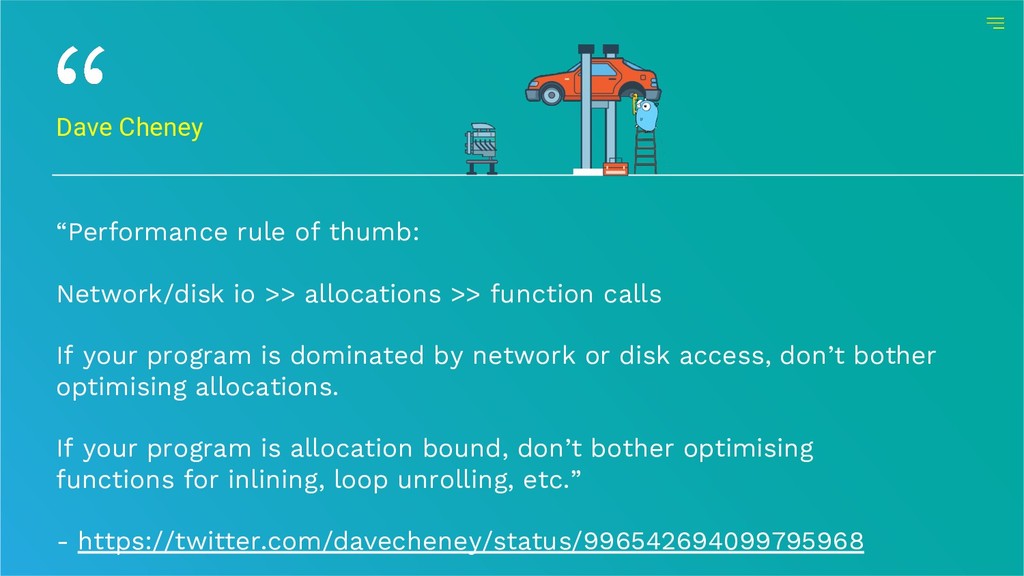
  6. “Performance rule of thumb: Network/disk io >> allocations >> function

    calls If your program is dominated by network or disk access, don’t bother optimising allocations. If your program is allocation bound, don’t bother optimising functions for inlining, loop unrolling, etc.” - https://twitter.com/davecheney/status/996542694099795968 Dave Cheney
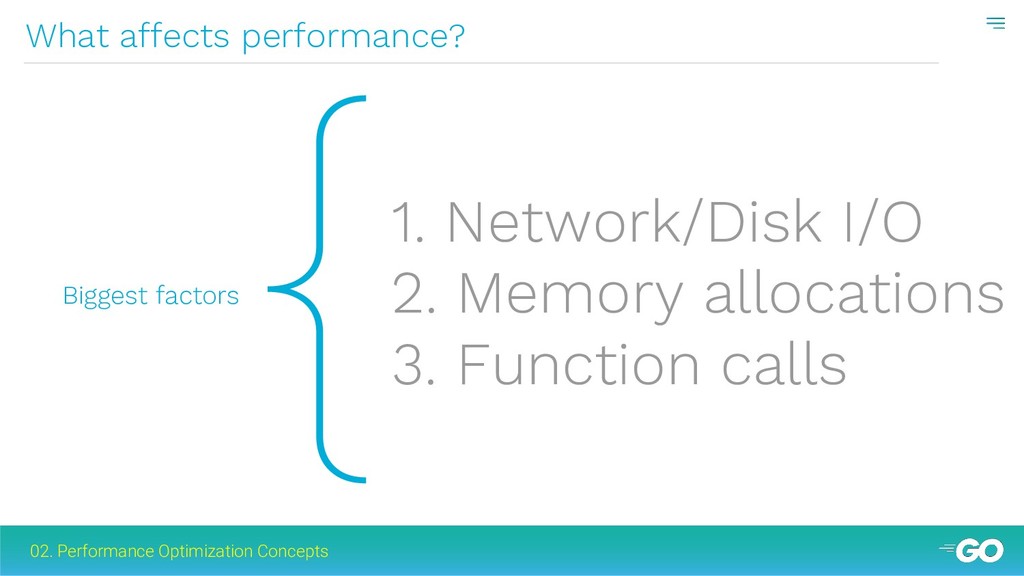
  7. { What affects performance? Biggest factors 1. Network/Disk I/O 2.

    Memory allocations 3. Function calls 02. Performance Optimization Concepts
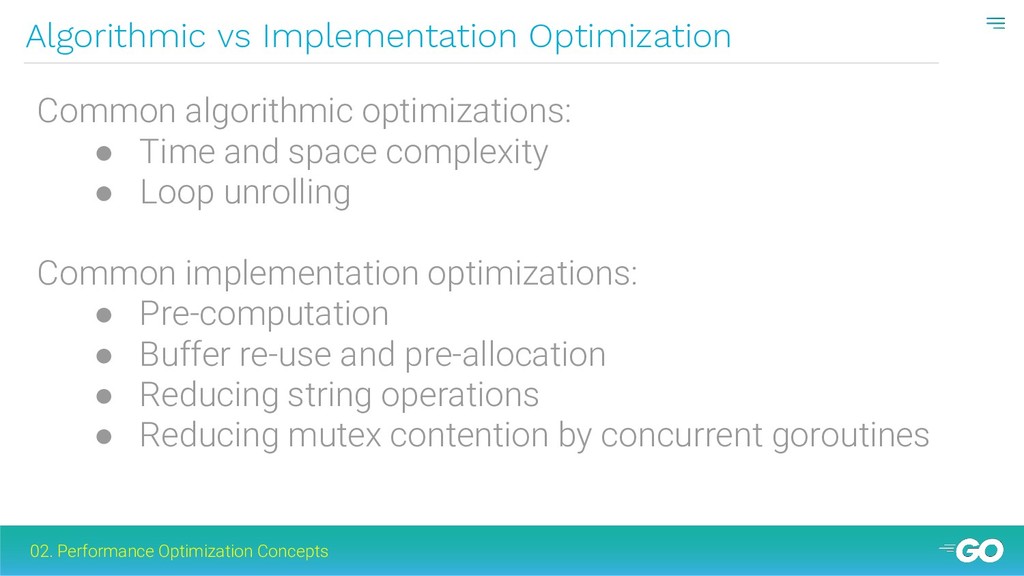
  8. Algorithmic vs Implementation Optimization 02. Performance Optimization Concepts Common algorithmic

    optimizations: • Time and space complexity • Loop unrolling Common implementation optimizations: • Pre-computation • Buffer re-use and pre-allocation • Reducing string operations • Reducing mutex contention by concurrent goroutines
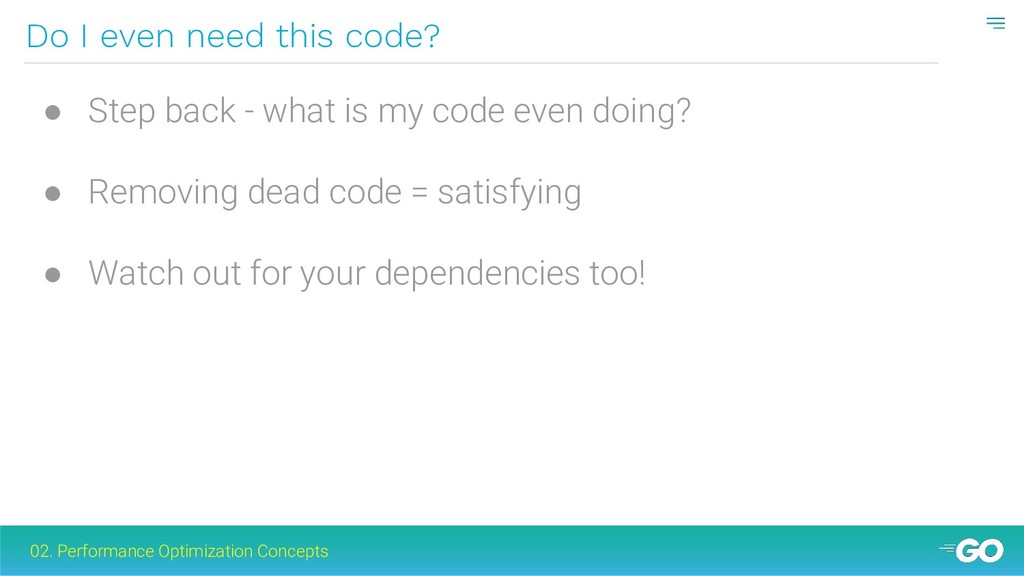
  9. Do I even need this code? 02. Performance Optimization Concepts

    • Step back - what is my code even doing? • Removing dead code = satisfying • Watch out for your dependencies too!
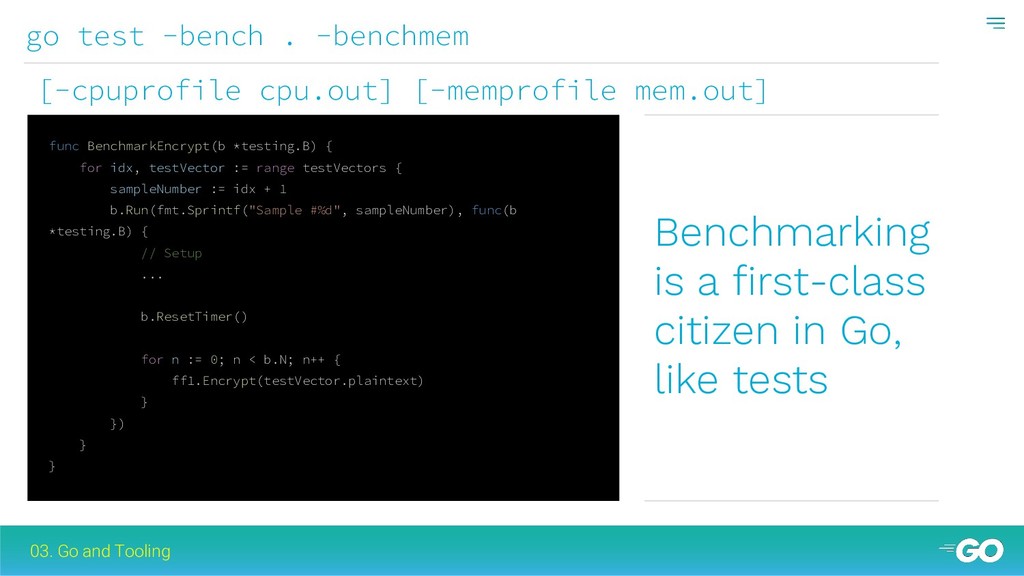
  10. go test -bench . -benchmem 03. Go and Tooling [-cpuprofile

    cpu.out] [-memprofile mem.out] func BenchmarkEncrypt(b *testing.B) { for idx, testVector := range testVectors { sampleNumber := idx + 1 b.Run(fmt.Sprintf("Sample #%d", sampleNumber), func(b *testing.B) { // Setup ... b.ResetTimer() for n := 0; n < b.N; n++ { ff1.Encrypt(testVector.plaintext) } }) } } Benchmarking is a first-class citizen in Go, like tests
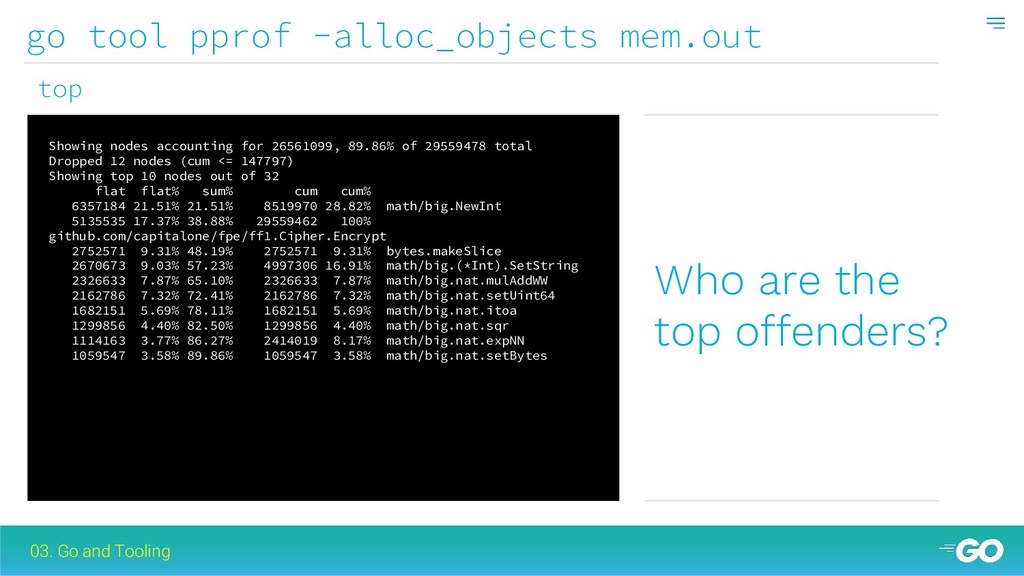
  11. go tool pprof -alloc_objects mem.out 03. Go and Tooling Showing

    nodes accounting for 26561099, 89.86% of 29559478 total Dropped 12 nodes (cum <= 147797) Showing top 10 nodes out of 32 flat flat% sum% cum cum% 6357184 21.51% 21.51% 8519970 28.82% math/big.NewInt 5135535 17.37% 38.88% 29559462 100% github.com/capitalone/fpe/ff1.Cipher.Encrypt 2752571 9.31% 48.19% 2752571 9.31% bytes.makeSlice 2670673 9.03% 57.23% 4997306 16.91% math/big.(*Int).SetString 2326633 7.87% 65.10% 2326633 7.87% math/big.nat.mulAddWW 2162786 7.32% 72.41% 2162786 7.32% math/big.nat.setUint64 1682151 5.69% 78.11% 1682151 5.69% math/big.nat.itoa 1299856 4.40% 82.50% 1299856 4.40% math/big.nat.sqr 1114163 3.77% 86.27% 2414019 8.17% math/big.nat.expNN 1059547 3.58% 89.86% 1059547 3.58% math/big.nat.setBytes top Who are the top offenders?

  12. go tool pprof -alloc_objects mem.out 03. Go and Tooling .

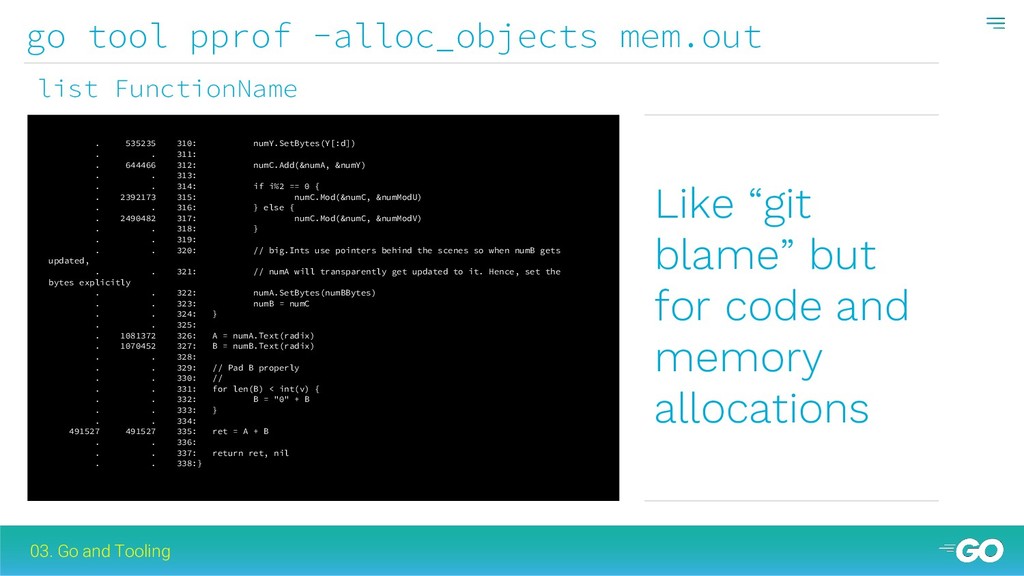
    535235 310: numY.SetBytes(Y[:d]) . . 311: . 644466 312: numC.Add(&numA, &numY) . . 313: . . 314: if i%2 == 0 { . 2392173 315: numC.Mod(&numC, &numModU) . . 316: } else { . 2490482 317: numC.Mod(&numC, &numModV) . . 318: } . . 319: . . 320: // big.Ints use pointers behind the scenes so when numB gets updated, . . 321: // numA will transparently get updated to it. Hence, set the bytes explicitly . . 322: numA.SetBytes(numBBytes) . . 323: numB = numC . . 324: } . . 325: . 1081372 326: A = numA.Text(radix) . 1070452 327: B = numB.Text(radix) . . 328: . . 329: // Pad B properly . . 330: // . . 331: for len(B) < int(v) { . . 332: B = "0" + B . . 333: } . . 334: 491527 491527 335: ret = A + B . . 336: . . 337: return ret, nil . . 338:} list FunctionName Like “git blame” but for code and memory allocations
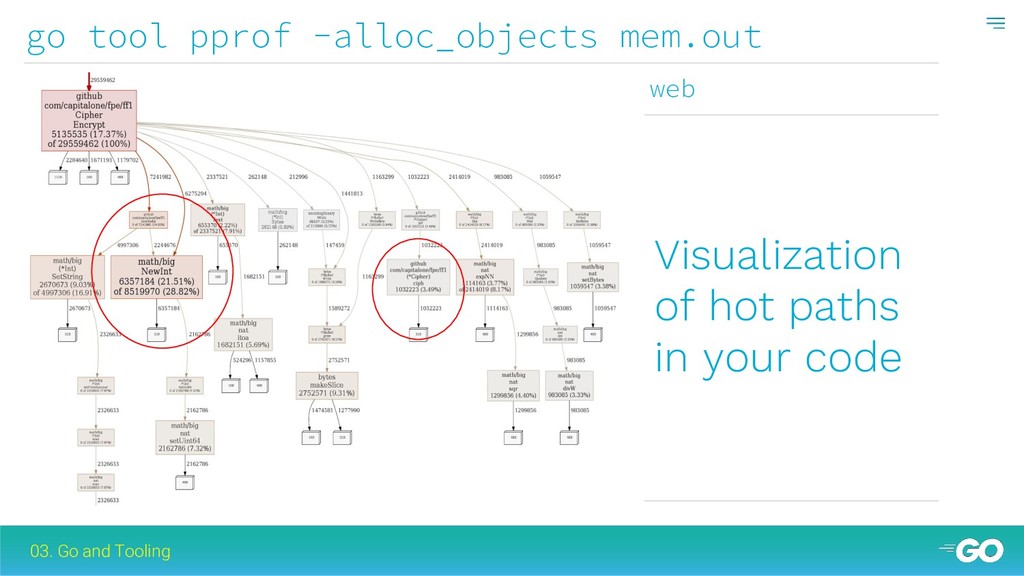
  13. go tool pprof -alloc_objects mem.out 03. Go and Tooling web

    Visualization of hot paths in your code
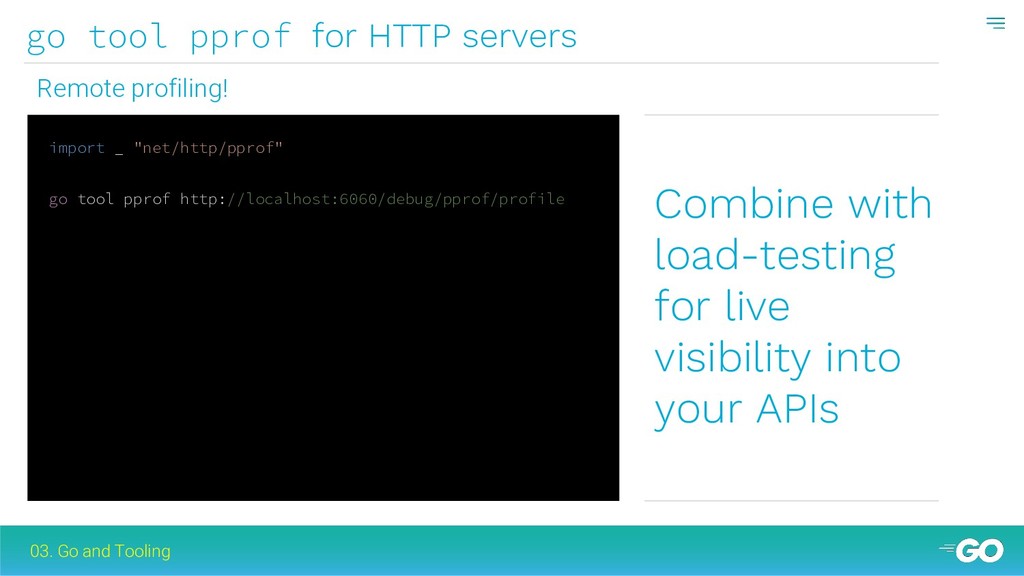
  14. go tool pprof for HTTP servers 03. Go and Tooling

    import _ "net/http/pprof" go tool pprof http://localhost:6060/debug/pprof/profile Remote profiling! Combine with load-testing for live visibility into your APIs
  15. Tracing with go tool trace 03. Go and Tooling •

    Useful for troubleshooting network or disk latency • Goroutines can be put to sleep when waiting for I/O - use tracing • Go 1.11 has awesome new functionality for this
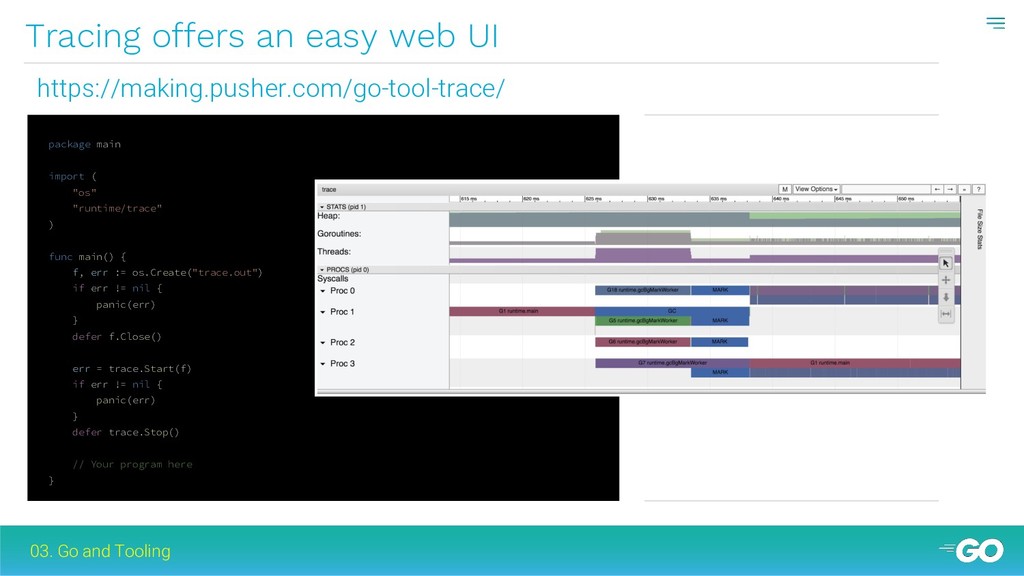
  16. Tracing offers an easy web UI 03. Go and Tooling

    https://making.pusher.com/go-tool-trace/ package main import ( "os" "runtime/trace" ) func main() { f, err := os.Create("trace.out") if err != nil { panic(err) } defer f.Close() err = trace.Start(f) if err != nil { panic(err) } defer trace.Stop() // Your program here }
  17. Utilities 03. Go and Tooling benchcmp: compare two Go benchmark

    outputs benchstat: compute statistics on Go benchmark outputs hey, wrk, etc : generate traffic against HTTP servers and display some stats/metrics
  18. Go 1.10 added strings.Builder 03. Go and Tooling • Like

    bytes.Buffer but for strings • Great if you’re repeatedly creating lots and lots of strings • Uses unsafe pointers - be careful!
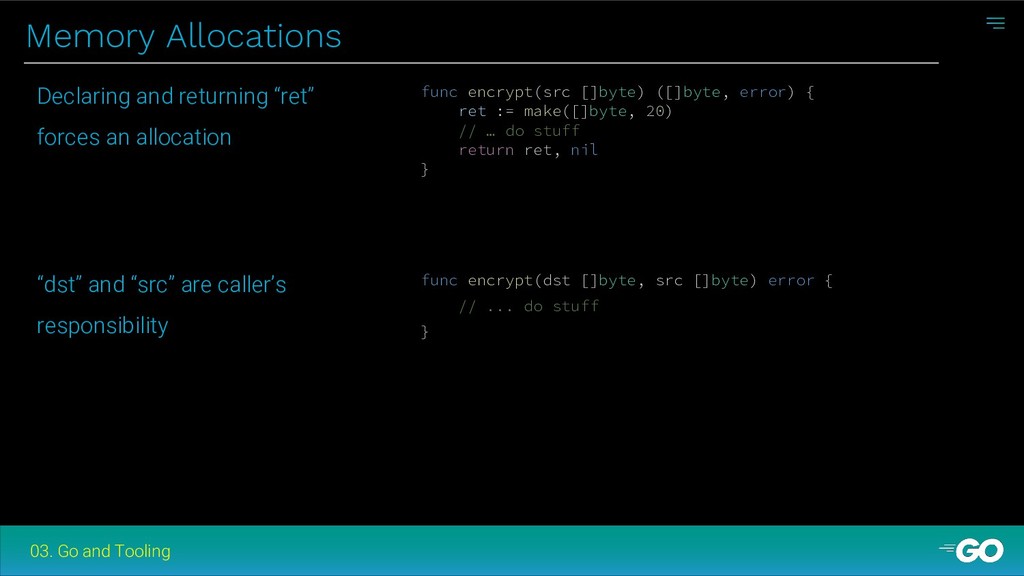
  19. Memory Allocations 03. Go and Tooling func encrypt(src []byte) ([]byte,

    error) { ret := make([]byte, 20) // … do stuff return ret, nil } Declaring and returning “ret” forces an allocation func encrypt(dst []byte, src []byte) error { // ... do stuff } “dst” and “src” are caller’s responsibility
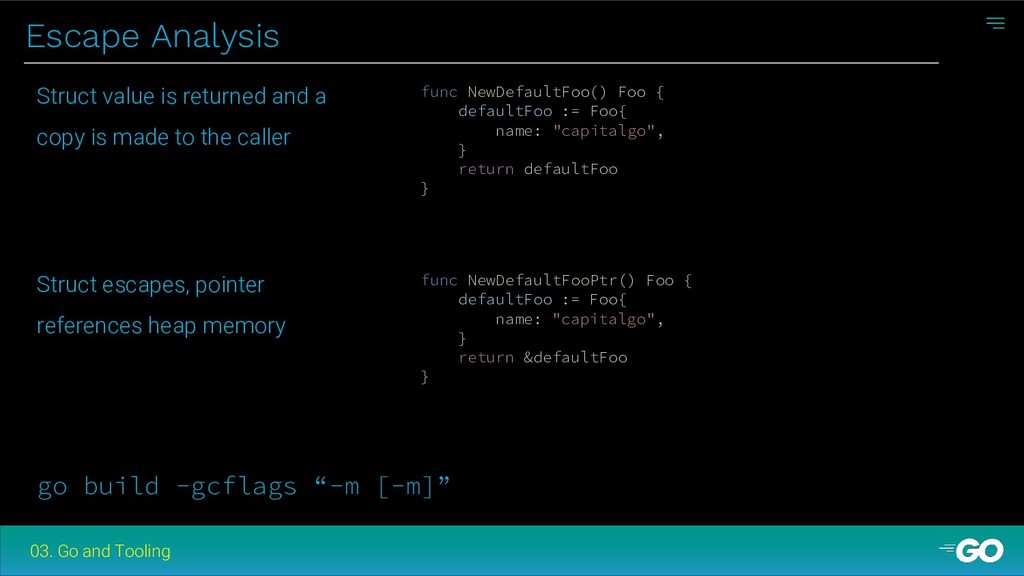
  20. Escape Analysis 03. Go and Tooling func NewDefaultFoo() Foo {

    defaultFoo := Foo{ name: "capitalgo", } return defaultFoo } Struct value is returned and a copy is made to the caller go build -gcflags “-m [-m]” func NewDefaultFooPtr() Foo { defaultFoo := Foo{ name: "capitalgo", } return &defaultFoo } Struct escapes, pointer references heap memory
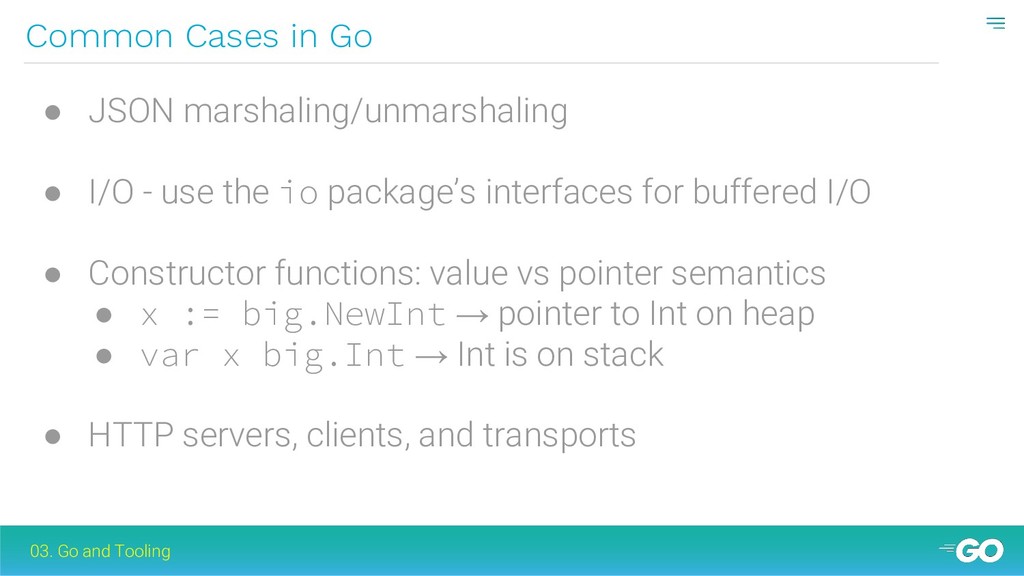
  21. Common Cases in Go 03. Go and Tooling • JSON

    marshaling/unmarshaling • I/O - use the io package’s interfaces for buffered I/O • Constructor functions: value vs pointer semantics • x := big.NewInt → pointer to Int on heap • var x big.Int → Int is on stack • HTTP servers, clients, and transports
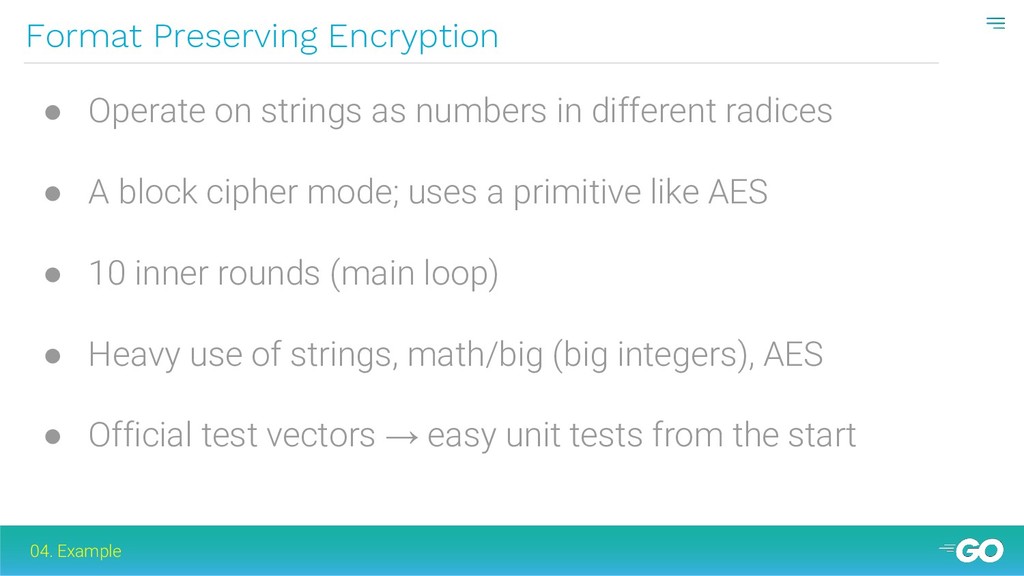
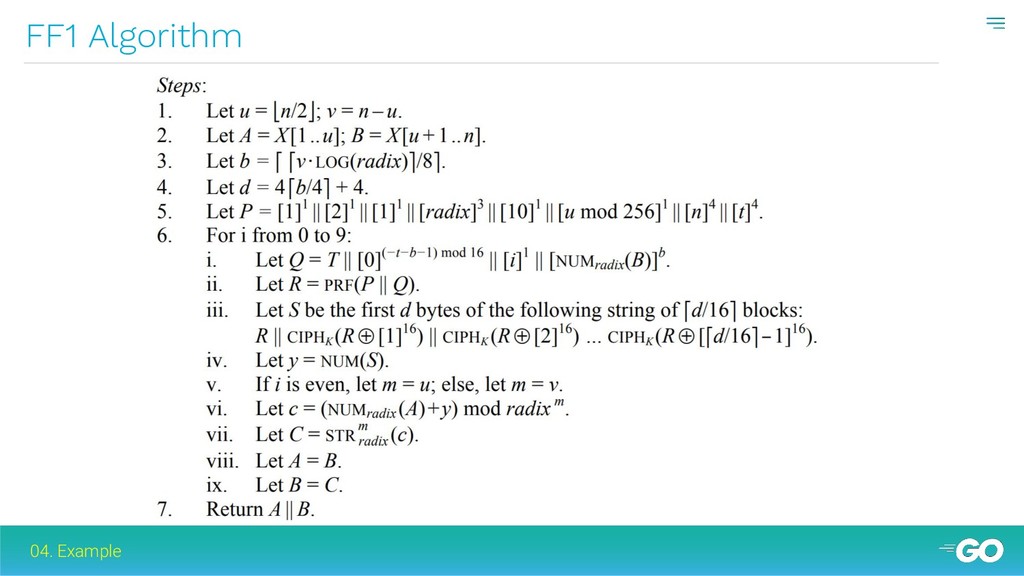
  22. Format Preserving Encryption 04. Example • Operate on strings as

    numbers in different radices • A block cipher mode; uses a primitive like AES • 10 inner rounds (main loop) • Heavy use of strings, math/big (big integers), AES • Official test vectors → easy unit tests from the start
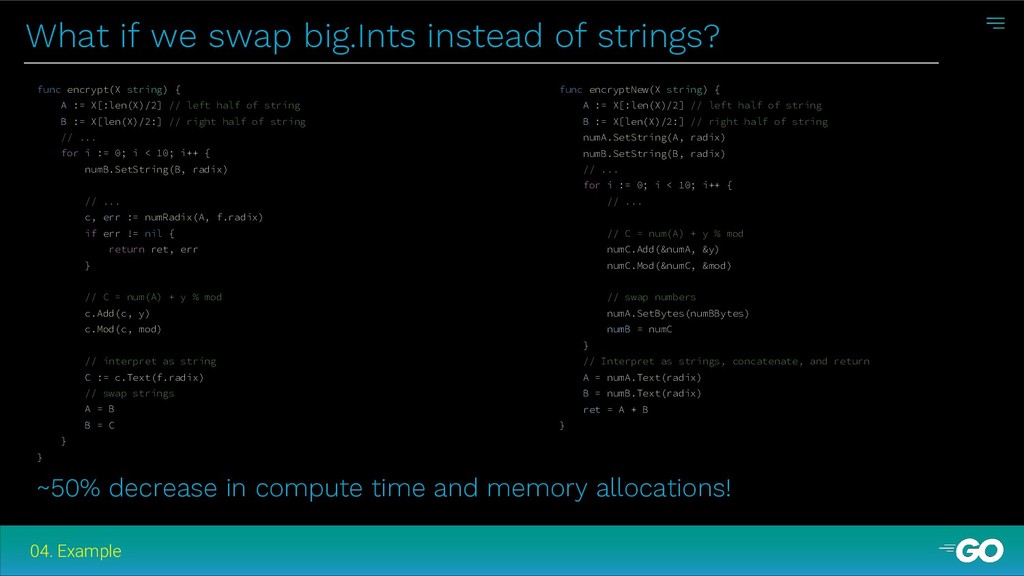
  23. What if we swap big.Ints instead of strings? 04. Example

    func encrypt(X string) { A := X[:len(X)/2] // left half of string B := X[len(X)/2:] // right half of string // ... for i := 0; i < 10; i++ { numB.SetString(B, radix) // ... c, err := numRadix(A, f.radix) if err != nil { return ret, err } // C = num(A) + y % mod c.Add(c, y) c.Mod(c, mod) // interpret as string C := c.Text(f.radix) // swap strings A = B B = C } } ~50% decrease in compute time and memory allocations! func encryptNew(X string) { A := X[:len(X)/2] // left half of string B := X[len(X)/2:] // right half of string numA.SetString(A, radix) numB.SetString(B, radix) // ... for i := 0; i < 10; i++ { // ... // C = num(A) + y % mod numC.Add(&numA, &y) numC.Mod(&numC, &mod) // swap numbers numA.SetBytes(numBBytes) numB = numC } // Interpret as strings, concatenate, and return A = numA.Text(radix) B = numB.Text(radix) ret = A + B }
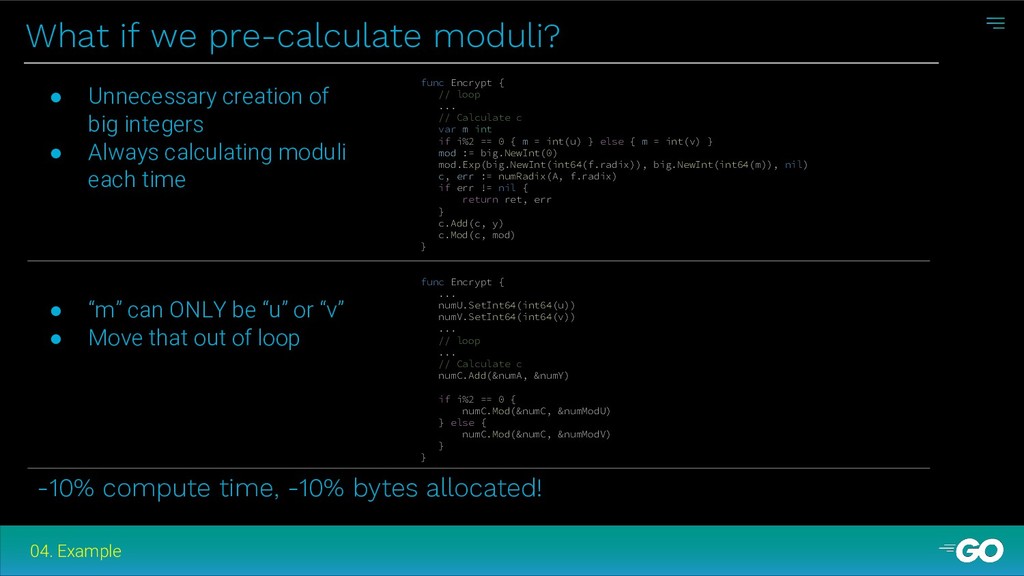
  24. What if we pre-calculate moduli? 04. Example • Unnecessary creation

    of big integers • Always calculating moduli each time func Encrypt { // loop ... // Calculate c var m int if i%2 == 0 { m = int(u) } else { m = int(v) } mod := big.NewInt(0) mod.Exp(big.NewInt(int64(f.radix)), big.NewInt(int64(m)), nil) c, err := numRadix(A, f.radix) if err != nil { return ret, err } c.Add(c, y) c.Mod(c, mod) } -10% compute time, -10% bytes allocated! func Encrypt { ... numU.SetInt64(int64(u)) numV.SetInt64(int64(v)) ... // loop ... // Calculate c numC.Add(&numA, &numY) if i%2 == 0 { numC.Mod(&numC, &numModU) } else { numC.Mod(&numC, &numModV) } } • “m” can ONLY be “u” or “v” • Move that out of loop
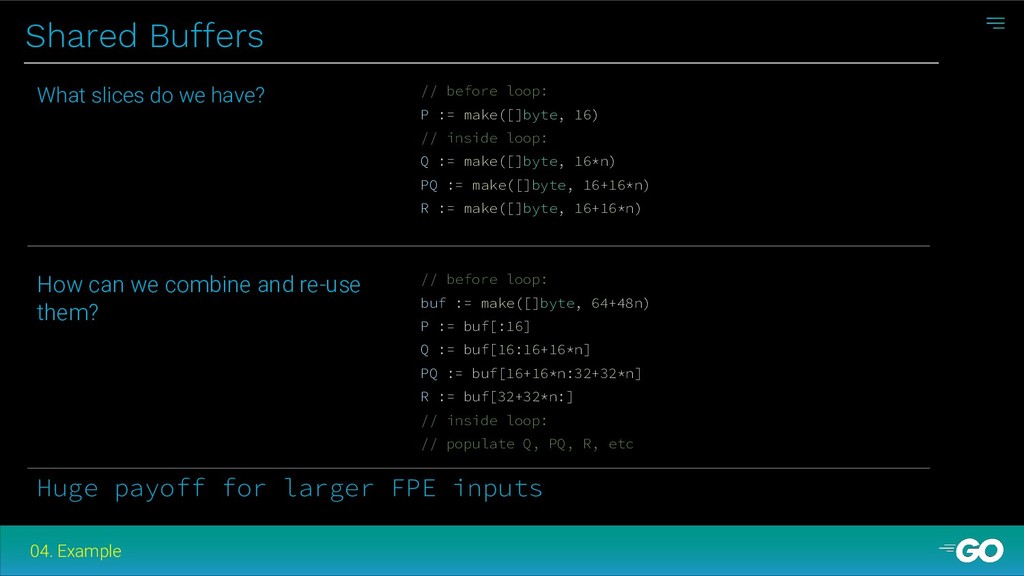
  25. Shared Buffers 04. Example // before loop: P := make([]byte,

    16) // inside loop: Q := make([]byte, 16*n) PQ := make([]byte, 16+16*n) R := make([]byte, 16+16*n) What slices do we have? Huge payoff for larger FPE inputs // before loop: buf := make([]byte, 64+48n) P := buf[:16] Q := buf[16:16+16*n] PQ := buf[16+16*n:32+32*n] R := buf[32+32*n:] // inside loop: // populate Q, PQ, R, etc How can we combine and re-use them?
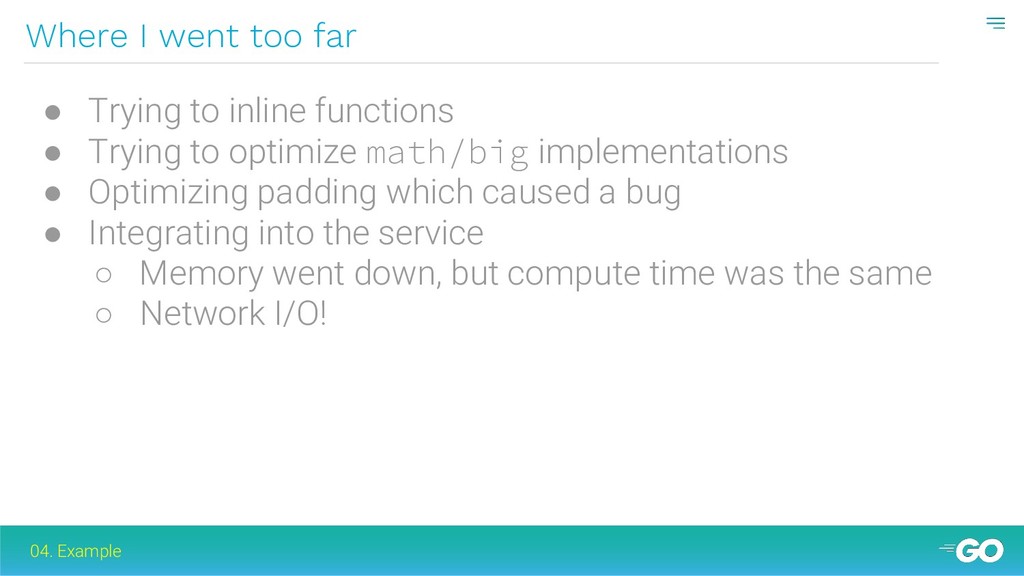
  26. Where I went too far 04. Example • Trying to

    inline functions • Trying to optimize math/big implementations • Optimizing padding which caused a bug • Integrating into the service ◦ Memory went down, but compute time was the same ◦ Network I/O!
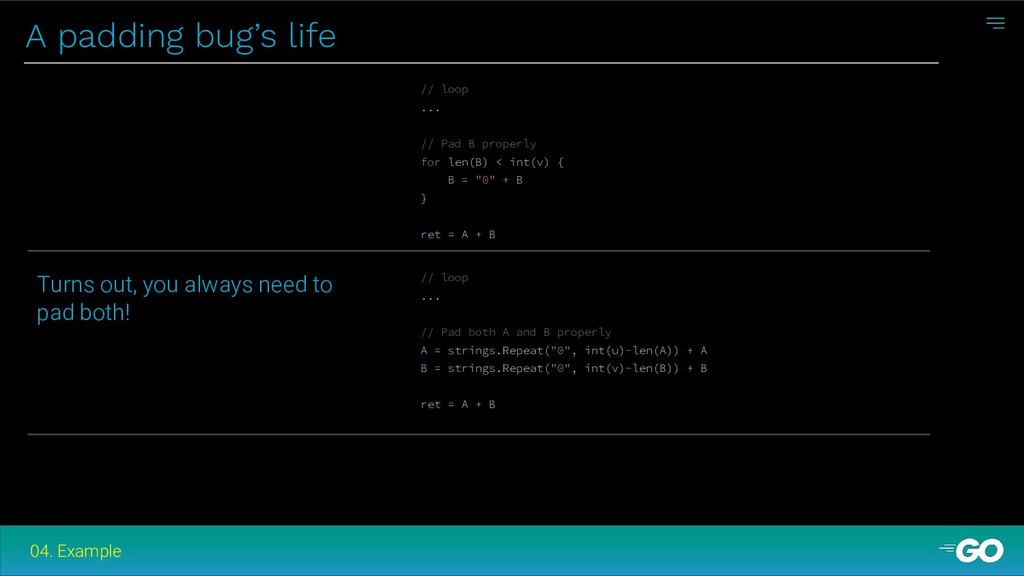
  27. A padding bug’s life 04. Example // loop ... //

    Pad B properly for len(B) < int(v) { B = "0" + B } ret = A + B // loop ... // Pad both A and B properly A = strings.Repeat("0", int(u)-len(A)) + A B = strings.Repeat("0", int(v)-len(B)) + B ret = A + B Turns out, you always need to pad both!
  28. Where I went too far 04. Example • Trying to

    inline functions • Trying to optimize math/big implementations • Optimizing padding which caused a bug • Integrating into the service ◦ Memory went down, but compute time was the same ◦ Network I/O!
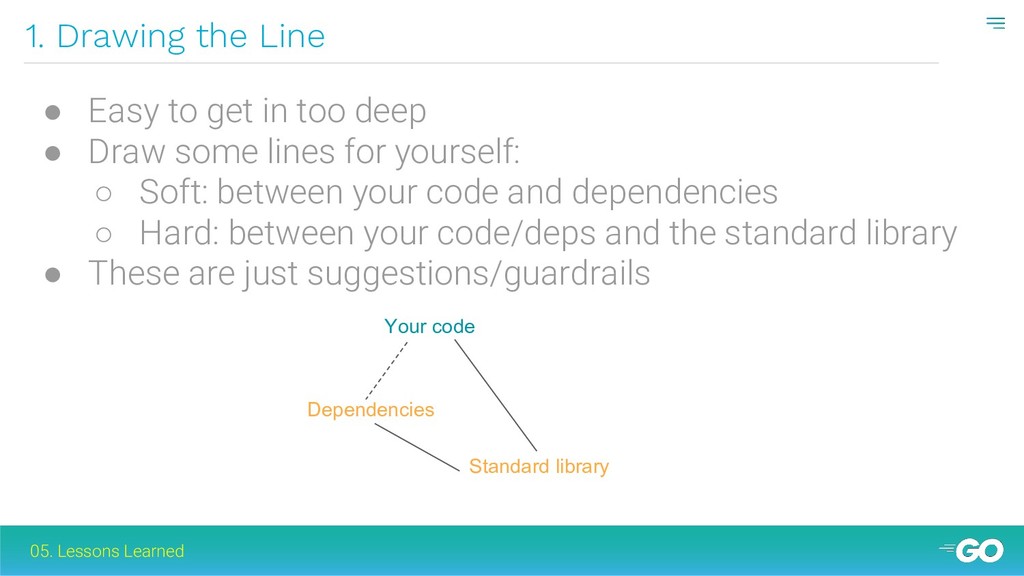
  29. 1. Drawing the Line 05. Lessons Learned • Easy to

    get in too deep • Draw some lines for yourself: ◦ Soft: between your code and dependencies ◦ Hard: between your code/deps and the standard library • These are just suggestions/guardrails Your code Dependencies Standard library
  30. 2. An opportunity to contribute 05. Lessons Learned • Contribute

    to the community - others will appreciate it too! ◦ Make your change ◦ Test + benchmark it (add benchmarks if necessary) ◦ See how your integration compares • Let the numbers do the talking
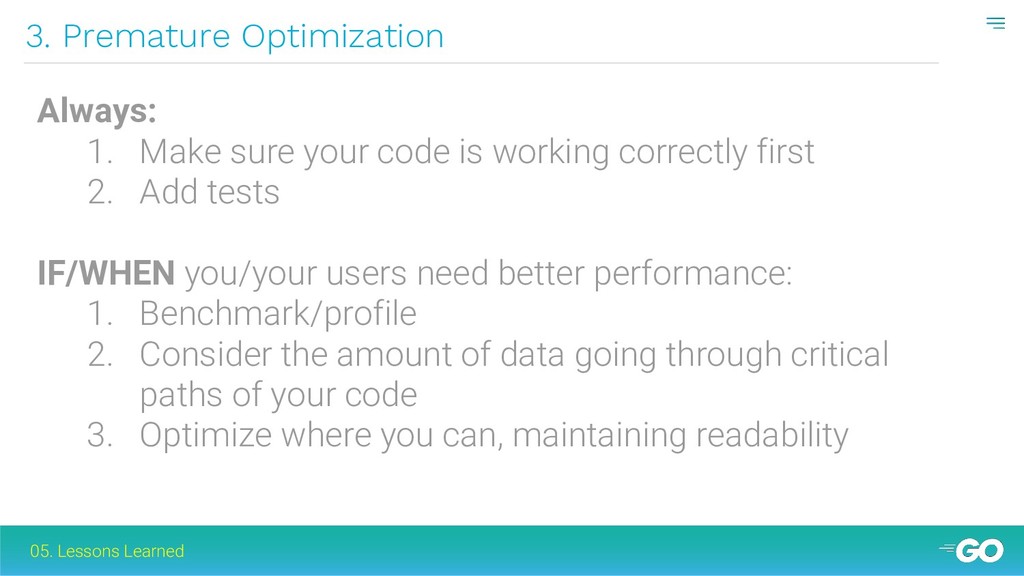
  31. 3. Premature Optimization 05. Lessons Learned Always: 1. Make sure

    your code is working correctly first 2. Add tests IF/WHEN you/your users need better performance: 1. Benchmark/profile 2. Consider the amount of data going through critical paths of your code 3. Optimize where you can, maintaining readability
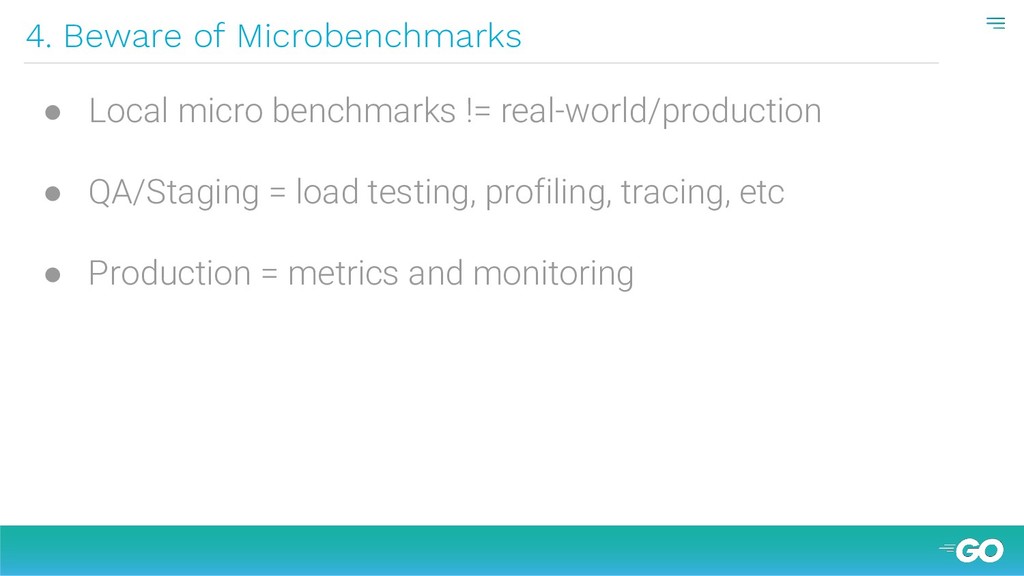
  32. 4. Beware of Microbenchmarks • Local micro benchmarks != real-world/production

    • QA/Staging = load testing, profiling, tracing, etc • Production = metrics and monitoring
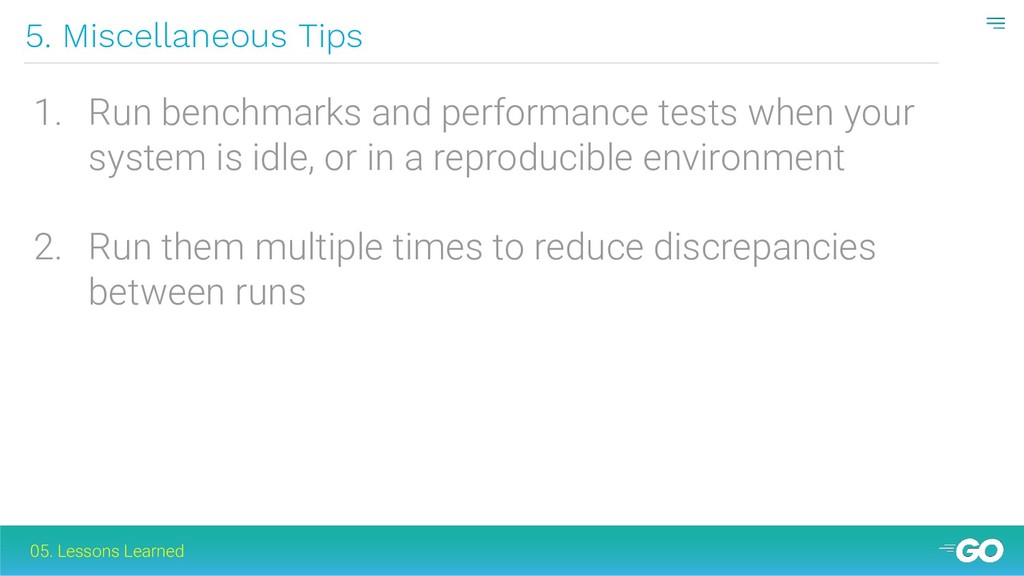
  33. 5. Miscellaneous Tips 05. Lessons Learned 1. Run benchmarks and

    performance tests when your system is idle, or in a reproducible environment 2. Run them multiple times to reduce discrepancies between runs
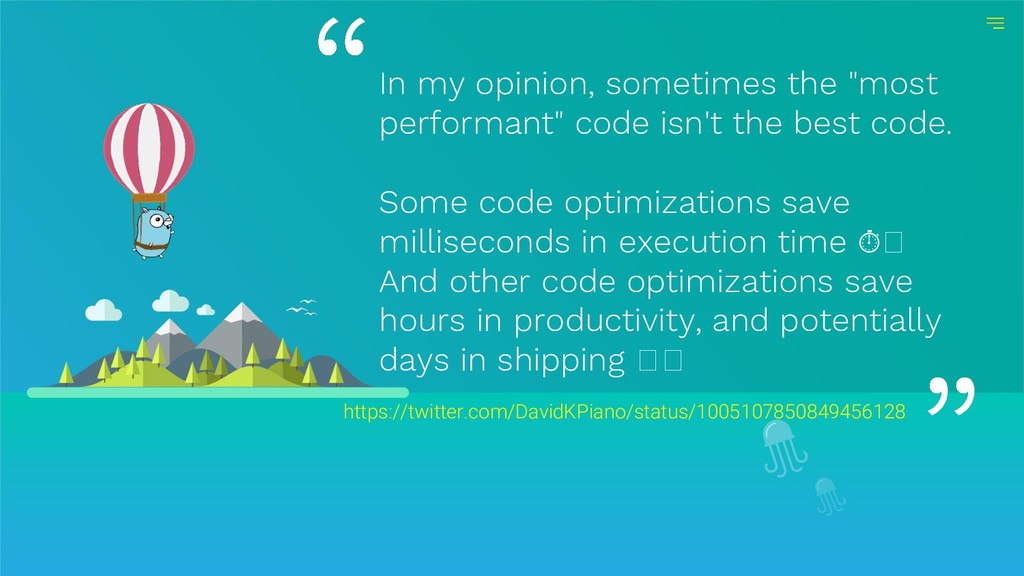
  34. https://twitter.com/DavidKPiano/status/1005107850849456128 In my opinion, sometimes the "most performant" code isn't

    the best code. Some code optimizations save milliseconds in execution time ⏱ And other code optimizations save hours in productivity, and potentially days in shipping
  35. 01 What you save in compute time, you spend in

    productivity. 05. Lessons Learned 05