$30 off During Our Annual Pro Sale. View Details »

Camera-First Form Filling: Reducing the Friction in Climate Hazard Reporting

Camera-First Form Filling: Reducing the Friction in Climate Hazard Reporting

Presented at HILDA 2023
Full paper at : https://arnab.org/files/hilda-2023-camera-first-form-filling-climate-hazard-reporting.pdf

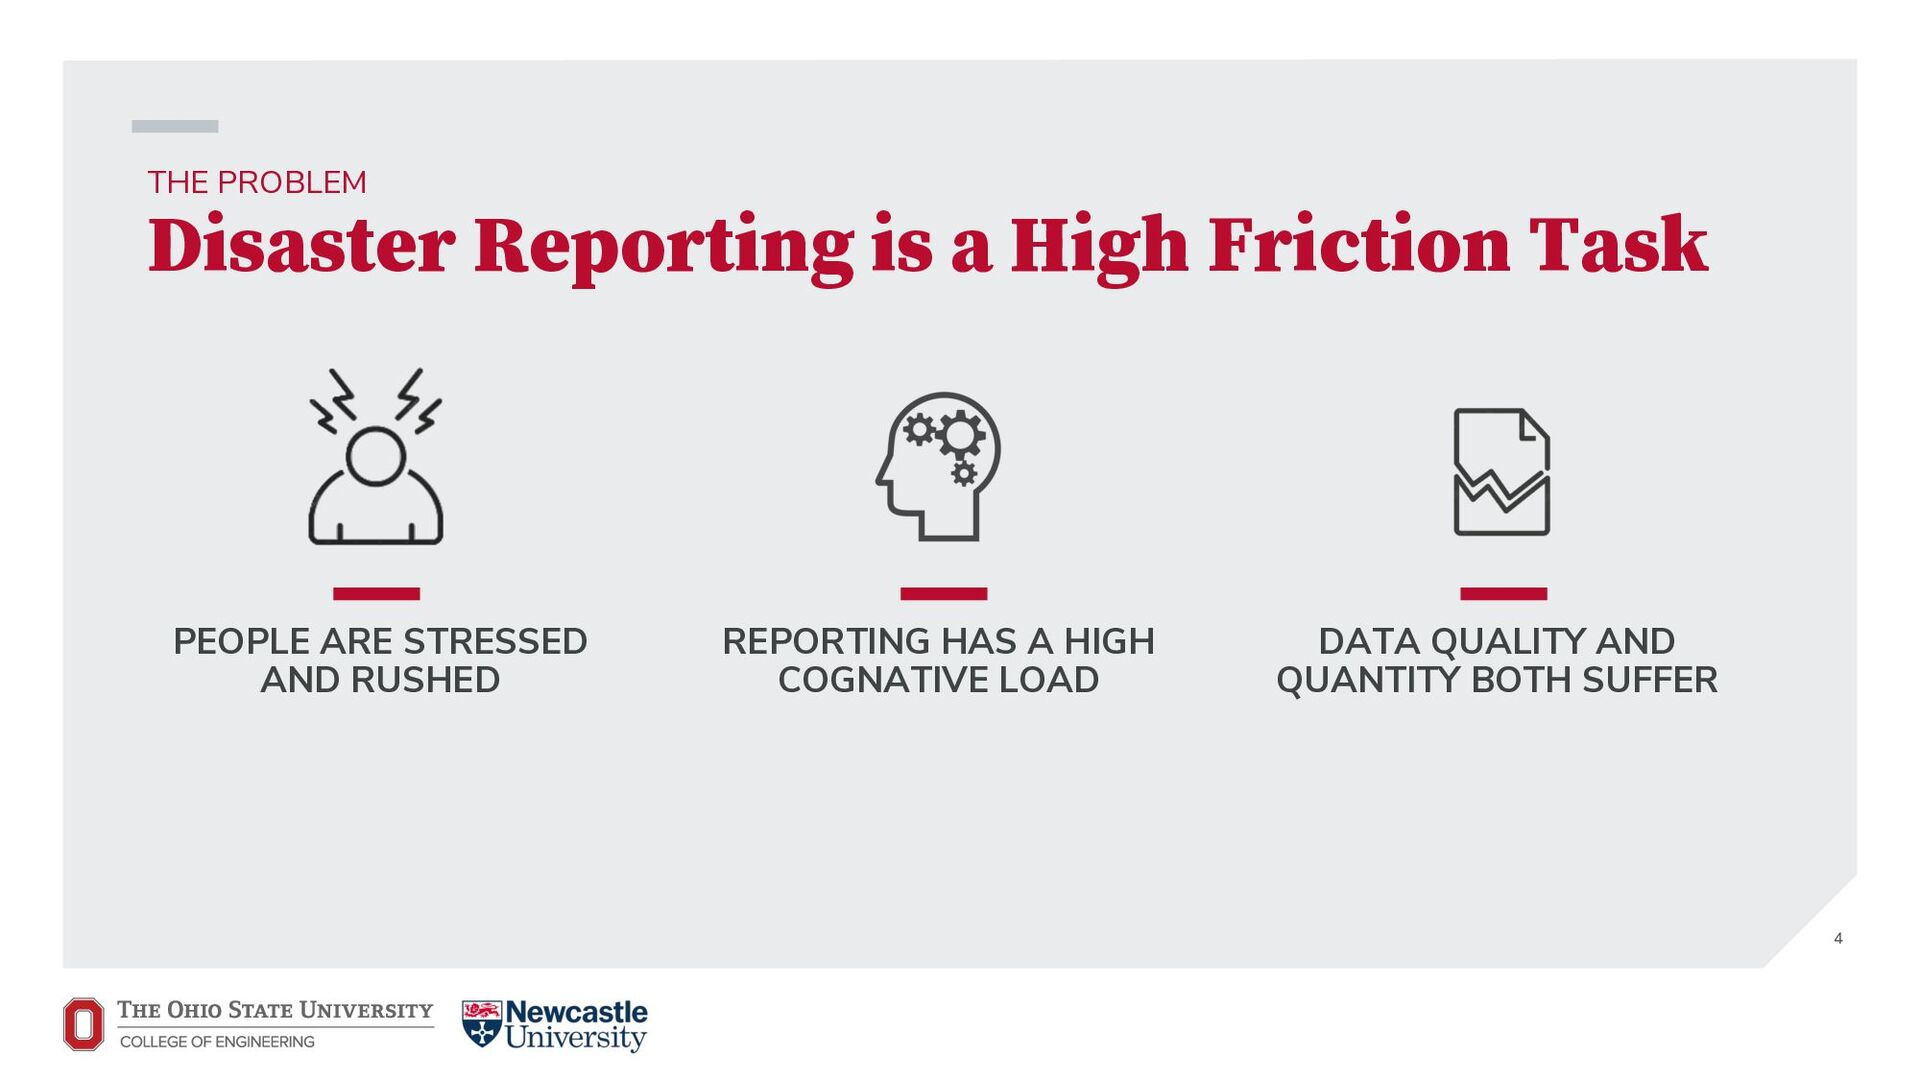
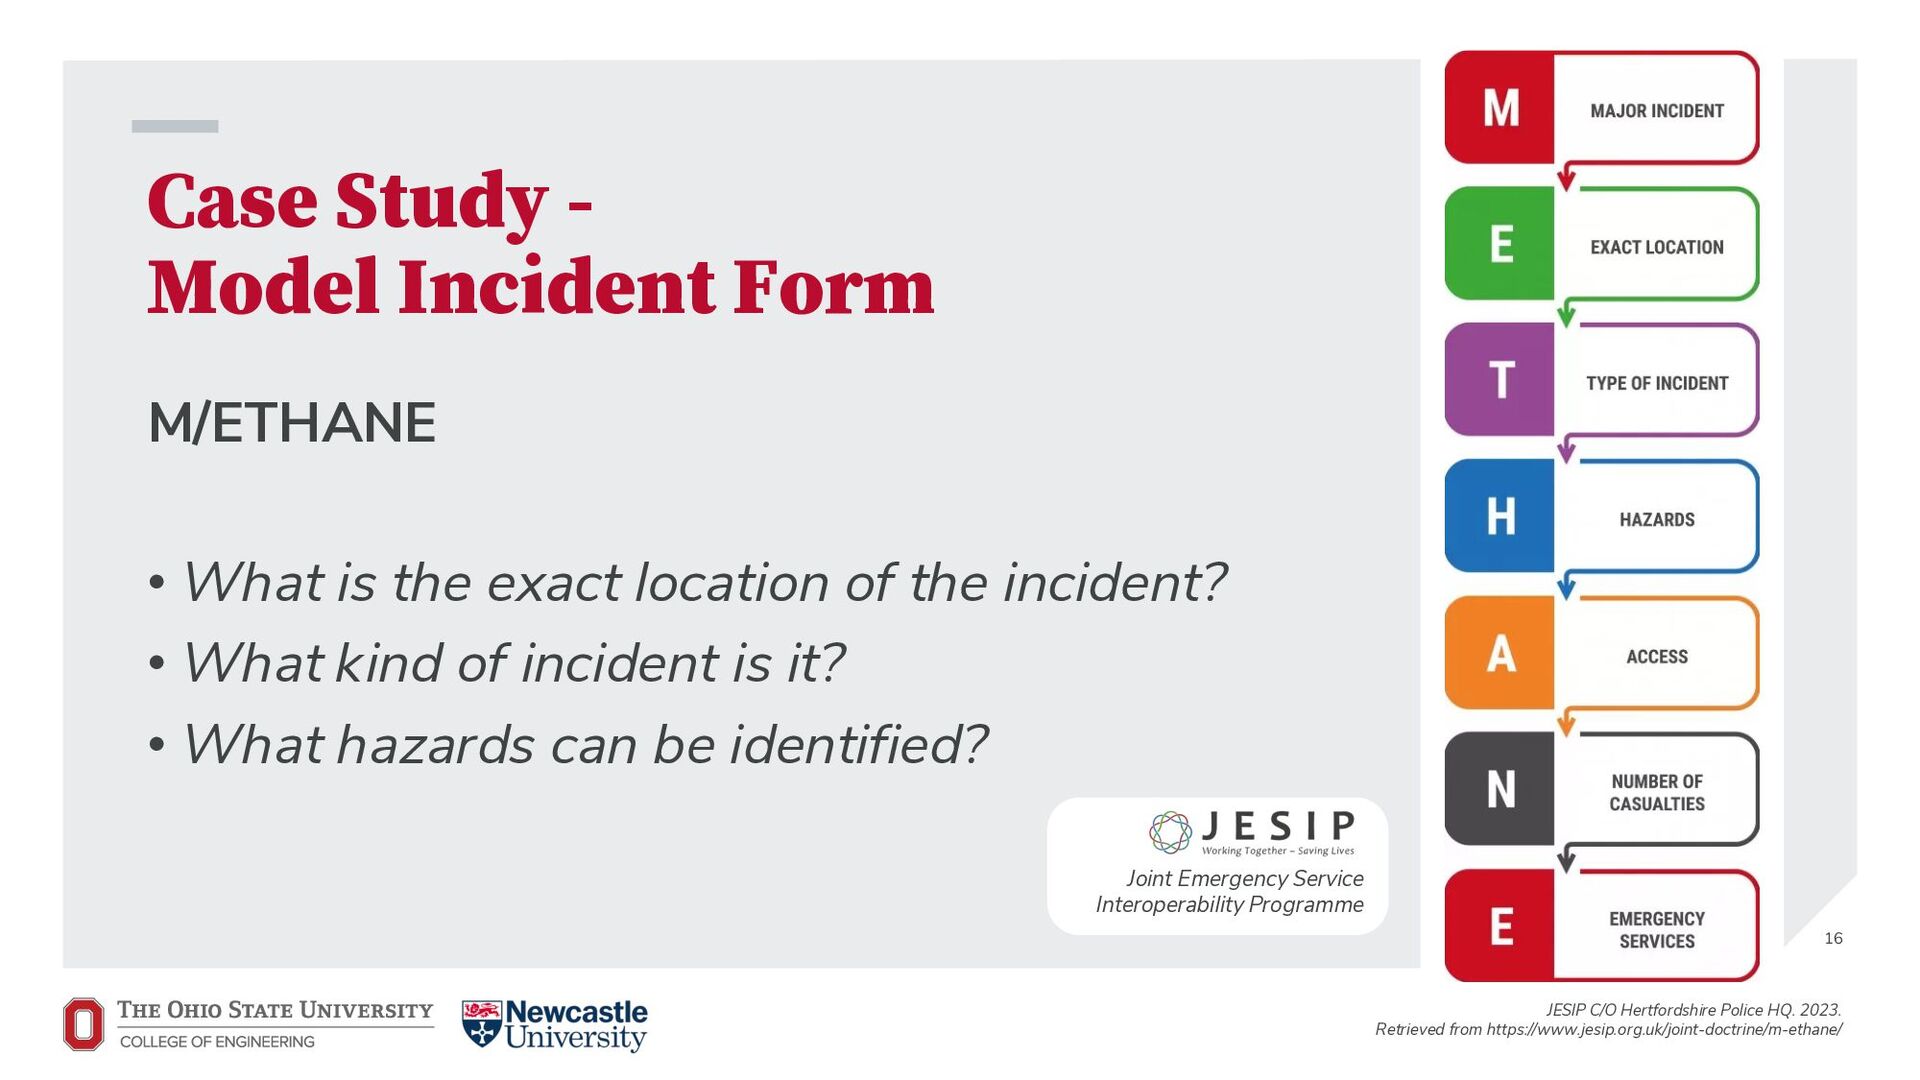
The effective reporting of climate hazards, such as flash floods, hurricanes, and earthquakes, is critical. To quickly and correctly assess the situation and deploy resou rces, emergency services often rely on citizen reports that must be timely, comprehensive, and accurate.
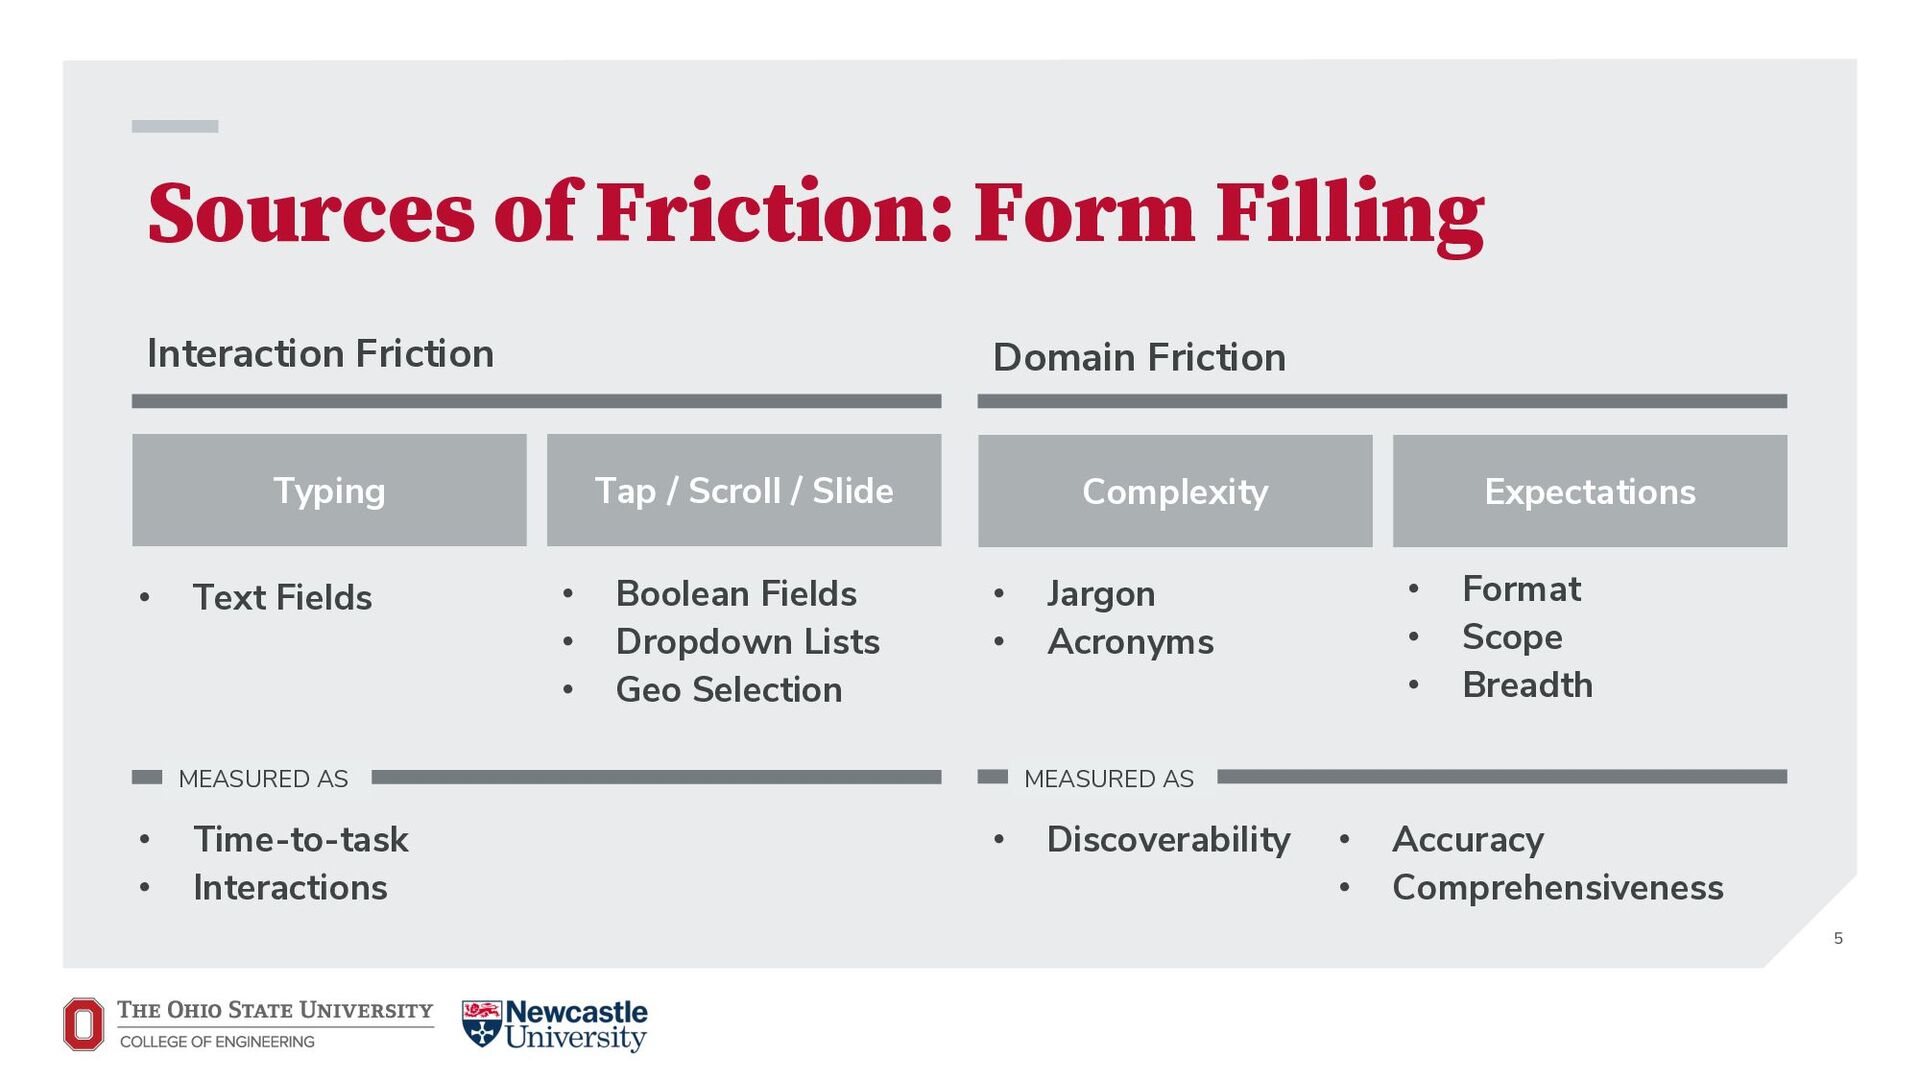
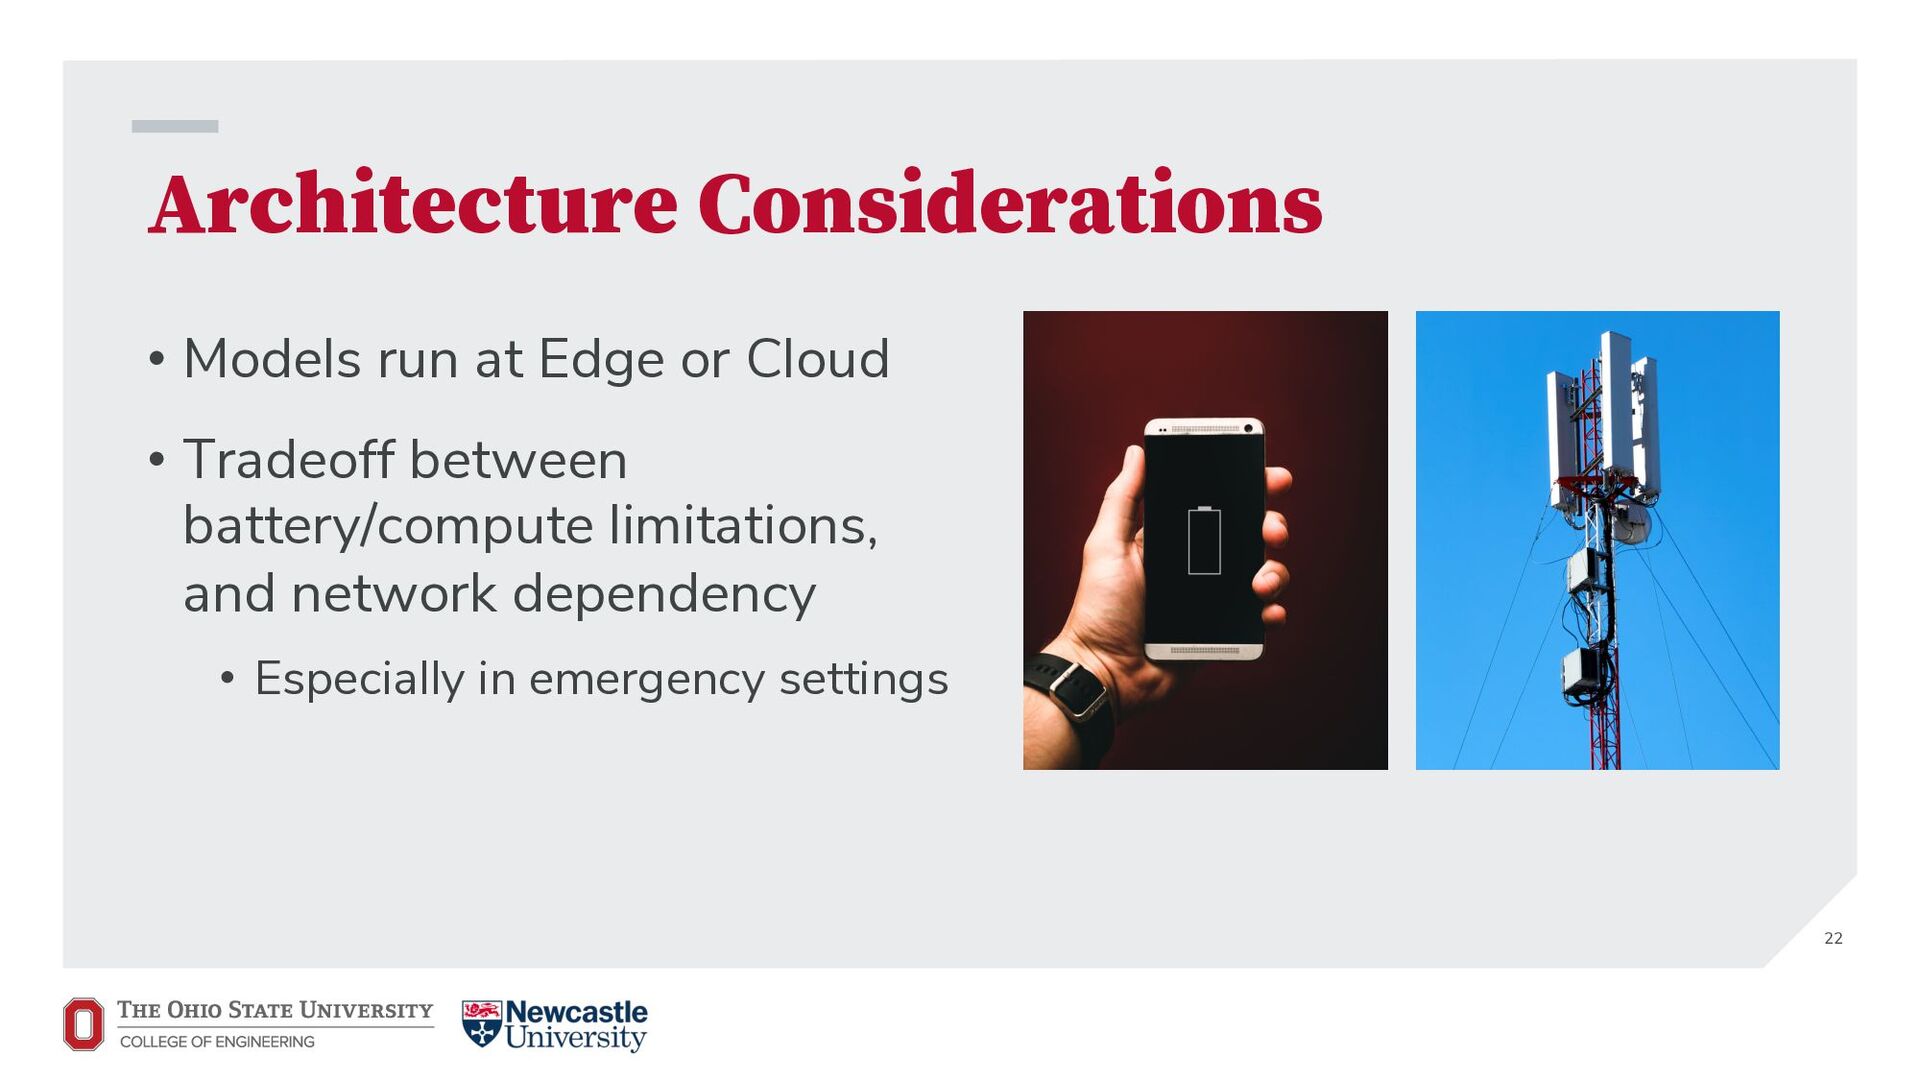
The pervasive availability and use of smartphone cameras allow the transmission of dynamic incident information from citizens in near-real-time. While high-quality reporting is beneficial, generating such reports can place an additional burden on citizens who are already suffering from the stress of a climate-related disaster. Furthermore, reporting methods are often challenging to use, due to their length and complexity.
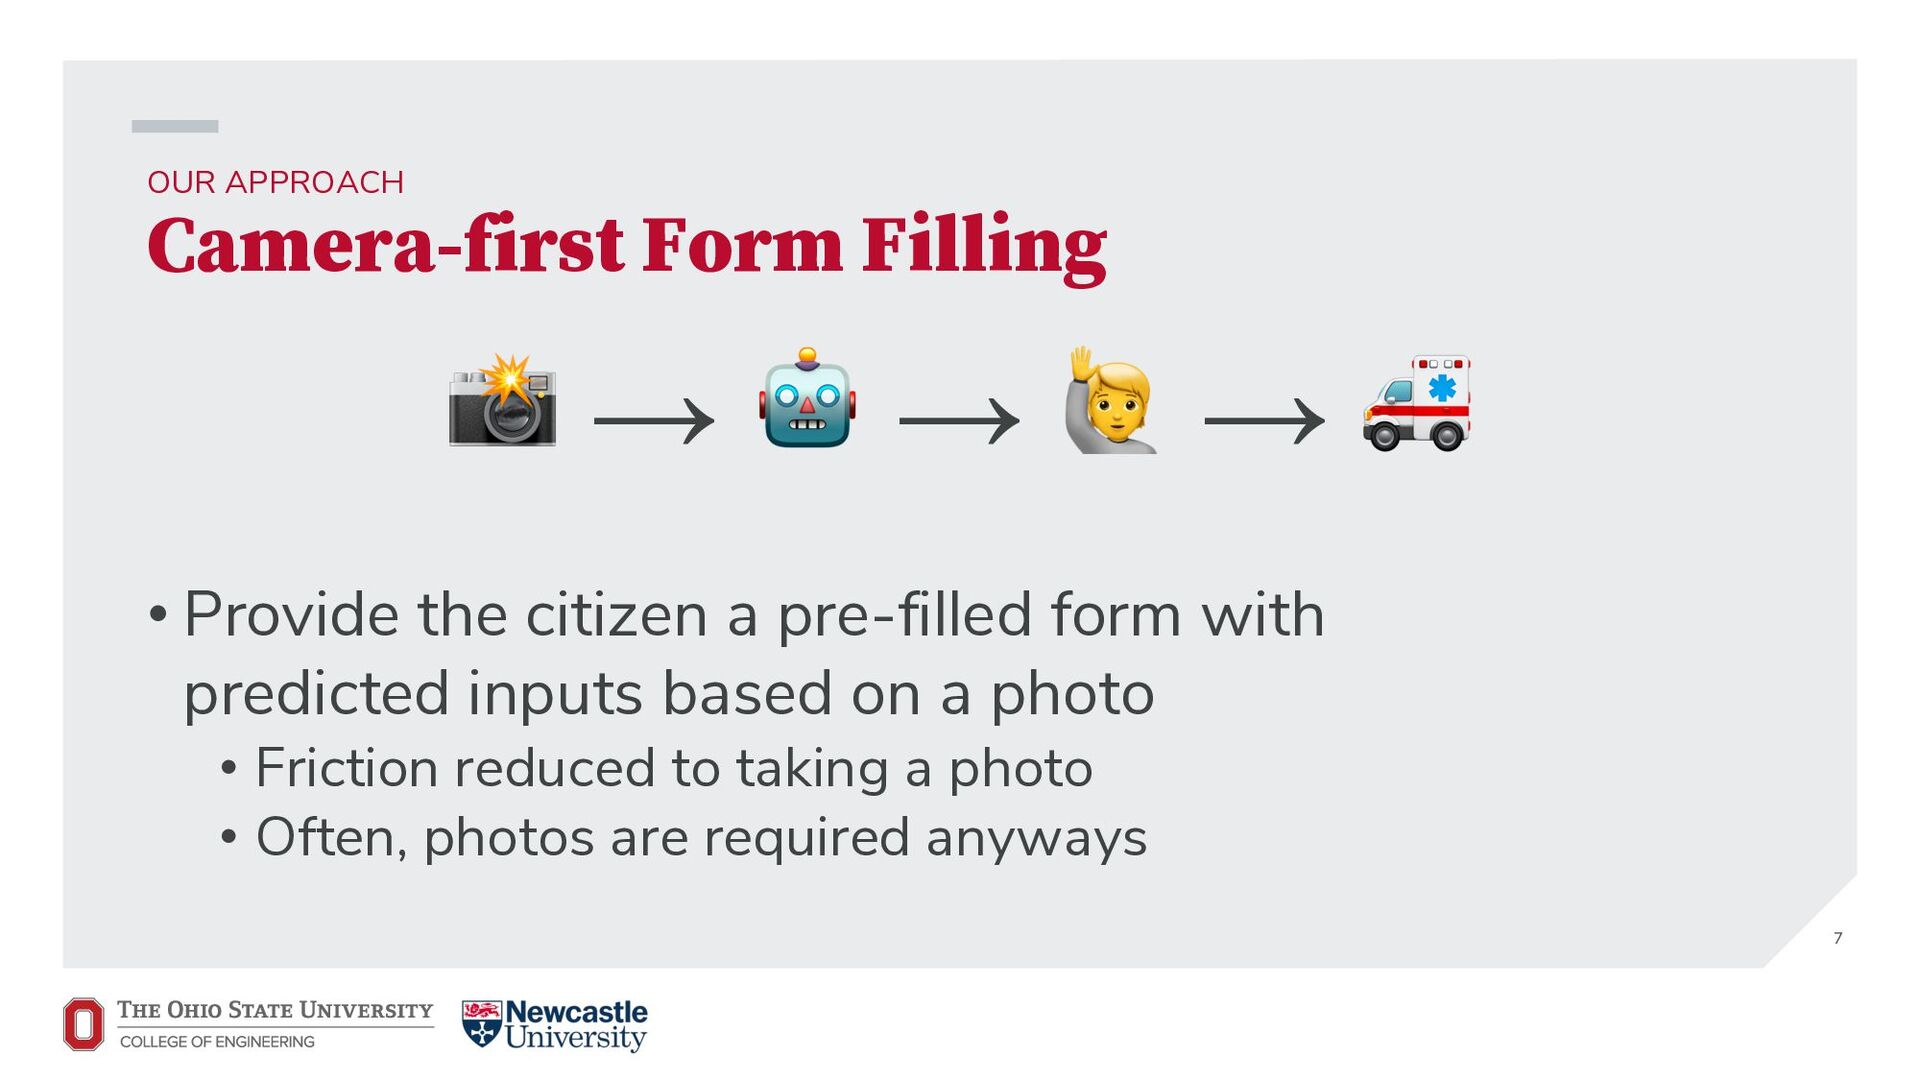
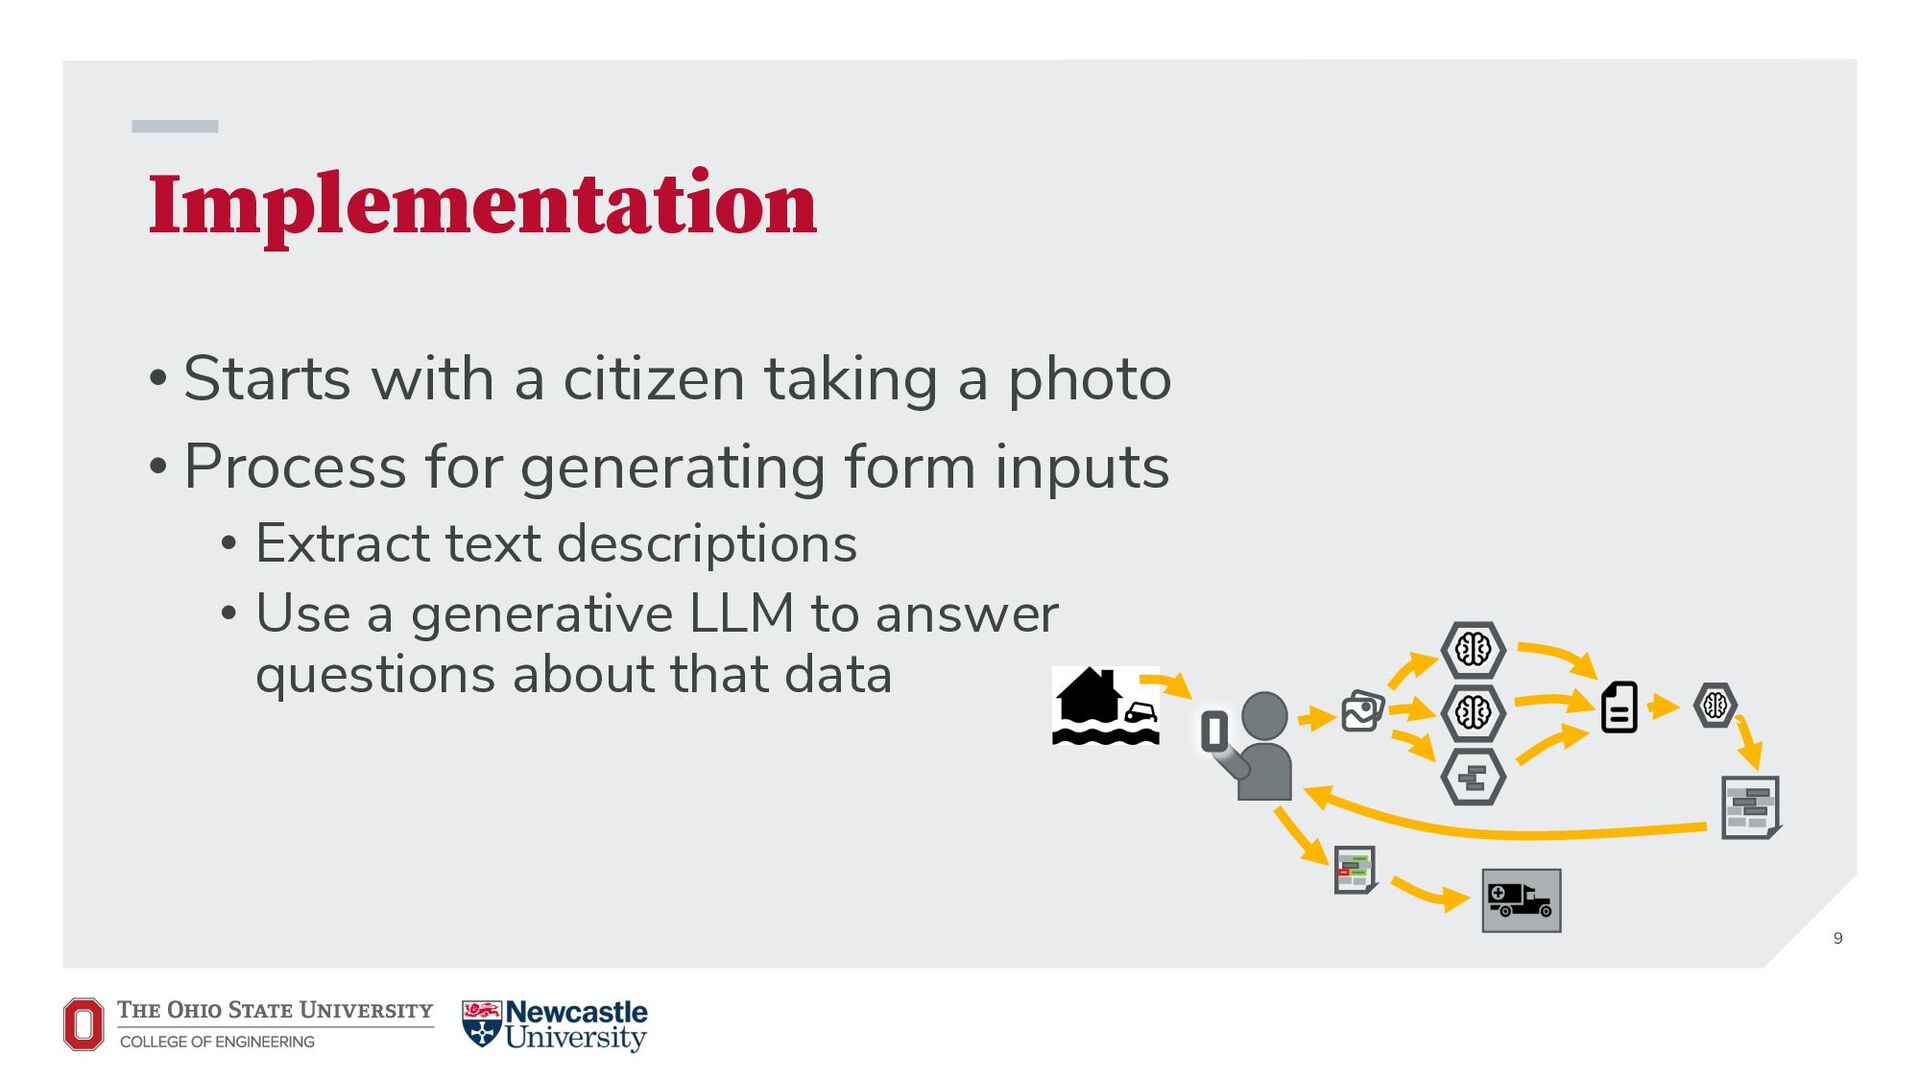
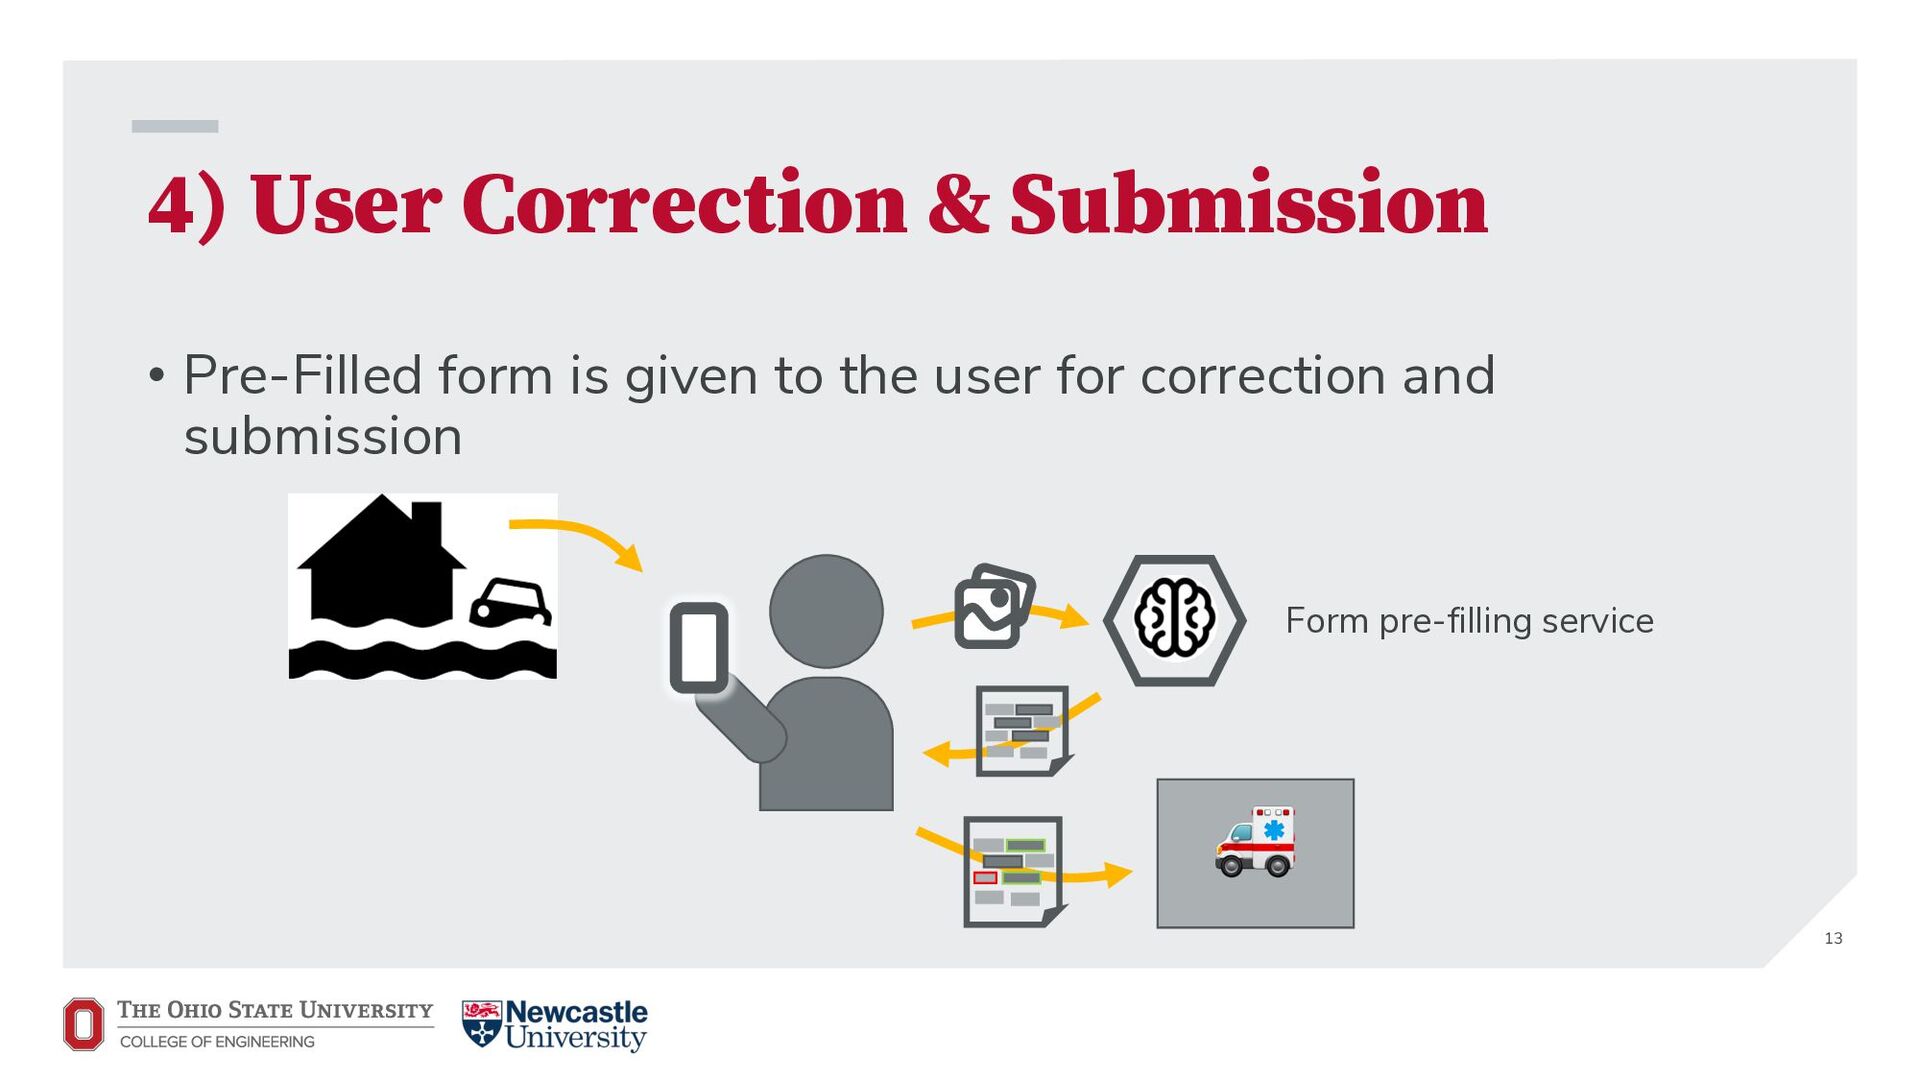
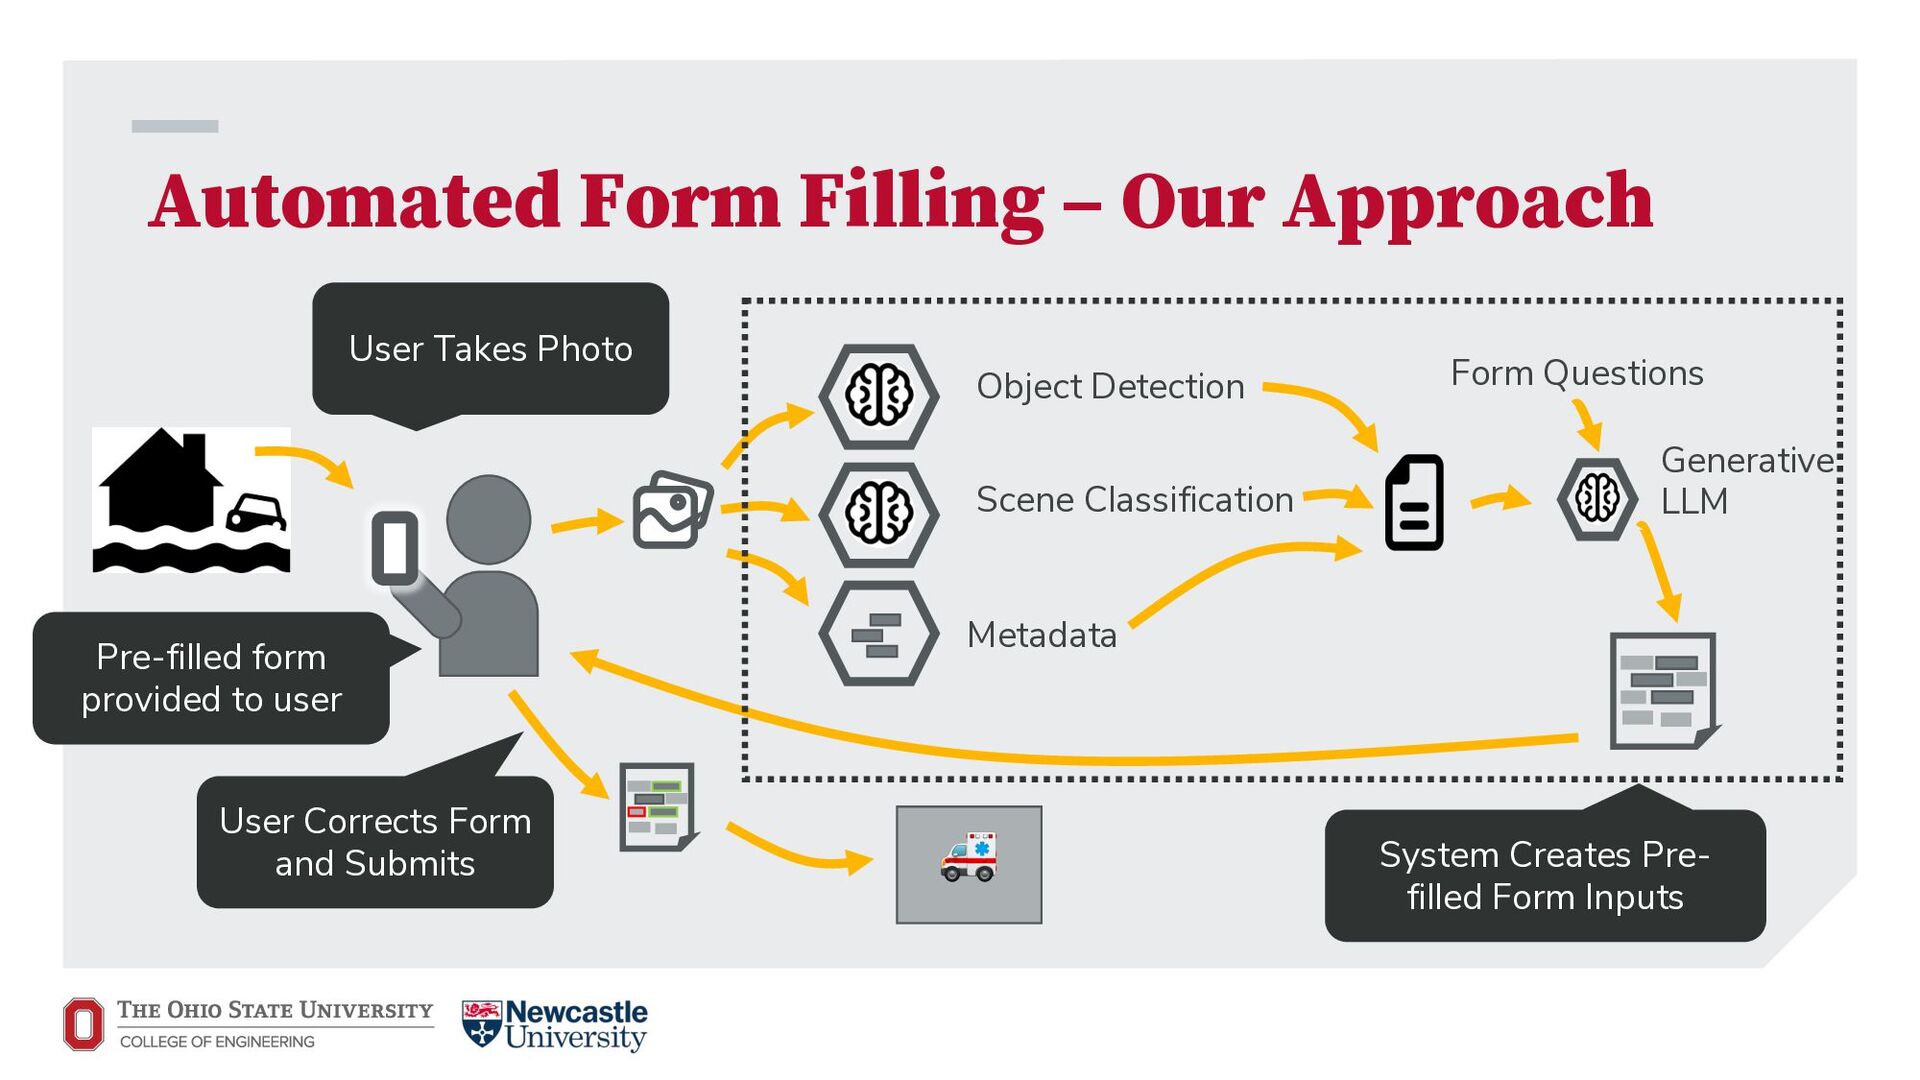
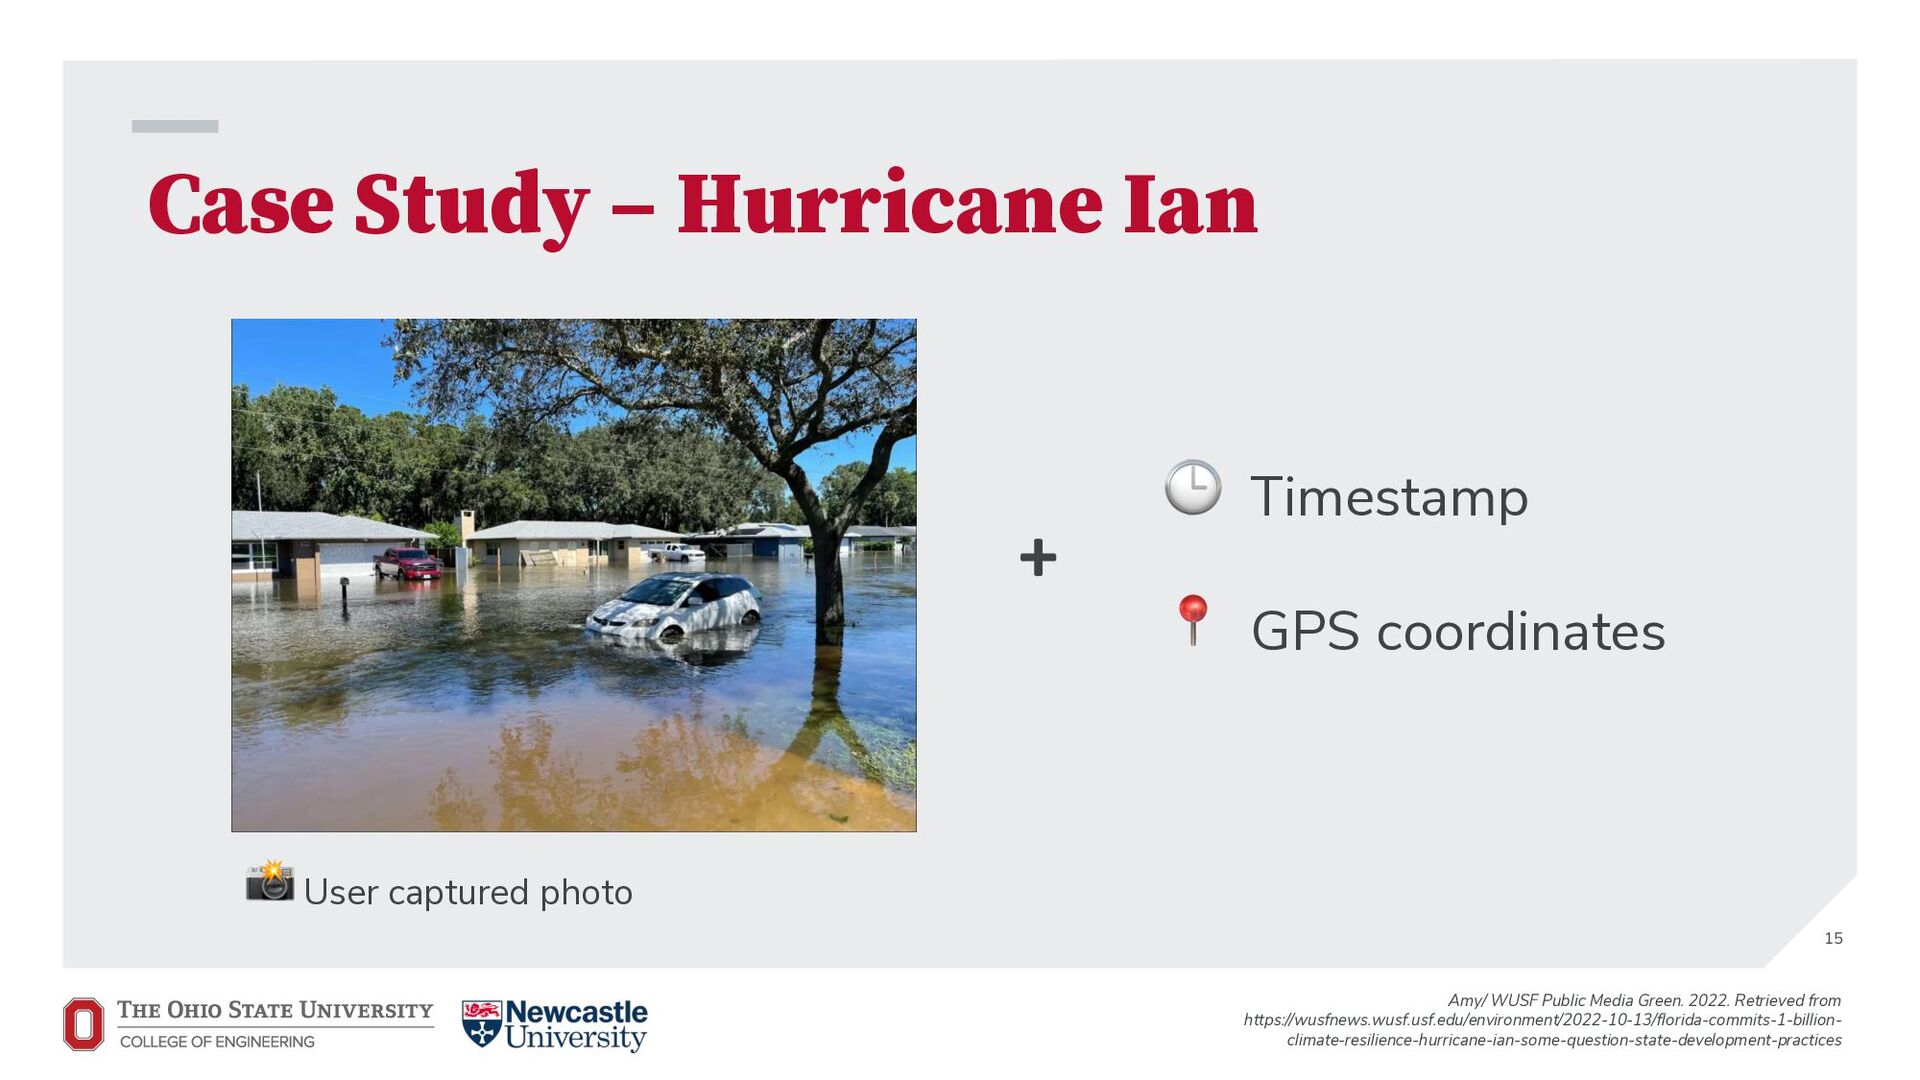
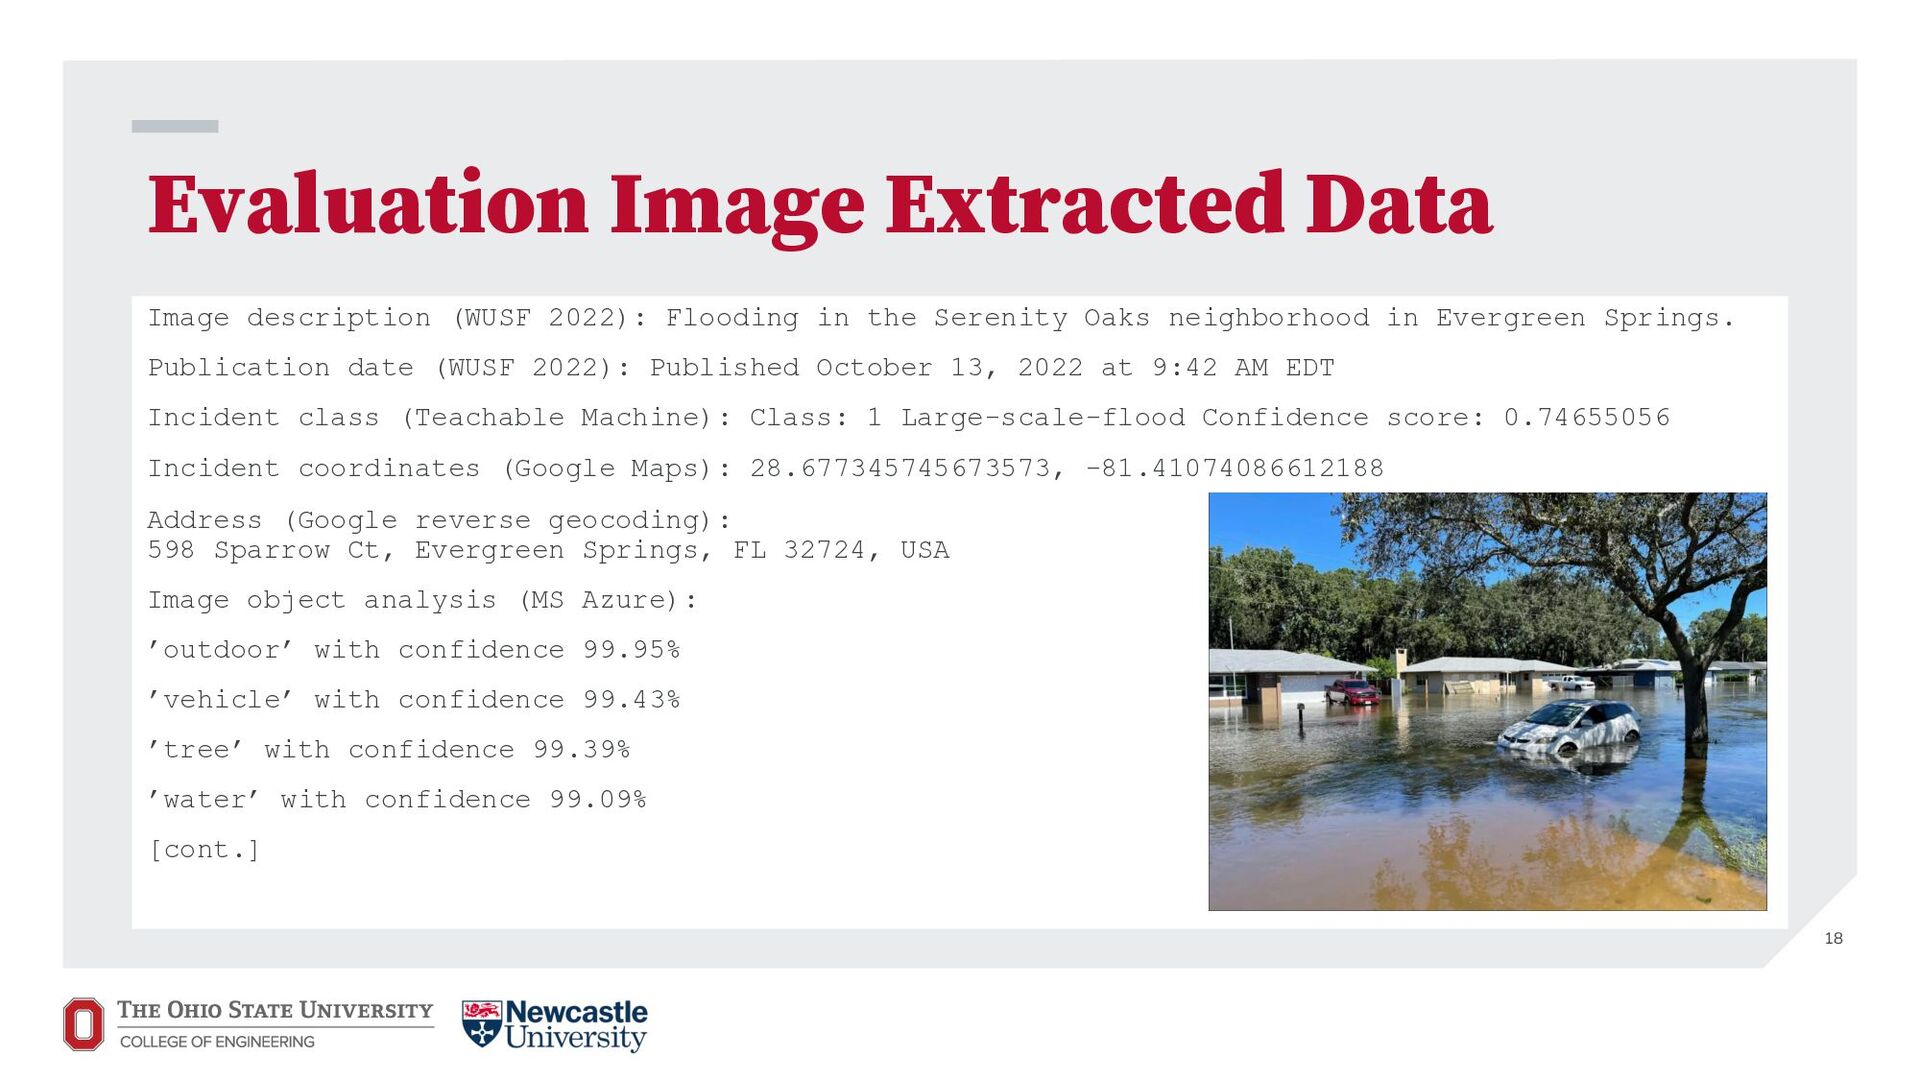
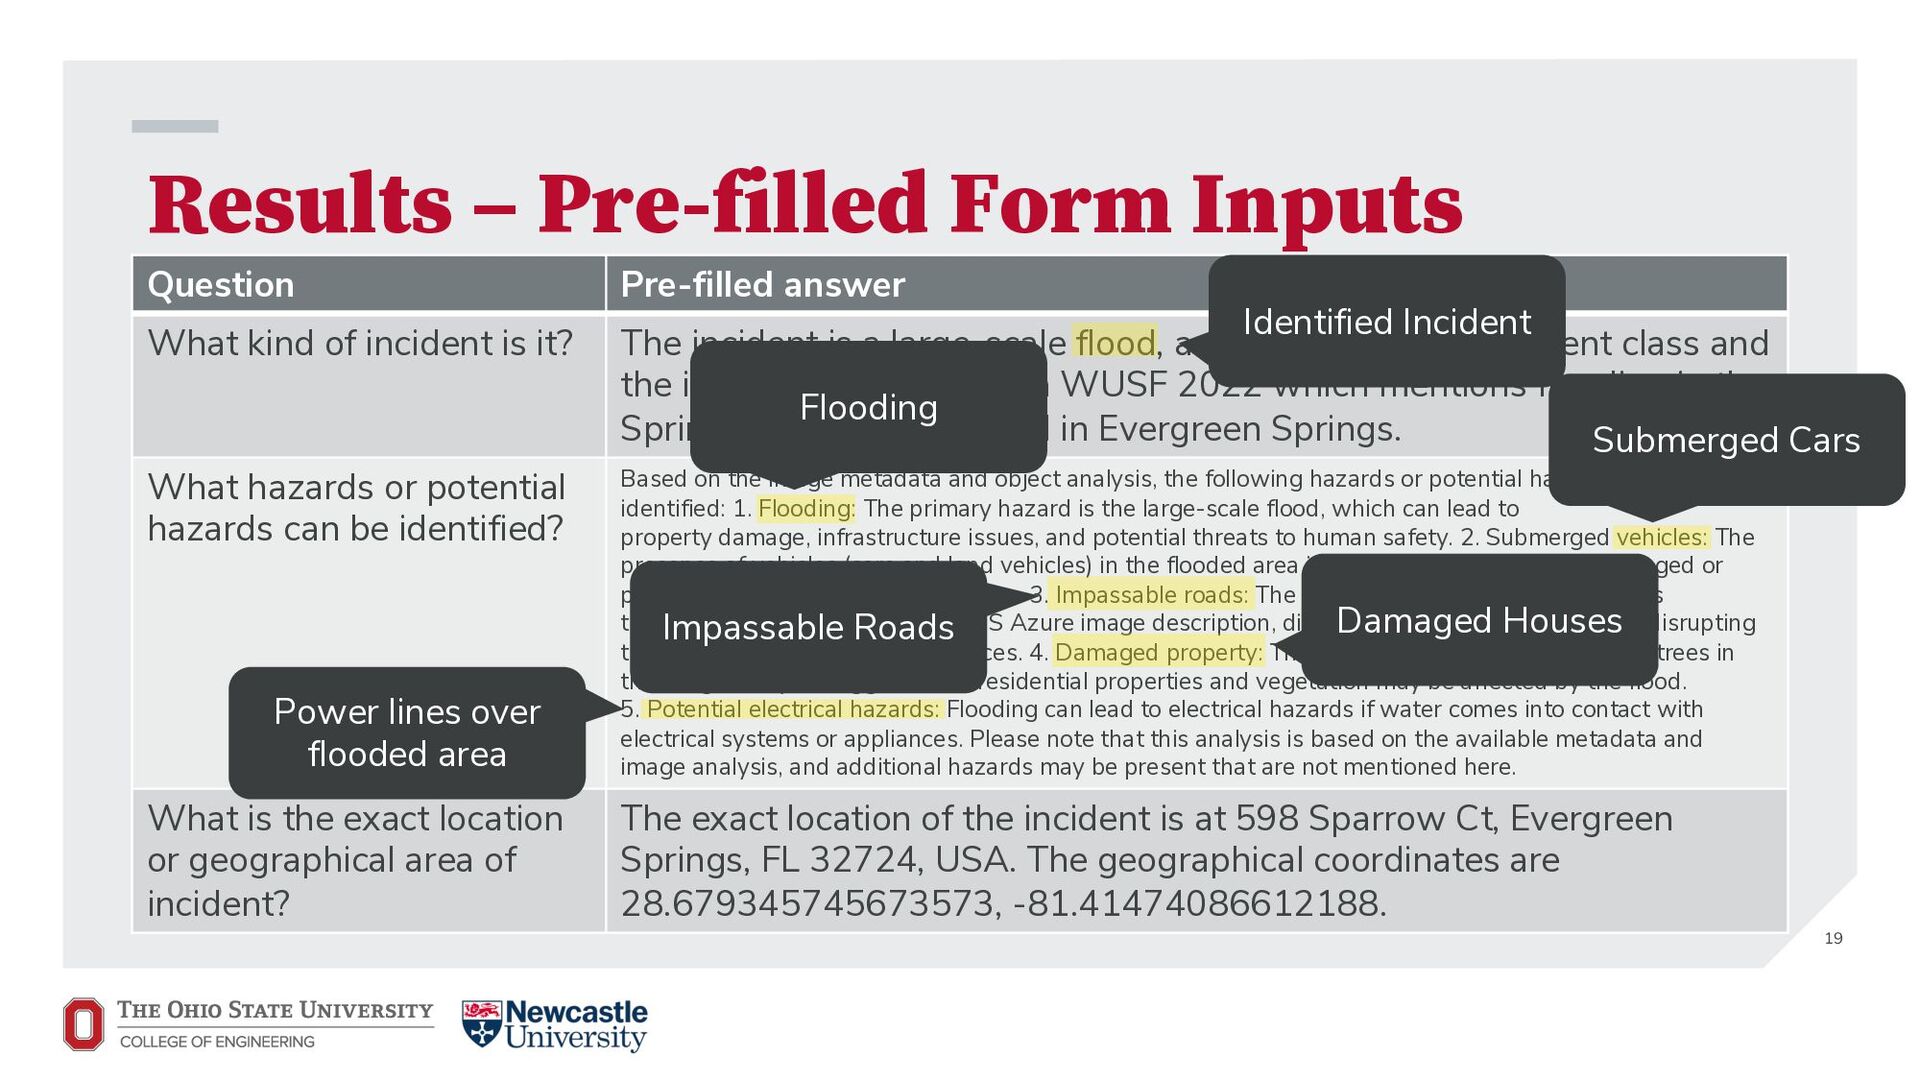
In this paper, we explore reducing the friction of climate hazard reporting by automating parts of the form-filling process. By building on existing computer vision and natural language models, we demonstrate the automated generation of a full-form hazard impact assessment report from a single photograph. Our proposed data pipeline can be integrated with existing systems and used with geospatial data solutions, such as flood hazard maps.

Arnab Nandi

June 18, 2023
Tweet

More Decks by Arnab Nandi

Other Decks in Technology

Transcript

  1. Camera-First Form Filling:
    Reducing the Friction in
    Climate Hazard Reporting
    Kristina Wolf (Newcastle University, UK)
    Dominik Winecki (The Ohio State University, USA)
    Arnab Nandi (The Ohio State University, USA)

    View Slide

  2. 2
    Disasters are
    becoming more
    common, more
    intense, and affecting
    more people
    United Nations, 2015
    “Transforming our world: the 2030 Agenda
    for Sustainable Development”

    View Slide

  3. Disaster response requires data
    Individuals need to report damage and needs to get proper help
    3

    View Slide

  4. 4
    PEOPLE ARE STRESSED
    AND RUSHED
    REPORTING HAS A HIGH
    COGNATIVE LOAD
    DATA QUALITY AND
    QUANTITY BOTH SUFFER
    THE PROBLEM
    Disaster Reporting is a High Friction Task

    View Slide

  5. Sources of Friction: Form Filling
    5
    Complexity Expectations
    • Jargon
    • Acronyms
    • Format
    • Scope
    • Breadth
    • Text Fields • Boolean Fields
    • Dropdown Lists
    • Geo Selection
    Typing Tap / Scroll / Slide
    Interaction Friction Domain Friction
    • Time-to-task
    • Interactions
    • Discoverability
    MEASURED AS
    • Accuracy
    • Comprehensiveness
    MEASURED AS

    View Slide

  6. Problem Statement
    6
    Given a hazard scene and a form,
    reduce the friction needed to produce
    an accurate & easy-to-read submission
    • A citizen should be able to quickly and easily submit a form
    • An emergency responder must receive a useful report
    ! → → "
    Citizen Emergency Responder
    Form
    Scene

    View Slide

  7. OUR APPROACH
    Camera-first Form Filling
    ! → " → # → $
    • Provide the citizen a pre-filled form with
    predicted inputs based on a photo
    • Friction reduced to taking a photo
    • Often, photos are required anyways
    7

    View Slide

  8. Automated Form Filling Reduces Friction
    8
    Fewer Inputs Improved Discoverability
    Fields will be mostly correct at the
    start. Only errors and omissions
    need correcting.
    The user is implicitly given an
    example completed form. They are
    primed to respond in the correct
    format and better understand what
    is expected of them.

    View Slide

  9. Implementation
    • Starts with a citizen taking a photo
    • Process for generating form inputs
    • Extract text descriptions
    • Use a generative LLM to answer
    questions about that data
    9

    View Slide

  10. 1) Input Data
    • When a disaster occurs, a person takes a photo of a scene
    10

    View Slide

  11. 2) Data Processing
    11
    • Multiple models are used to generate a text description of the
    event from the pictures
    EXIF metadata extraction
    Reverse Geocoding
    Trained Disaster Classifier
    (MobileNet via. Teachable Machine)
    MS Azure Object Analysis
    MS Azure Scene Description
    Semi-structured text

    View Slide

  12. 3) Generating Form Answers
    • Event description text is given to a generative LLM, which is
    prompted with form questions
    12
    Form Questions
    Pre-Filled Form
    LLM

    View Slide

  13. 4) User Correction & Submission
    • Pre-Filled form is given to the user for correction and
    submission
    13
    Form pre-filling service
    "

    View Slide

  14. Automated Form Filling – Our Approach
    !
    Metadata
    Object Detection
    Scene Classification
    Form Questions
    Generative
    LLM
    System Creates Pre-
    filled Form Inputs
    User Takes Photo
    User Corrects Form
    and Submits
    Pre-filled form
    provided to user

    View Slide

  15. Case Study – Hurricane Ian
    Amy/ WUSF Public Media Green. 2022. Retrieved from
    https://wusfnews.wusf.usf.edu/environment/2022-10-13/florida-commits-1-billion-
    climate-resilience-hurricane-ian-some-question-state-development-practices
    15
    +
    " Timestamp
    # GPS coordinates
    ! User captured photo

    View Slide

  16. Case Study -
    Model Incident Form
    M/ETHANE
    • What is the exact location of the incident?
    • What kind of incident is it?
    • What hazards can be identified?
    16
    Joint Emergency Service
    Interoperability Programme
    JESIP C/O Hertfordshire Police HQ. 2023.
    Retrieved from https://www.jesip.org.uk/joint-doctrine/m-ethane/

    View Slide

  17. Evaluation Considerations
    Evaluation Criteria:
    • Similarity to human input
    • Human legibility
    • Consistency across inputs
    • Conciseness
    • Comprehensiveness
    17
    Problem Considerations:
    • Time to Task/Interactions
    • Discoverability
    • Scope
    • Accuracy*

    View Slide

  18. Evaluation Image Extracted Data
    Image description (WUSF 2022): Flooding in the Serenity Oaks neighborhood in Evergreen Springs.
    Publication date (WUSF 2022): Published October 13, 2022 at 9:42 AM EDT
    Incident class (Teachable Machine): Class: 1 Large-scale-flood Confidence score: 0.74655056
    Incident coordinates (Google Maps): 28.677345745673573, -81.41074086612188
    Address (Google reverse geocoding):
    598 Sparrow Ct, Evergreen Springs, FL 32724, USA
    Image object analysis (MS Azure):
    ’outdoor’ with confidence 99.95%
    ’vehicle’ with confidence 99.43%
    ’tree’ with confidence 99.39%
    ’water’ with confidence 99.09%
    [cont.]
    18

    View Slide

  19. Results – Pre-filled Form Inputs
    Question Pre-filled answer
    What kind of incident is it? The incident is a large-scale flood, as indicated by the incident class and
    the image description from WUSF 2022 which mentions flooding in the
    Spring Oaks neighborhood in Evergreen Springs.
    What hazards or potential
    hazards can be identified?
    Based on the image metadata and object analysis, the following hazards or potential hazards can be
    identified: 1. Flooding: The primary hazard is the large-scale flood, which can lead to
    property damage, infrastructure issues, and potential threats to human safety. 2. Submerged vehicles: The
    presence of vehicles (cars and land vehicles) in the flooded area indicates that they may be damaged or
    pose a risk to drivers and passengers. 3. Impassable roads: The flooding may make roads, such as
    the parking lot mentioned in the MS Azure image description, difficult or impossible to navigate, disrupting
    transportation and access to services. 4. Damaged property: The presence of water, houses, and trees in
    the image analysis suggests that residential properties and vegetation may be affected by the flood.
    5. Potential electrical hazards: Flooding can lead to electrical hazards if water comes into contact with
    electrical systems or appliances. Please note that this analysis is based on the available metadata and
    image analysis, and additional hazards may be present that are not mentioned here.
    What is the exact location
    or geographical area of
    incident?
    The exact location of the incident is at 598 Sparrow Ct, Evergreen
    Springs, FL 32724, USA. The geographical coordinates are
    28.679345745673573, -81.41474086612188.
    19
    Identified Incident
    Flooding
    Submerged Cars
    Impassable Roads Damaged Houses
    Power lines over
    flooded area

    View Slide

  20. Insights & Findings
    • Metadata and computer vision are sufficient to answer most
    M/ETHANE questions
    • Off-the-shelf models are surprisingly good!
    • Generative LLMs produced reasonable form entries
    • Pre-filled forms provide discoverability of expected inputs
    20

    View Slide

  21. Limitations
    • For best results custom models are needed
    • Off-the-Shelf models are surprisingly good
    • Form complexity may impact behavior in unknown ways
    • Users may trust model too much
    • Both reporters and responders
    21

    View Slide

  22. Architecture Considerations
    • Models run at Edge or Cloud
    • Tradeoff between
    battery/compute limitations,
    and network dependency
    • Especially in emergency settings
    22

    View Slide

  23. Model Considerations
    • Model Prompting
    • GPT 4 tended to explain its own limitations
    • Not correct behavior in a form; carefully crafted prompts fix this
    • Output Reproducibility
    • People will likely use the format of the pre-filled fields
    • Must ensure the models produce the desired format
    23

    View Slide

  24. Takeaways
    • Disaster Reporting is a High Friction Task
    • We automated it with Computer Vision & Generative Models
    • Found positive results in a case study on flood reporting
    24

    View Slide

  25. 25
    Thank you
    https://go.osu.edu/camera-climate

    View Slide