Upgrade to Pro — share decks privately, control downloads, hide ads and more …

Evaluating Interactive Data Systems: Workloads, Metrics, and Guidelines

Evaluating Interactive Data Systems: Workloads, Metrics, and Guidelines

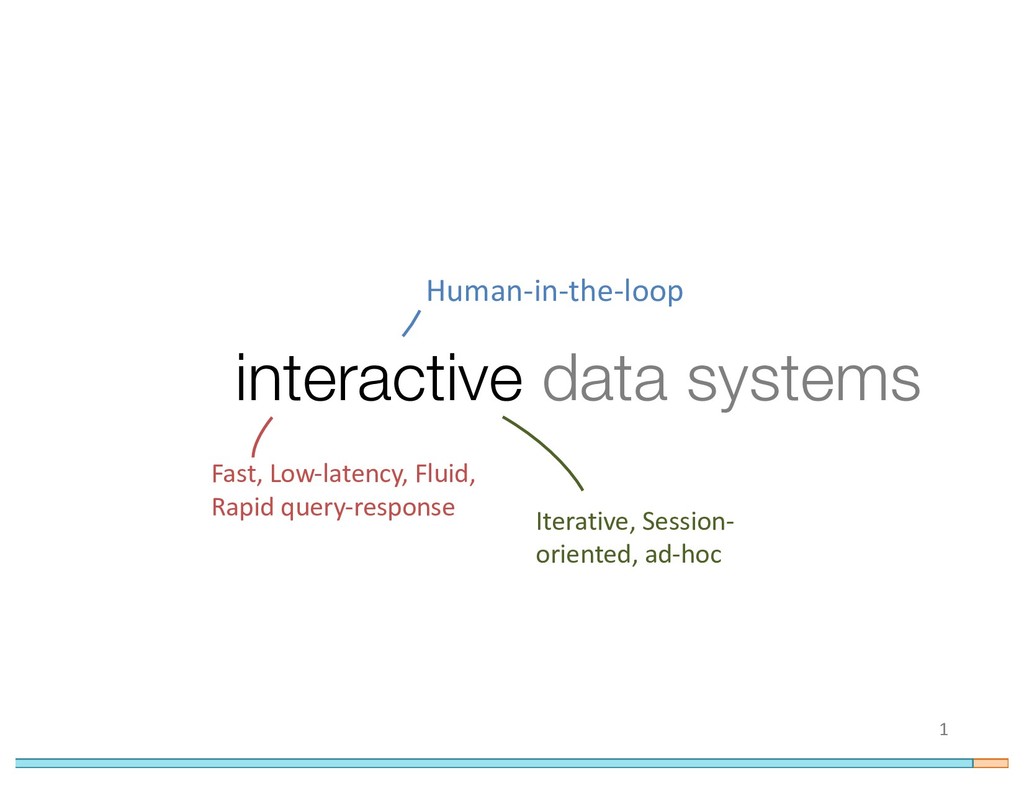
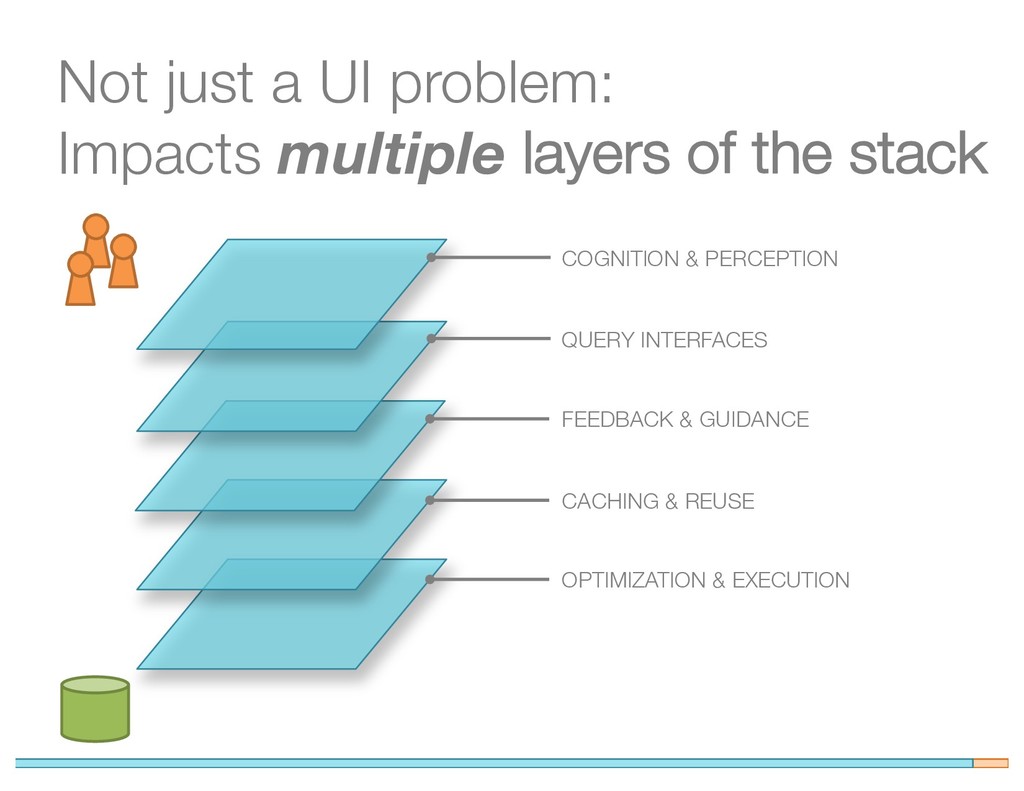
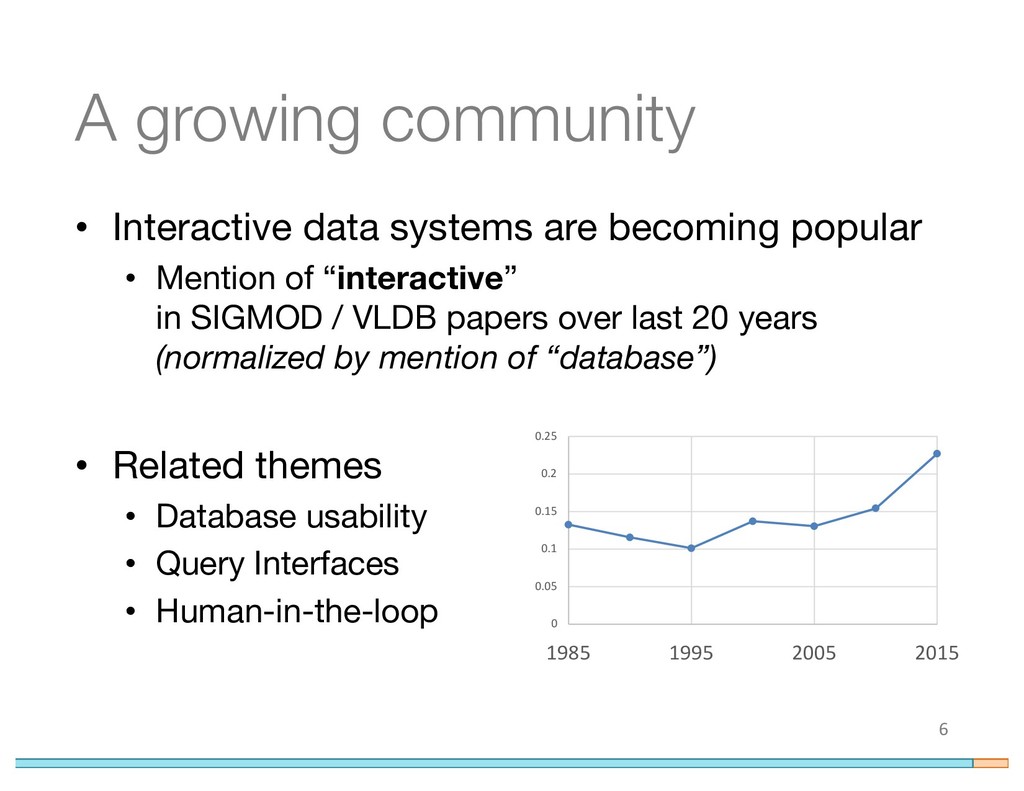
Highly interactive query interfaces have become a popular tool for ad-hoc data analysis and exploration. Compared with traditional systems that are optimized for throughput or batched performance, ad-hoc exploration systems focus more on user-centric interactivity, which poses a new class of performance challenges to the backend. Further, with the advent of new interaction devices (e.g., touch, gesture) and different query interface paradigms (e.g., sliders, maps), maintaining interactive performance becomes even more challenging. Thus, when building and evaluating interactive data systems, there is a clear need to articulate the evaluation space.

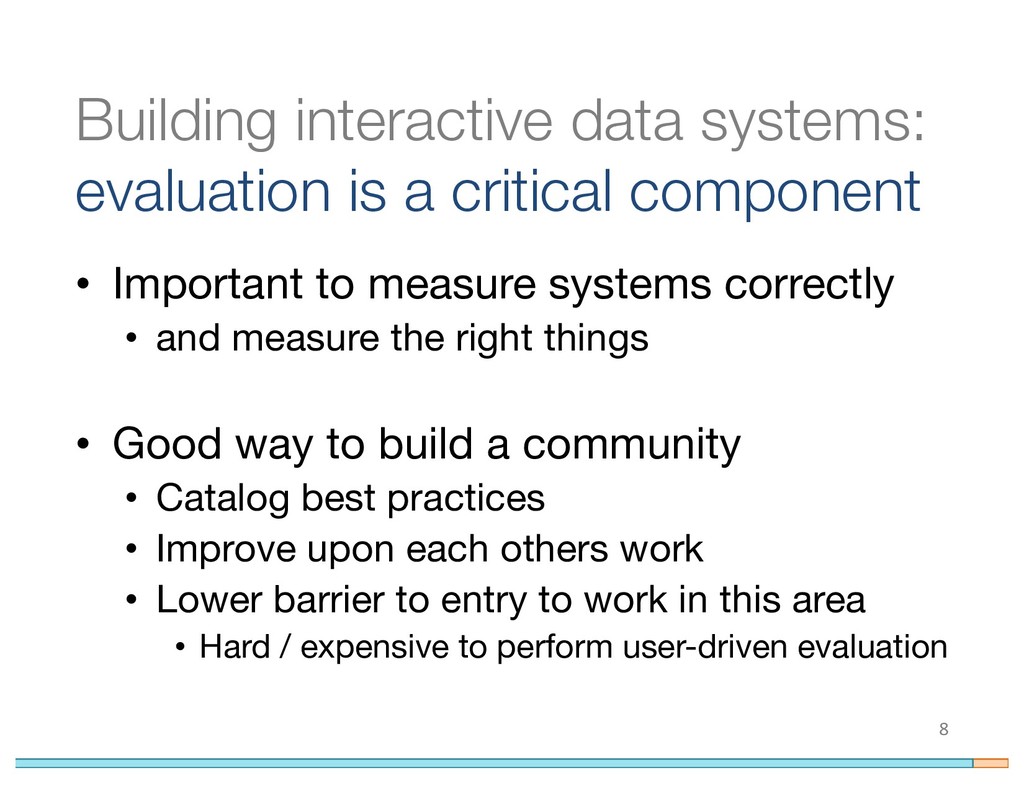
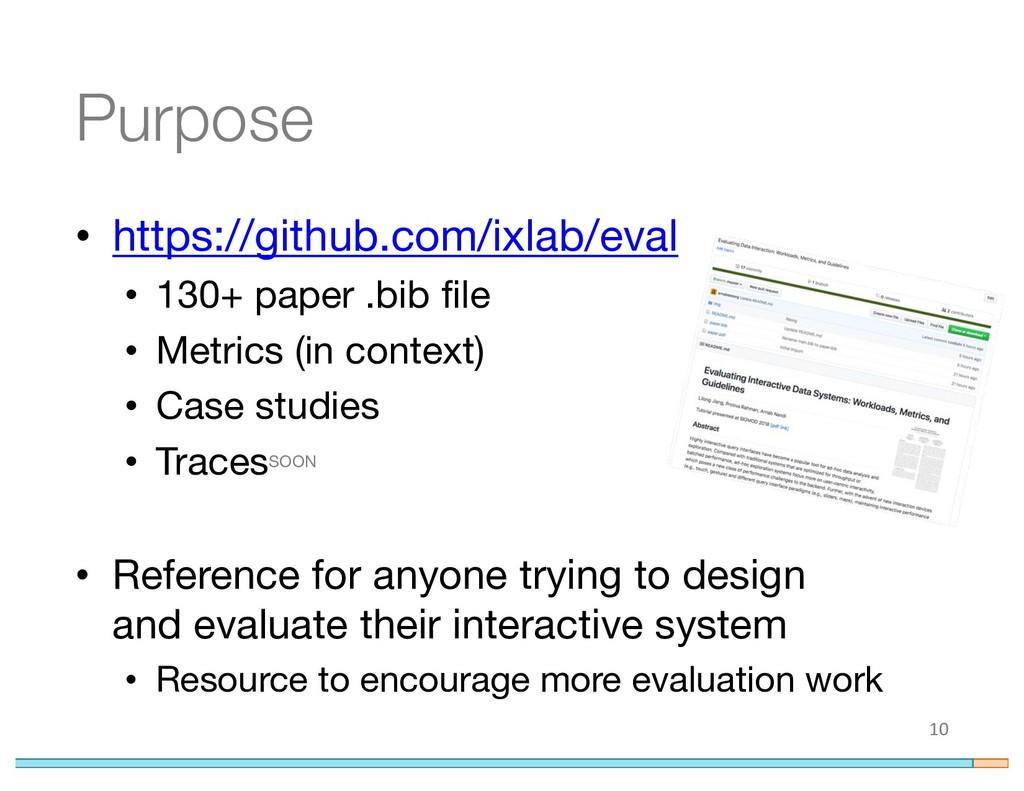
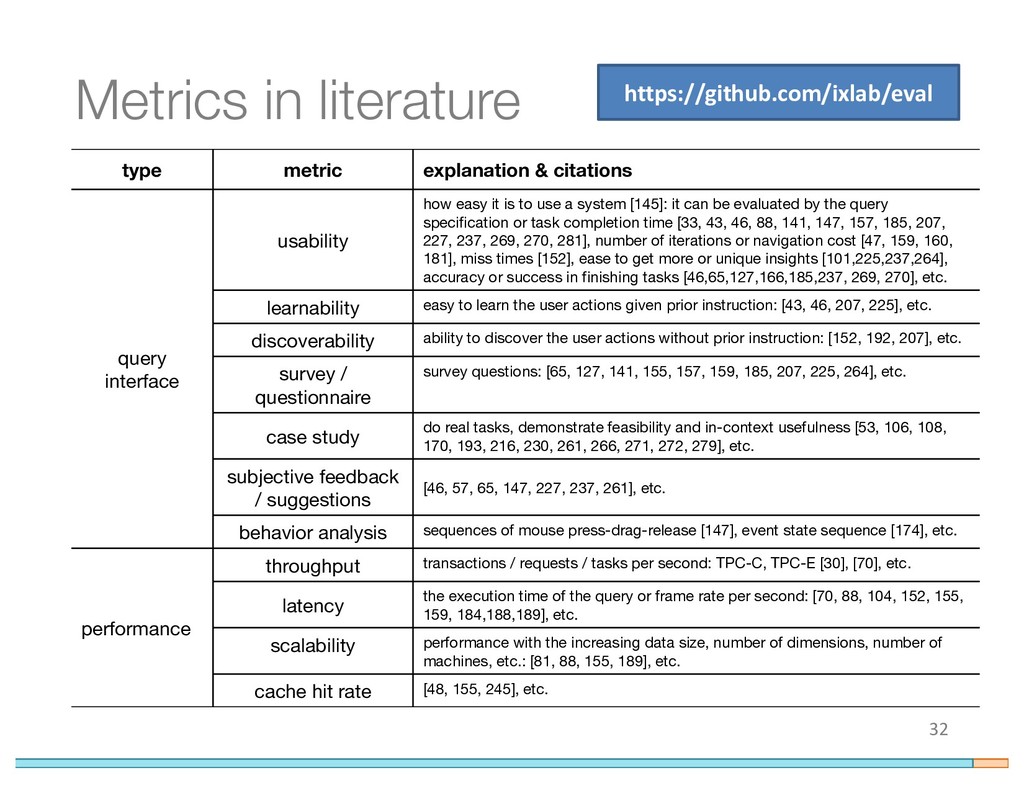
In this paper, we describe unique characteristics of interactive workloads for a variety of user input devices and query interfaces. Based on a survey of literature in data interaction, we catalog popular metrics for evaluating such systems, highlight their deficiencies, and propose complementary metrics that allow us to provide a complete picture of interactivity. We motivate the need for behavior-driven optimizations of these interfaces and demonstrate how to analyze and employ user behavior for system enhancements through three scenarios that cover multiple device and interface combinations. Our case studies can inspire guidelines to help system designers design better interactive data systems, and can serve as a benchmark for evaluating systems that use these interfaces.

Arnab Nandi

June 12, 2018
Tweet

More Decks by Arnab Nandi

Other Decks in Education

Transcript

  1. Evaluating Interactive Data Systems: Workloads, Metrics, and Guidelines Lilong Jiang

    Protiva Rahman Arnab Nandi interactive data systems research group at ohio state
  2. Not just a UI problem: Impacts multiple layers of the

    stack COGNITION & PERCEPTION CACHING & REUSE FEEDBACK & GUIDANCE OPTIMIZATION & EXECUTION QUERY INTERFACES
  3. Some of our attempts Data Tweening [VLDB 17] Perceptually-aware Visualizations

    [DSIA 15] SnapToQuery: Query Feedback [VLDB 15] Skimmer: Rapid Browsing [SIGMOD 12] Guided Interaction [VLDB 11] FluxQuery: Main memory execution engine, cyclic shared scans [SIGMOD 16] DICE: Interactive / Approx. Cubing [ICDE 14] Result Reuse for NLP [DNIS 15] Structured Autocompletion [SIGMOD 07] Querying Beyond Keyboards [VLDB14, CHI13] Growing community of researchers doing some amazing work on these fronts
  4. A growing community • Interactive data systems are becoming popular

    • Mention of “interactive” in SIGMOD / VLDB papers over last 20 years (normalized by mention of “database”) • Related themes • Database usability • Query Interfaces • Human-in-the-loop 6 0 0.05 0.1 0.15 0.2 0.25 1985 1995 2005 2015
  5. Building interactive data systems: evaluation is a critical component •

    Important to measure systems correctly • and measure the right things • Good way to build a community • Catalog best practices • Improve upon each others work • Lower barrier to entry to work in this area • Hard / expensive to perform user-driven evaluation 8
  6. Some recent related work • IDEBench: Eichmann, Binnig, Kraska, Zraggen

    • Focus: ad-hoc OLAP, approximation • VizPerf: Battle, Chang, Heer, Stonebraker • Focus: VIS + DB, standardized benchmark • Vis + DB Dagstuhl Evaluation Cohort • Discussed at this HILDA 9
  7. Purpose • https://github.com/ixlab/eval • 130+ paper .bib file • Metrics

    (in context) • Case studies • TracesSOON • Reference for anyone trying to design and evaluate their interactive system • Resource to encourage more evaluation work 10
  8. What this is not • Not a standardized benchmark •

    Not the only way to evaluate interactive data systems • Reason: heterogeneity • Not a canonical list of metrics • Your system may need to measure something more as well • Not evaluating the user • Instead, evaluating the system • Not redoing HCI / CHI • Let’s learn from human factors, cognitive science, other fields and enrich systems evaluation 11
  9. Focus of this work / Outline • Salient Features /

    Challenges in Evaluation • Guidelines (large-scale survey of related work) • Metrics based on user behavior • Biases • Case Studies • Inertial Scroll • Filter and Map • Crossfiltering • Open Problems 12
  10. Outline • Salient Features / Challenges in Evaluation • Guidelines

    (large-scale survey of related work) • Metrics • Biases • Case Studies • Inertial Scroll • Filter and Map • Crossfiltering • Open Problems 13
  11. Characteristics of Interactive Workloads for Devices and Interfaces • Device

    and interfaces • sensing rate • map, slider • Continuous gestures • slider, linking & brushing • interactivity 14 • Ambiguous Query Intent • Exploratory Analysis • Session behavior • adjacent queries: related, identical, similar results
  12. Devices and Interfaces • Devices have different sensing rates ->

    different query issuing frequencies • Device-Interface combination generates different workloads • Sliders are more intensive than text • Zooming on map has two predicate changes • Examples: • TouchViz • DBTouch 15
  13. TouchViz (Steven M. Drucker , Danyel Fisher , Ramik Sadana,

    Jessica Herron , M.C. Schraefel, CHI 2013) • Need for comparison on mouse based devices • “Comparisons using mouse based interaction. The two conditions that we explored are both on a touch device, and we do not compare these interfaces with operations on a mouse based/desktop display. ..It would be interesting to see if the results in this study hold for mouse based interaction in addition to touch.” • Expanding to multi-device interfaces require additional studies. • “Longitudinal studies moving back and forth between desktop and touch device. Users often move between different applications and different devices with different affordances….This study showed that there is also clearly some benefit of tuning the interaction to the affordance of a particular device. Future work should examine this problem in a more holistic fashion, perhaps as a longitudinal study where users need to move back and forth between the desktop and a touch oriented device.” 16
  14. DBTouch (Stratos Idreos, Erietta Liarou, CIDR 2013) • Varying gesture

    speeds affects amount of data processed • “Varying Gesture Speed. .. observes what happens with a varying speed of applying the basic slide gesture for an interactive summaries query... As we slow down the speed of the gesture, we are able to observe/process more data. dbTouch captures more touch input and it can map this input to object identifiers of the underlying data.” • Screen size affects amount of data processed • “Varying Object Size. ..we test what happens as the size of a data object changes…. By adjusting the object size we allow for more detail; as the size increases, the same gesture speed allows the inspection of more data....via adjustments of the object size a user can interactively get a more fine grained or a more high level view of the data on demand.” 17
  15. Continuous Action • Human-in-the-loop • Continuous manipulation -> continuous query

    generation • Immediate feedback • Focus on low latency • Examples: • Retrospective Adaptive Prefetching • Prefetching for Visual Data Exploration 18 0 0 10 10,000 20,000 20 30 40 50 0 100 150 200 300 350 15,000 30,000 250 0 12,500 25,000 50 55 60 65 70 75 Range: 0 - 50 Range: 50 - 70 Range: 150 - 300
  16. • “In traditional systems, once a query is posed, the

    database controls the data flow, i.e., it is in full control regarding which data it processes and in what order, such as to compute the result to the user query.” • “In dbTouch, a query is a session of one or more continuous gestures and the system needs to react to every touch, while the user is now in control of the data flow.” 19 DBTouch (Stratos Idreos, Erietta Liarou, CIDR 2013)
  17. Retrospective Adaptive Prefetching (RAP) (Serdar Yeşilmurat, Veysi İşler, Geoinformatica 2013)

    • Low latency through prefetching • “ As expected, the map refresh time increases when more tiles are requested from the map server…Since some tiles are already in the prefetching cache, they are loaded from the cache, which reduces the refresh time ” • Simulating user behavior as a sequence of navigations • “The tests are completely automated by simulating user actions... a one-second delay is inserted between navigations to reflect average user behavior. For each test, 21 randomly generated navigations are simulated … 100 tests are executed, and in each test, a unique list of 21 navigations is implemented. ..They all contain 21 navigations to ensure consistency across comparisons." • Related: ForeCache (Leilani Battle, Remco Chang, Michael Stonebraker, SIGMOD 2016) 20
  18. Prefetching for Visual Data Exploration (Punit R. Doshi, Elke A.

    Rundensteiner and Matthew O. War, SIGMOD 2002) • Simulation studies with varying navigation patterns • “We study the effect of differences in navigation patterns by (1) varying the number of hot regions, (2) erratic versus directional navigation patterns and (3) delay between user requests.” • Traces from real user studies used to validate simulations • “We have performed a user-study with real users during which time our logging tool collected the traces of user explorations…. These traces consisted of 30 minutes each for 20 different users. These traces when given as input to our tool under various system settings gave results similar to our synthetic user traces, confirming our conclusions outlined above.” 21
  19. Ambiguous Query Intent “I can’t tell you what I want…

    …but I’ll know it when I see it!” • assumption: • User can express what they want • There exists exactly one well-formed query • solution: • Interactive UIs: Let user play / poke at data • Guide them to their intended result using feedback • Exploratory and Interactive Querying • Another concern: Sensitivity and Jitter • No haptic feedback • Unintended, noisy, repeated queries • Examples: • SeeDB • GestureDB 22 Query Intent Model (Fluxquery, Ebenstein et al., SIGMOD, 2016)
  20. GestureDB (Arnab Nandi, Lilong Jiang, Michael Mandel, VLDB 2014) •

    Anticipating the intended query • “we compare the ability of three different classifiers to anticipate a user’s intent. The first uses only proximity of the UI elements to predict the desired query. • The second uses proximity and schema compatibility of attributes and the third uses proximity, schema compatibility, and data compatibility.” 24
  21. Session Behavior • Users are interested in answering a question

    during session • Most queries in a session are related to each other • Opportunities for optimizations • Examples: • Forecache • Sesame 25
  22. ForeCache (Leilani Battle, Remco Chang, Michael Stonebraker, SIGMOD 2016) •

    Actions are session/task dependent • “The average number of requests per task are as follows: 35 tiles for Task 1, 25 tiles for Task2, and 17 tiles for Task 3. The mountain ranges in Tasks 2 and 3 (Europe and South America) were closer together and had less snow than those in task 1 (US and Southern Canada). Thus, users spent less time on these tasks, shown by the decrease in total requests.” • Users have similar behavior • “We also found that large groups of users shared similar browsing patterns. These groupings further reinforce the reasoning behind our analysis phases, showing that most users can be categorized by a small number of specific patterns within each task, and even across tasks.” 26
  23. Sesame (Niranjan Kamat, Arnab Nandi, TKDD 2016) • Benefit in

    session aware-speculation: • “Response Time across Varying Data Sizes. The benefit of our system is evident: ALGOSESAME is typically at least an order of magnitude faster than traditional database querying. As an anecdotal example, with 192 shards, ALGOSESAME is 18 faster than traditional execution for WorkloadTPCDS and 25 faster for WorkloadReal.” • “Overall Speculation Benefit. The Overall Speculation Benefit is similar to the query speedup initially, which increases as a greater fraction of time is spent actually running the query compared to the time spent in setting up the query execution, whose increase is relatively slower. Notably, the Overall Speculation Benefit is consistently greater than 1.” 27
  24. Salient Features of Interactive Systems • Devices and Interfaces •

    Continuous Actions • Ambiguous Query Intent • Session Behavior 28
  25. Outline • Salient Features / Challenges in Evaluation • Guidelines

    (large-scale survey of related work) • Metrics • Biases • Case Studies • Inertial Scroll • Filter and Map • Crossfiltering • Open Problems 29
  26. Traditional Benchmarking -TPC • Ideal for transactional systems • Need

    to consider humans-in-the-loop • Performance • TPC-C, TPC-E: OLTP • TPC-DI: ETL • TPC-DS, TPC-H: OLAP • Human-in-the-loop systems require richer latency constraints • Simply measuring max / median / mean does not cut it • Need metrics for human factors 30
  27. Metrics • Performance • Throughput • Latency • Scalability •

    Cache Hit Rate • Query Issuing Frequency • Latency Constraint Violation 31 • Human Factors • Quantitative • Usability • Learnability • Discoverability • Accuracy • Qualitative • User Feedback • Design Study
  28. Metrics in literature 32 type metric explanation & citations query

    interface usability how easy it is to use a system [145]: it can be evaluated by the query specification or task completion time [33, 43, 46, 88, 141, 147, 157, 185, 207, 227, 237, 269, 270, 281], number of iterations or navigation cost [47, 159, 160, 181], miss times [152], ease to get more or unique insights [101,225,237,264], accuracy or success in finishing tasks [46,65,127,166,185,237, 269, 270], etc. learnability easy to learn the user actions given prior instruction: [43, 46, 207, 225], etc. discoverability ability to discover the user actions without prior instruction: [152, 192, 207], etc. survey / questionnaire survey questions: [65, 127, 141, 155, 157, 159, 185, 207, 225, 264], etc. case study do real tasks, demonstrate feasibility and in-context usefulness [53, 106, 108, 170, 193, 216, 230, 261, 266, 271, 272, 279], etc. subjective feedback / suggestions [46, 57, 65, 147, 227, 237, 261], etc. behavior analysis sequences of mouse press-drag-release [147], event state sequence [174], etc. performance throughput transactions / requests / tasks per second: TPC-C, TPC-E [30], [70], etc. latency the execution time of the query or frame rate per second: [70, 88, 104, 152, 155, 159, 184,188,189], etc. scalability performance with the increasing data size, number of dimensions, number of machines, etc.: [81, 88, 155, 189], etc. cache hit rate [48, 155, 245], etc. https://github.com/ixlab/eval
  29. Throughput • Traditional metric • TPC-C, TPC-E • Can be

    measured as: • Transactions per second • Requests per second • Tasks per second • Example: Atlas System 33
  30. Atlas (Sye-Min Chan, Ling Xiao, John Gerth, Pat Hanrahan, VAST

    2008) - Throughput • System for interactive visualizing large scale temporal data • load balancing among distributed server • Speedup – increase in query throughput over baseline (1 server) with increase in number of servers • Number of queries processed by the database 34
  31. Latency • Query response = a lot more than query

    execution time • start = submit • Send query – network time • Query scheduling • Query execution • Summarization • Receive response – network time • Rendering 35
  32. Motivation for Low Latency in Literature 36 • Assessing Simulator

    Sickness in a See-Through HMD: Effects of Time Delay, Time on Task, and Task Complexity (Nelson et al., IMAGE Conference 2000) – latencies of 50-100ms affect ability of participants to visually follow an object with a head mounted device • Assessing Target Acquisition and Tracking Performance for Moving Targets in the Presence of Latency and Jitter (Pavlovych et al. Graphics Interface 2012) – Error rates significantly increase with latency above 110ms in mouse target acquisition tasks • How Fast is Fast Enough? A Study of the Effects of Latency in Direct-Touch Pointing Tasks, (Ricardo Jota, Albert Ng, Paul Dietz and Daniel Wigdor, CHI 2013) – “performance decreases with latency; ability to perceive latency in feedback to the land-on event range from 20 to 100ms”
  33. The Effects of Interactive Latency on Exploratory Visual Analysis (Zhicheng

    Liu and Jeffrey Heer, TVCG 2014) • Controlled user study comparing latency with 500ms difference per operation • Key findings: • “ (1) the additional delay results in reduced interaction and reduced dataset coverage during analysis;” • “(2) the rate at which users make observations, draw generalizations and generate hypotheses also declines due to the delay;” • “(3) initial exposure to delays can negatively impact overall performance even when the delay is removed in a later session.” 37
  34. Facetor (Abhijith Kashyap, Vagelis Hristidis, Michalis Petropoulos, CIKM 2010) -

    Latency • Reduces the expected navigation cost during faceted exploration • Latency interpreted as query execution time • “This experiment aims to show that UniformSuggestions is fast enough to be used in real-time. 38
  35. Scalability • Performance • Scale up: put everything in faster

    disk / main memory, increase CPU speed • Scale out: distributed systems, shard / split • Bottlenecks • Overhead cost • post-aggregation (highlighting, ranking) • Cognitive ability of users • Size and complexity of the data • summarization 39
  36. DICE (Niranjan Kamat, Prasanth Jayachandran, Karthik Tunga, Arnab Nandi, ICDE

    2014) - Scalability 40 • Distributed interactive cube exploration • Example of scaling out • Performance improvement bottoms out after a point
  37. Cache Hit Rate • Number of times an item was

    in the cache • Accuracy of Speculation • Cache Location • Frontend cache – reduces database load but hard to maintain – cache invalidation • Backend Cache – Predictable latency • Caching Strategy • Eviction-based – LRU, FIFO - ineffective • Predictive caching • Example: Scout 41
  38. Scout (Farhan Tauheed, Thomas Heinis, Felix Schurmann, Henry Markram ,

    Anastasia Ailamaki, VLDB 2012) – Cache Hit Rate • System for exploring spatial data – content-aware prefetching • Baselines • Hilbert Prefetch – prefetches nearest neighbors • straight line – extrapolates from previous moves • EWMA – weights recent moves as higher • Sensitivity analysis 42
  39. Query Issuing Frequency (QIF) • Sensing rate for devices has

    increased • Ipad: 30Hz, 120Hz with pencil • Number of queries issued per time interval • Tradeoff 43
  40. Latency Constraint Violation (LCV) • State of art = mean

    / median / max latency • Challenge = UIs are composed of a sequence of queries (in a workload, Qi+1 is dependent on result of Qi ) • Not captured in latency metrics • Dependent queries • Can cause cascading failures • Incorrect conclusions • Measured as binary or number of violations • Crossfiltering case study 44
  41. Metrics • Performance • Throughput • Latency • Scalability •

    Cache Hit Rate • Query Issuing Frequency • Latency Constraint Violation 45 • Human Factors • Quantitative • Usability • Learnability • Discoverability • Accuracy • Qualitative • User Feedback • Design Study
  42. Usability • Captures ease of use of the interface •

    Proxied by • task completion time • number of iterations • navigation cost • number of insights • uniqueness of insights • Example: Dataplay 46
  43. Dataplay (Azza Abouzied, Joseph M. Hellerstein, Avi Silberschatz, UIST 2012)

    - Usability • User study comparing 2 features (autocomplete query correction vs. direct manipulation of query tree) of the system - 13 participants • Task Completion time - 3 tasks • “Task 1: We gave users a query tree that finds (a) students who got A’s in some courses. We asked users to fix the query to find (a) students with all A’s. The complexity of this task is ‘1-tweak’.” • “Task 2: We gave users a query tree that finds (a) students who took courses in any of three areas. We asked users to fix the query to find (a) students who took courses in all and only the three areas. The complexity of this task is ‘2-tweaks’." • “Task 3: We gave users a query tree that finds (a) students who took any of three specific courses and got an A in any. We asked users to fix the query to find (a) students who took all three courses with A’s in them ignoring grades in other courses. The complexity of this task is ‘3-tweaks’.” 47
  44. Learnability • Ability to retain user actions with instructions •

    Usable vs. Learnable • Cockpit • Audience Dependent • DBA vs. consumer • Example: Kinetica 48
  45. Kinetica (Jeffrey M. Rzeszotarski, Aniket Kittur, CHI 2014) - Learnability

    • System that leverages touch interactions and physics based affordances for data visualization. • “In the case of Kinetica, participants followed a built-in tutorial that goes over each tool with a use case example” • “For the Excel participants, the study observer presented two well-viewed YouTube video tutorials on Excel and pivot tables/charts.” 49
  46. Discoverability • Ability to find user actions without instructions •

    Airport Kiosk is discoverable • Affordances – usage clues • Example: GestureDB 50
  47. GestureDB (Arnab Nandi, Lilong Jiang, Michael Mandel, VLDB 2014) -

    Discoverability • “Thus, our second study compares VISUAL QUERY BUILDER to GESTUREQUERY in terms of the discoverability of the JOIN action, i.e., whether an untrained user is able to intuit how to successfully perform gestural interaction from the interface and its usability affordances.” • “Each subject was provided a task described in natural language, and asked to figure out and complete the query task on each system within 15 minutes.” • The task involved a PREVIEW, FILTER, and JOIN, described to the subjects as answering the question, “What are the titles of the albums created by the artist ‘Black Sabbath’?” 51
  48. Accuracy • Database contract: • Old: Correct answer, unbounded latency

    • New: Approximate answer, strict latency • Mainly for systems • Sampling • Approximate Query Processing • Online aggregation • Measures error between sample result and true result • Example: Incvisage 52
  49. Incvisage (Sajjadur Rahman, et al. VLDB 2017) – Online Aggregation

    (Hellerstein et al. SIGMOD 1997) Accuracy • System that shows the user incremental visualizations that preserve its salient features. • Performance experiment: Compared avg. mean squared error across iterations against baselines • User Study: Quiz style evaluation – compared against online aggregation (OLA) • “The extrema-based questions asked a participant to find the highest or lowest values in a visualization. The range-based questions asked a participant to estimate the average value over a time range (e.g., months, days of the week).” • Accuracy measured as normalized difference from correct value. 53
  50. Metrics • Performance • Throughput • Latency • Scalability •

    Cache Hit Rate • Query Issuing Frequency • Latency Constraint Violation 54 • Human Factors • Quantitative • Usability • Learnability • Discoverability • Accuracy • Qualitative • User Feedback • Design Study
  51. User Feedback • Comments, suggestions, questionnaires/surveys • Pilot study to

    inform quantitative metrics and UI design • Can be quantitative – Likert scale • Insight based • Think aloud protocols • Anecdotal comments • Example: Scented Widget 55
  52. Scented Widgets (Wesley Willett, Jeffrey Heer, and Maneesh Agrawala, TVCG

    2007) • UIs embedded with visualizations • “After completing the tasks, subjects filled out a survey that asked them to rate the scenting conditions on perceived utility and user experience.” 56
  53. Design Study • Extended interviews with practitioners for task selection

    • Not a metric • Task Definition – articulate problem space • Example: Zenvisage 57
  54. Zenvisage (Tarique Siddiqui, Albert Kim, John Lee, Karrie Karahalios, Aditya

    Parameswaran, VLDB 2017) – Design Study • Taxonomy of tasks in literature: “The exploration tasks in Amar et al. include: filtering (f), sorting (s), determining range (r), characterizing distribution (d), finding anomalies (a), clustering (c), correlating attributes (co), retrieving value (v), computing derived value (dv), and finding extrema (e).” • Meet with experts: “We hired seven data analysts via Upwork, a freelancing platform—we found these analysts by searching for freelancers who had the keywords analyst or tableau in their profile.” • Workflow analysis: “We conducted one hour interviews with them to understand how they perform data exploration tasks. The interviewees had 3—10 years of prior experience, and told about every step of their workflow; from receiving the dataset to presenting the analysis to clients.” • Validate by experts: “When we asked the data analysts which tasks they use in their workflow, the responses were consistent in that all of them use all of these tasks, except for three exceptions—c, reported by four participants, and e, d, reported by six participants.” 58
  55. Outline • Salient Features / Challenges in Evaluation • Guidelines

    (large-scale survey of related work) • Metrics • Confounding factors and Biases • Case Studies • Inertial Scroll • Filter and Map • Crossfiltering • Open Problems 59
  56. Learning – Practice Effects • Within-subject study • Same task

    – different system • Different task - same system • Multiple datasets, multiple systems • Improved performance on second system 61
  57. Accounting for Learning • Randomize or Counterbalance • Counterbalancing -

    Example: Voyager: Exploratory Analysis via Faceted Browsing of Visualization Recommendations (Wongsuphasawat et al., TVCG 2015) • Each participant conducted two exploratory analysis sessions, each with a different visualization tool and dataset. We counterbalanced the presentation order of tools and datasets across subjects. • Different Users for each task - Example: SnapToQuery (Lilong Jiang, Arnab Nandi, VLDB 2015) • “It should be noted that in order to avoid bias and memory effects, these users are recruited separately from the previous experiment.” 62
  58. Interference • Within-subject studies • Diminished performance in second task

    • Confusing functionalities • Randomization or Counterbalancing • Between-subjects user study • Example: Related Worksheets 63
  59. Related Worksheets (Eirik Bakke, David R. Karger, and Robert C.

    Miller, CHI 2011) • Random Split into two groups • “The subjects were divided randomly into two groups of 26 subjects each, and invited to participate in the main part of the study. Of these, 18 recruits from the Excel group and 18 recruits from the Related Worksheets group completed the main task.” • Same task • “The tasks and instructions in the two main forms were identical except in the description of the tool used to solve the tasks.” 64
  60. Fatigue • Long tasks can lead to users performing poorly

    towards the end • Tasks need to be broken into small chunks • Breaks in between • Example: SIEUFERD (Eirik Bakke, David R. Karger, SIGMOD 2016) • Usability survey in between 20 min tasks 65
  61. Biases 66 • 100+ cognitive biases • Participants: • Social

    desirability bias: Users tell you what you want to hear • Anchoring bias: Preference for first item seen • Researcher: • Framing effect: Do not ask leading questions • Selection bias: Choosing non-random study population
  62. A Framework for Studying Biases in Visualization Research (Andre Calero

    Valdez , Martina Ziefle, Michael Sedlmair, DECISIVe 2017) • Need to understand biases • “carefully studying low-level perceptual and action biases will make up for a good underpinning, not only for better understanding highlevel phenomena eventually, but also as a way to better understand decision making with visualization in general.” • Transparency • “Good practice such as reproducibility through publishing all data, codes and experimental setup, using confidence intervals to allow for meta-analysis, and reporting negative findings will be essential in this process.” • Counteracting biases: • “how far is it valid to correct for these biases? Challenging current views , should a visualization “lie” to counteract biases and improve decision making? While for perceptual biases the answer might be quite clear, what about higherlevel biases? Should the visualization decide what is in the best interest of the user? For example, may a visualization override the users preference to not know unpleasant information and counteract the ostrich effect?” 67
  63. Outline • Salient Features / Challenges in Evaluation • Guidelines

    (large-scale survey of related work) • Metrics • Biases • Case Studies • Inertial Scroll • Filter and Map • Crossfiltering • Open Problems 68
  64. Outline • Salient Features / Challenges in Evaluation • Guidelines

    (large-scale survey of related work) • Metrics • Biases • Case Studies • Inertial Scroll • Filter and Map • Crossfiltering • Open Problems 69
  65. Case Study Design Philosophy • Capture common scenarios for interfaces

    and devices • Interfaces: map, slider, etc. • Devices: mouse, touch, gestural, etc. • Maximize coverage of query types and interaction techniques • Query types: select, join, etc. • Interaction techniques: zoom, linking & brushing, etc. • Enough variations for workloads • Data size, data shape, etc. 70
  66. Workloads Overview 71 workloads inertial scrolling crossfiltering filter and map

    device touch(trackpad) mouse, touch(iPad), gesture(Leap Motion) mouse query interfaces scroll slider slider, map, textbox, checkbox interaction techniques browsing linking & brushing filtering & navigation trace {timestamp, scrollTop, scrollNum, delta} {timestamp, minVal, maxVal, sliderIdx} {timestamp, tabURL, requestId, resourceType, type, status} query select, join count aggregation select, join
  67. Outline • Salient Features / Challenges in Evaluation • Guidelines

    (large-scale survey of related work) • Metrics • Biases • Case Studies • Inertial Scroll • Filter and Map • Crossfiltering • Open Problems 72
  68. Inertial Scrolling • acceleration: help the user scroll smoothly •

    widely adopted in mobile devices, touchpads, trackpads, etc. 73
  69. Implementing Inertial Scroll • Lazy load • Expensive / impossible

    to load full dataset • As extent is about to come into view, fetch from server • SELECT title, year, … FROM imdb LIMIT 100 OFFSET 60 74
  70. Overwhelmed Database! • New workload: Exponential queries Issued • Query

    Scheduling • Which one to serve first? • Too fast = user discards result anyway • Query Execution • Do we need 100% accurate results? 75
  71. Inertial Scrolling Experiments • Goal: Understand impact of scrolling behavior

    on DB • Asked 15 users to skim IMDB movie records, select interesting movies • Record scroll / wheel events, track timestamp, and scrollTop (and pixel delta), number of tuples scrolled SELECT title, year, … FROM imdb LIMIT 100 OFFSET 60 76
  72. Inertial Scrolling: Scrolling speeds 77 • User scrolls much larger

    extents with inertial • y-axis : 400 vs 4 • Lazy load is not practical: either too little or too wasteful • User often reaches end of page before items are loaded = UI is blocked 0 5000 10000 Timestamp (ms) 0 2 4 Wheel Delta Inertial Non-inertial
  73. Inertial Scrolling: Scroll Speed 78 0 1 2 3 4

    5 6 7 8 9 10 11 12 13 14 User 0 50 100 150 200 Count movies selected backscrolled selections • (left) Some users scroll more wildly than others – non- uniform audience • (right) Number of backscrolls > number of movies selected • Users forget / overshoot and then return to revisit
  74. Inertial Scrolling: Performance • Lazy loading strategies • Naïve: fetch

    when tuple placeholder is in view • Blocking operation, user waits • Event: at each scroll event, check cache, prefetch • Computationally expensive • Timer: prefetch every n milliseconds • Need to tune parameter based on usage 79
  75. Inertial Scrolling: Latency 80 • Average latency, vary # tuples

    fetched • Event fetch: insensitive to # tuples fetched • Timer fetch: ~60 seconds when # tuples is low, fast when # tuples is high
  76. Outline • Salient Features / Challenges in Evaluation • Guidelines

    (large-scale survey of related work) • Metrics • Biases • Case Studies • Inertial Scroll • Brushing and Linking with Maps • Crossfiltering • Open Problems 81
  77. Outline • Salient Features / Challenges in Evaluation • Guidelines

    (large-scale survey of related work) • Metrics • Biases • Case Studies • Inertial Scroll • Filter and Map • Crossfiltering • Open Problems 82
  78. Filter and Map • Interfaces • map • slider •

    Guidelines: • parameters • benchmark 83
  79. Filter and Map: Behavior • Study users browsing on AirBnB

    • Find short-term housing • At least 20 mins • Look at • Query Actions • Map Zoom Behavior • Map Dragging Behavior 84
  80. Filter and Map: Query Actions 85 0.00% 10.00% 20.00% 30.00%

    40.00% 50.00% 60.00% 70.00% Map Slider, Checkbox Button Text Box • Unsurprisingly, map interactions are a very popular way for query refinement
  81. Filter and Map: Map Zoom Behavior 86 • Most users

    converge at zoom levels 11—13 • Change in zoom levels is at most 3 • Insight can be used to prefetch / precompute
  82. Filter and Map: Map Dragging (Panning) Behavior 87 • At

    deeper levels, users move smaller distances (confirming intuition) • Can be used to prefetch / create ideal tile resolutions
  83. Filter and Map: Performance 88 • 70% queries = 4

    filter conditions • Precompute at least ~ C(n,4) * 2^4 • Request time is much lower than exploration time • Good case for building a prefetching layer
  84. Outline • Salient Features / Challenges in Evaluation • Guidelines

    (large-scale survey of related work) • Metrics • Biases • Case Studies • Inertial Scroll • Filter and Map • Crossfiltering • Open Problems 89
  85. Outline • Salient Features / Challenges in Evaluation • Guidelines

    (large-scale survey of related work) • Metrics • Biases • Case Studies • Inertial Scroll • Filter and Map • Crossfiltering • Open Problems 90
  86. Crossfiltering 91 • Each histogram corresponds one attribute / dimension

    • Histograms for other attributes are updated synchronously while the user is manipulating one slider • Multiple (n – 1) queries are issued at the same time
  87. Crossfiltering: Experimental Setup • Dataset: 3D road network dataset (three

    attributes: longitude, latitude, height; 434,874 tuples) • Configuration: PostgreSQL vs MemSQL on Linux Machine • Task & Users: 30 Traces from SnapToQuery • Trace: timestamp, range values, slider idx • Query: Multiple histogram queries 95
  88. Crossfiltering: Behavior • Sliding Behavior • Traces for three devices

    • Querying Behavior • Two behavior-driven optimizations • Performance metrics 96 0 0 10 10,000 20,000 20 30 40 50 0 100 150 200 300 350 15,000 30,000 250 0 12,500 25,000 50 55 60 65 70 75 Range: 0 - 50 Range: 50 - 70 Range: 150 - 300
  89. Crossfiltering: Sliding Behavior 97 mouse touch Leap Motion Leap Motion

    presents more jitter than the mouse and touch.
  90. Crossfiltering: Optimizations • Interface-driven (skip): skip queries already skipped by

    frontend • Result-driven (KL>0 or KL > 0.2): skip queries whose result is same or similar • Both ideas are areas of future inquiry • (aka please steal these ideas and write papers on them!) 98
  91. Crossfiltering: Performance • Metrics • Query Issuing Frequency • Query

    Reduction • Latency • Latency Constraint Violation • Factors: databases (PostgreSQL, MemSQL), devices (mouse, touch, Leap Motion), and optimization methods (raw, KL>0, KL>0.2, skip) 99
  92. Crossfiltering: Query Issuing Frequency 100 • number of queries issued

    by Leap Motion is much larger than mouse and touch (y-axis scale: 2500 vs 120) • drastically reduce the number of queries when issuing queries with result-driven (KL > 0 and KL > 0.2) • even when issuing queries selectively, the dominant query issuing interval varies little, especially for Leap Motion. Frequencies of Leap Motion concentrate at 20ms - 25ms, for the mouse and touch, the shape of the bell is broader
  93. Crossfiltering: Latency 101 Ø MemSQL can maintain a latency 10–50ms.

    After some optimization (KL=0.2 or skip), PostgreSQL can maintain a latency 100–1000ms (sub-second). Ø Leap Motion has more dense workload than the mouse and touch.
  94. Crossfiltering: Query Reduction 102 Ø For the skip strategy, the

    percentage depends more on the database type than device type Ø While for the result strategy (KL>0 and KL>0.2), the percentage depends more on the device than the database type
  95. Latency Constraint Violations • Current Approach: Min / Max /

    Average Latency • Problem: Does not capture full picture, especially in complex UIs / session-based analysis • Solution: Measure Latency Constraint Violations 103
  96. Crossfiltering: Querying Behavior 106 Execution Time Execution Delay Database Issuing

    User Issuing Q1 Q2 Q3 Q4 Latency Interval Get Result Timestamp Observation 1: Ø Q1, Q2, Q3, Q4 are issued one after another Ø Query issuing frequency
  97. Crossfiltering: Querying Behavior 107 Execution Time Execution Delay Database Issuing

    User Issuing Q1 Q2 Q3 Q4 Latency Interval Get Result Timestamp Observation 2: Ø Execution delay will become larger and larger Ø Latency & latency constraint violation
  98. Crossfiltering: Adjacent Queries 108 Execution Time Execution Delay Database Issuing

    User Issuing Q1 Q2 Q3 Q4 Latency Interval Get Result Timestamp Observation 3: Ø Adjacent queries: same, identical, similar Ø Result-driven: skip Q2, Q3, run Q4
  99. Crossfiltering: Skipped Queries 109 Execution Time Execution Delay Database Issuing

    User Issuing Q1 Q2 Q3 Q4 Latency Interval Get Result Timestamp Observation 4: Ø Queries are already skipped in frontend Ø Interface-driven: skip Q2, Q3, run Q4
  100. Crossfiltering: Latency Constraint Violation 110 Ø Fewer queries violate latency

    constraint for MemSQL than PostgreSQL. Ø For MemSQL, when we issue queries with KL>0, we can reduce about half of violated queries. Ø For PostgreSQL, when we issue queries with KL>0.2, the decrease for the mouse and touch is about 30% while for the leap motion is 17%.
  101. Outline • Salient Features / Challenges in Evaluation • Guidelines

    (large-scale survey of related work) • Metrics • Biases • Case Studies • Inertial Scroll • Filter and Map • Crossfiltering • Open Problems 111
  102. Recap • Salient Features / Challenges in Evaluation • Guidelines

    (large-scale survey of related work) • Metrics • Biases • Case Studies • Inertial Scroll • Filter and Map • Crossfiltering • New Metrics • Latency Constraint Violations • QIF 112
  103. Outline • Salient Features / Challenges in Evaluation • Guidelines

    (large-scale survey of related work) • Metrics • Biases • Case Studies • Inertial Scroll • Filter and Map • Crossfiltering • Open Problems 113
  104. Open Problem: Multimodal UIs • How to optimally combine speech

    + gestures + keyboard + ______ ? • Mixed-initiative interfaces • How do we measure performance across all interfaces? Response-time Simple Rich Slow Vocabulary Speech Touch Fast The perfect interface
  105. Recognizing Human Limits • Context: • Interactive Visualizations • Intuition:

    • If you can’t tell the difference, why compute it? • Approach: • Measure human limitations in perception Mturk study (derive perceptual functions) • Push perceptual functions down to DB for optimizations • “Approximate User” for evaluations Interaction session JSON DBMS Visualization System InterVis Queries, Perceptual funcs Result set Perceptual Execution Network Interaction Pixels Frontend Backend DSIA@VIS 2015 w/ Eugene Wu Open Problems: VLDB 2017 w/Joe Hellerstein
  106. Outline • Introduction • Guidelines • Salient Features • Metrics

    • Biases • Case Studies • Inertial Scroll • Filter and Map • Crossfiltering • Open Problems • Conclusion 117
  107. Conclusion • Salient Features in Interactive Data Systems • Very

    important to model user interaction in both system design and evaluation! • Guidelines (large-scale survey of related work) • Metrics (new metrics) • Biases • Case Studies, Behavioral Analysis, Optimizations • Inertial Scroll • Brushing and Linking with Maps • Crossfiltering • Open Problems 118