of code on a Sinclair ZX80 in 1984. Over the years, he has been programming in C/C++, Java and C#, and also did quite some database development. Today he is Development Lead at Dynatrace (APM vendor).
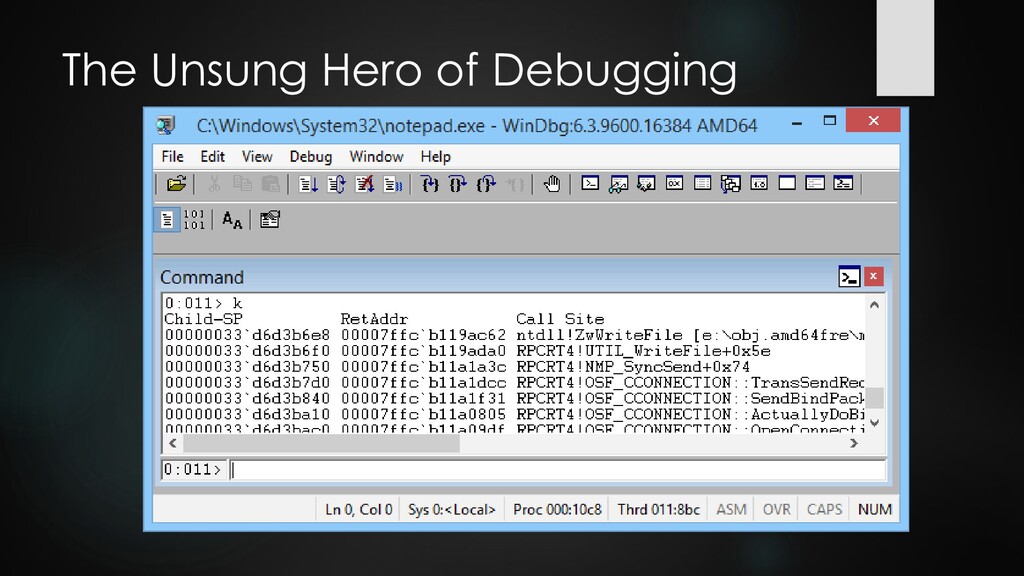
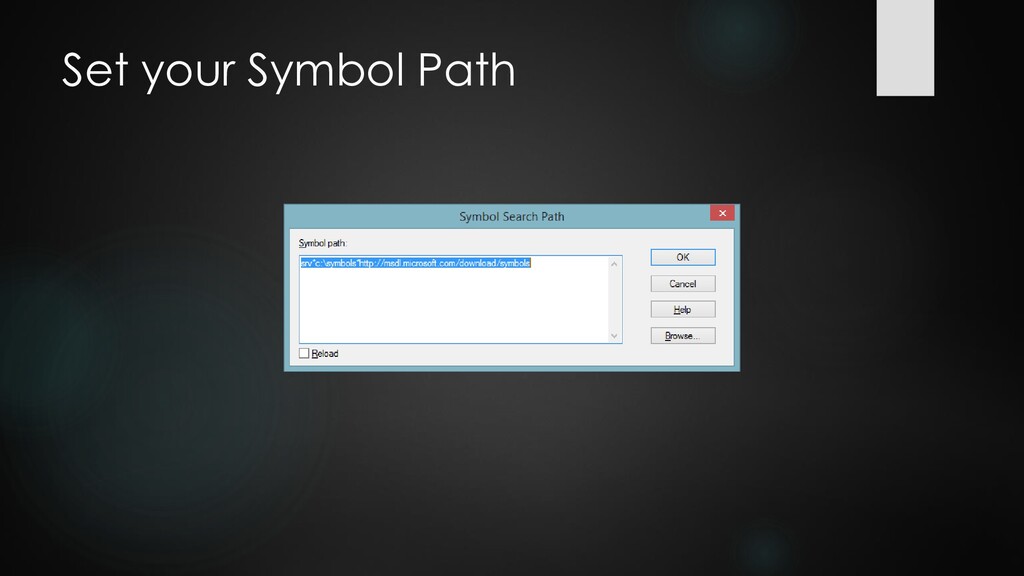
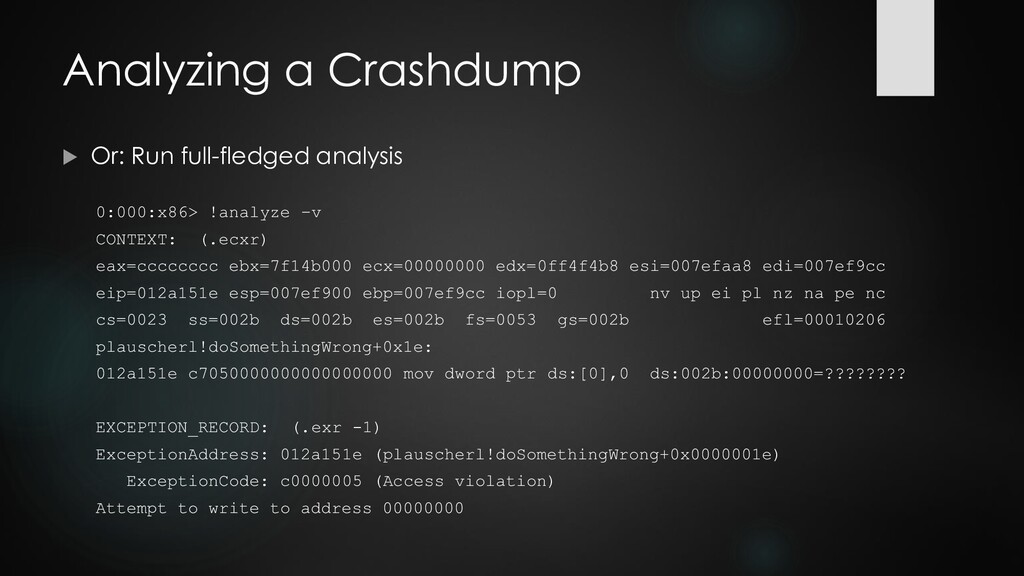
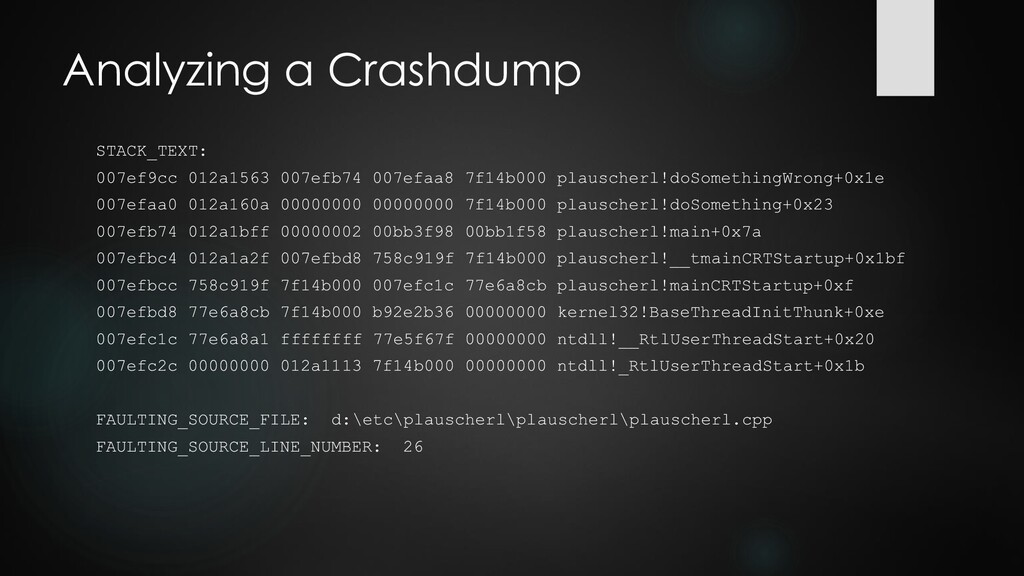
Easier to use Sufficient for many debugging problems Also supports remote, kernel and post-mortem debugging WinDbg helps on the really tough cases (and most interesting ones) For example, one might just have a function offset from an eventlog entry (no symbols), or some bytes from the stack, or a dump from an old binary without symbols, or... Problem might be not reproducible and only happening in production in border case scenario, or at Windows startup, in a driver, etc. WinDbg is well suited for post-mortem, can also connect over RS232, USB. Lightweight installation, WinDbg even runs from USB stick. WinDbg Extensions and Scripts provide powerful means, e.g. to analyze heap corruption, etc.
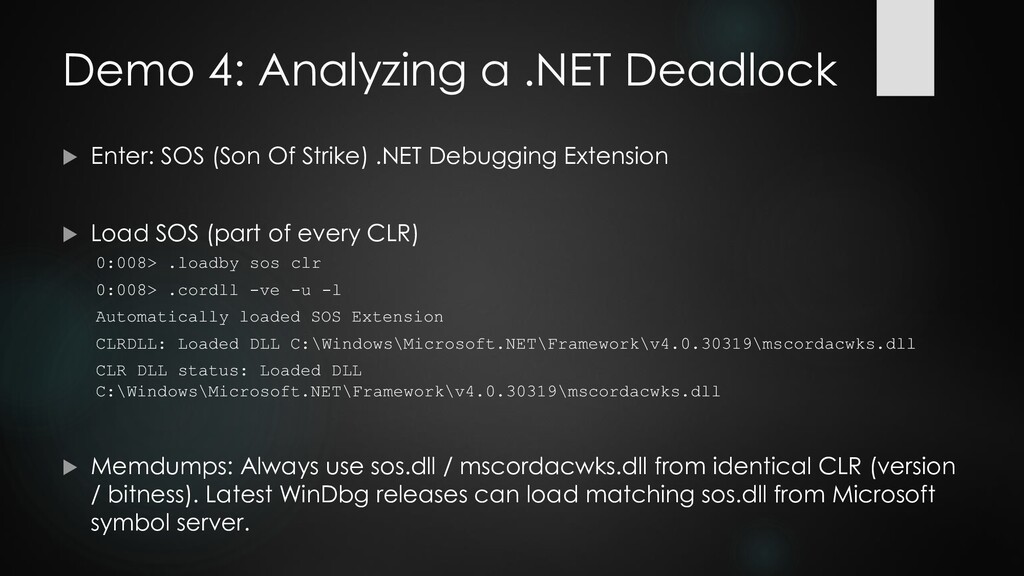
Of Strike) .NET Debugging Extension Load SOS (part of every CLR) 0:008> .loadby sos clr 0:008> .cordll -ve -u -l Automatically loaded SOS Extension CLRDLL: Loaded DLL C:\Windows\Microsoft.NET\Framework\v4.0.30319\mscordacwks.dll CLR DLL status: Loaded DLL C:\Windows\Microsoft.NET\Framework\v4.0.30319\mscordacwks.dll Memdumps: Always use sos.dll / mscordacwks.dll from identical CLR (version / bitness). Latest WinDbg releases can load matching sos.dll from Microsoft symbol server.
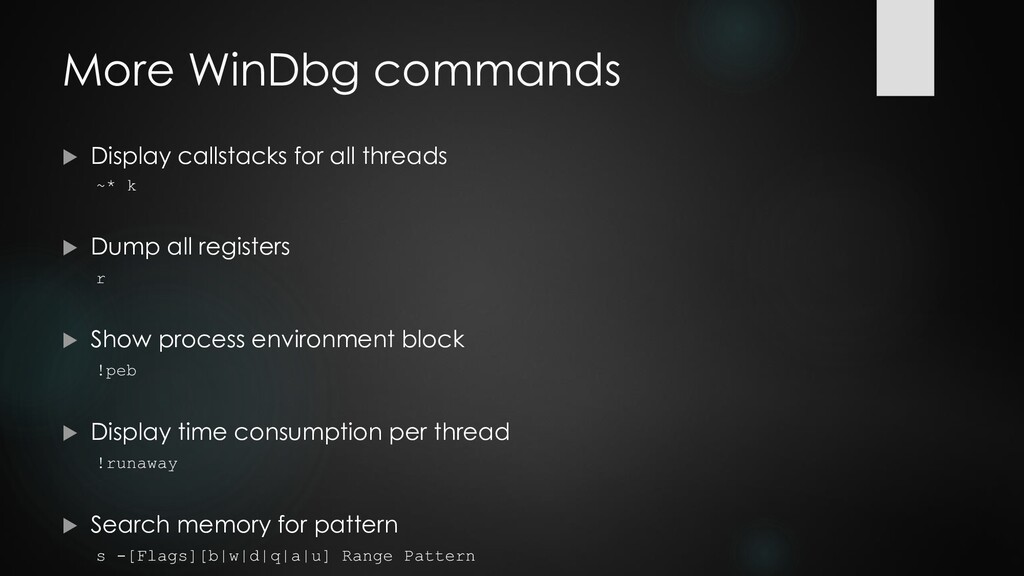
k Dump all registers r Show process environment block !peb Display time consumption per thread !runaway Search memory for pattern s -[Flags][b|w|d|q|a|u] Range Pattern
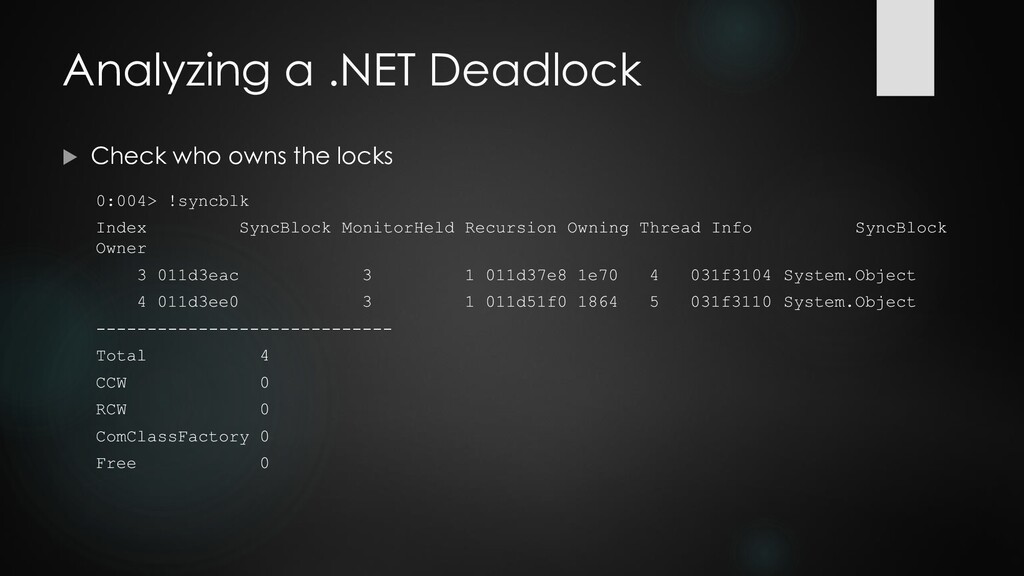
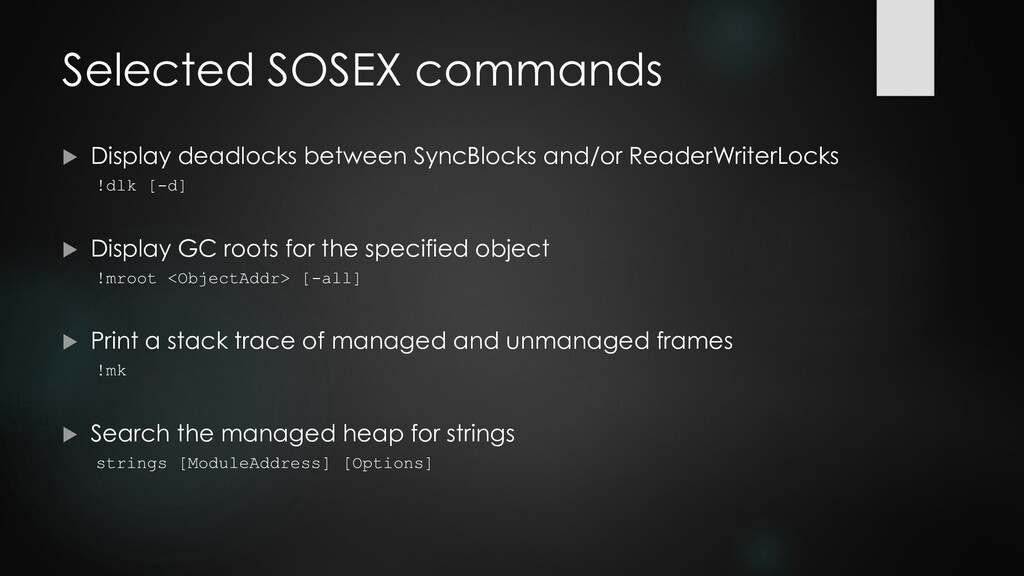
!dlk [-d] Display GC roots for the specified object !mroot <ObjectAddr> [-all] Print a stack trace of managed and unmanaged frames !mk Search the managed heap for strings strings [ModuleAddress] [Options]
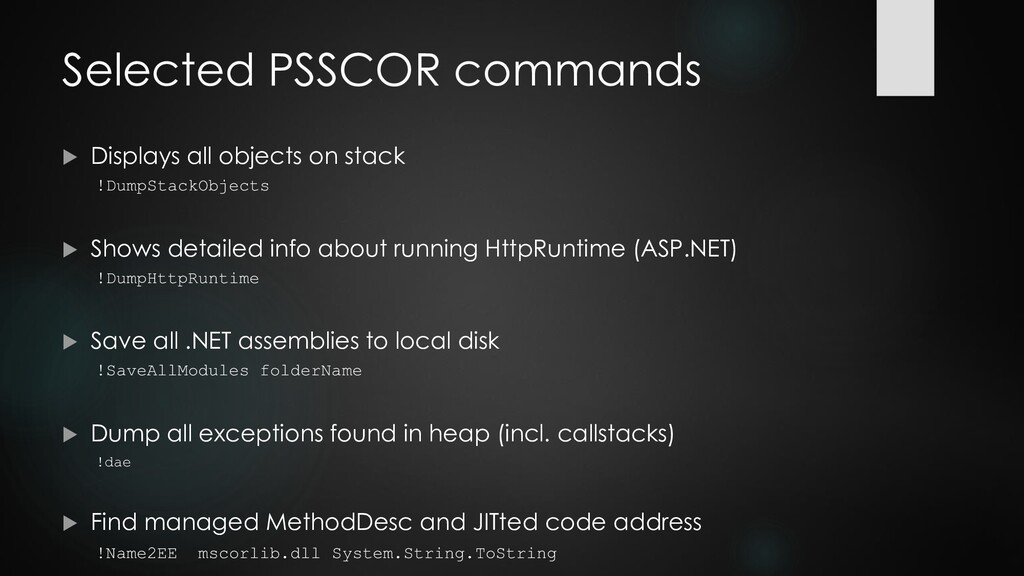
Shows detailed info about running HttpRuntime (ASP.NET) !DumpHttpRuntime Save all .NET assemblies to local disk !SaveAllModules folderName Dump all exceptions found in heap (incl. callstacks) !dae Find managed MethodDesc and JITted code address !Name2EE mscorlib.dll System.String.ToString
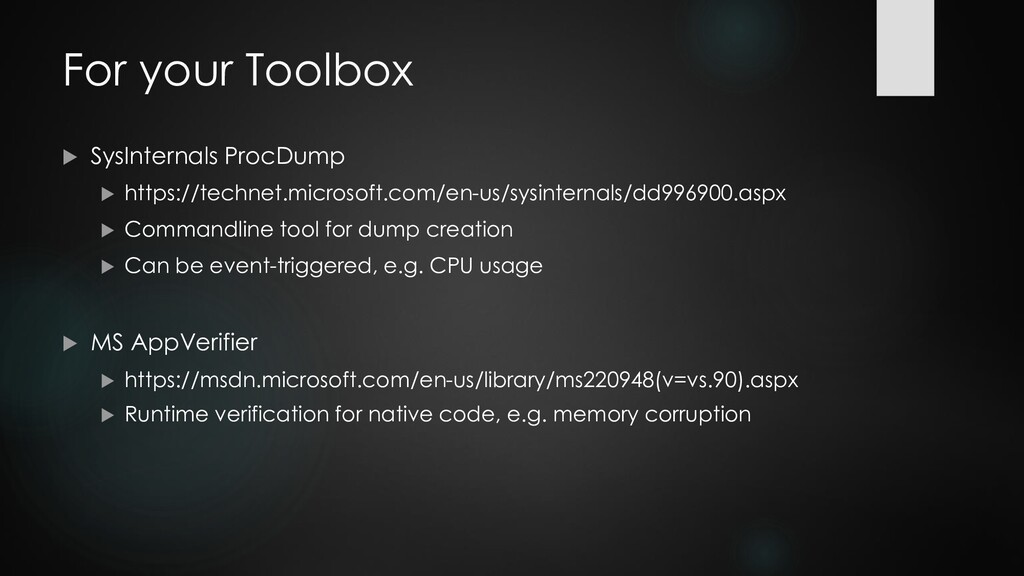
tool for dump creation Can be event-triggered, e.g. CPU usage MS AppVerifier https://msdn.microsoft.com/en-us/library/ms220948(v=vs.90).aspx Runtime verification for native code, e.g. memory corruption
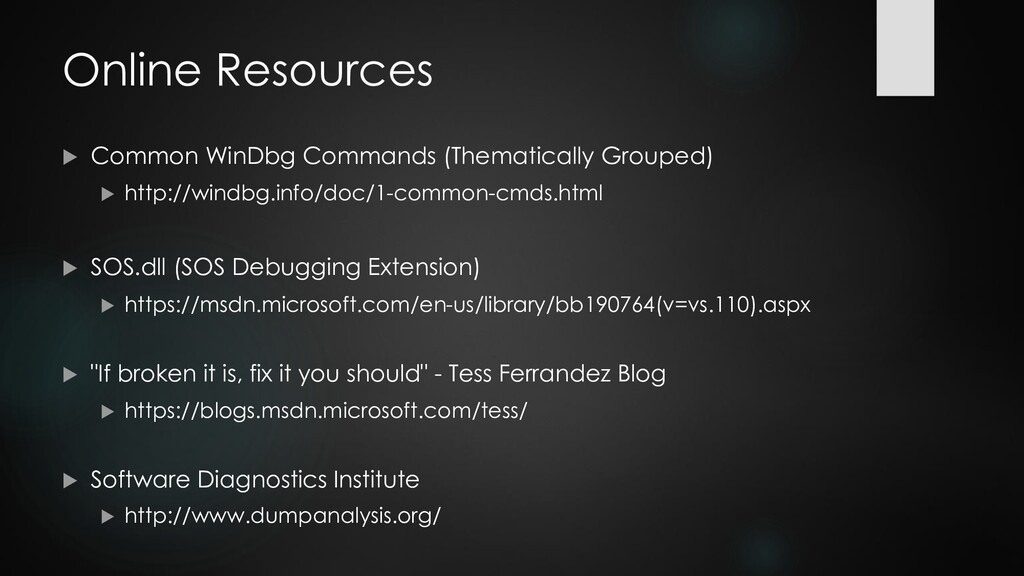
SOS.dll (SOS Debugging Extension) https://msdn.microsoft.com/en-us/library/bb190764(v=vs.110).aspx "If broken it is, fix it you should" - Tess Ferrandez Blog https://blogs.msdn.microsoft.com/tess/ Software Diagnostics Institute http://www.dumpanalysis.org/
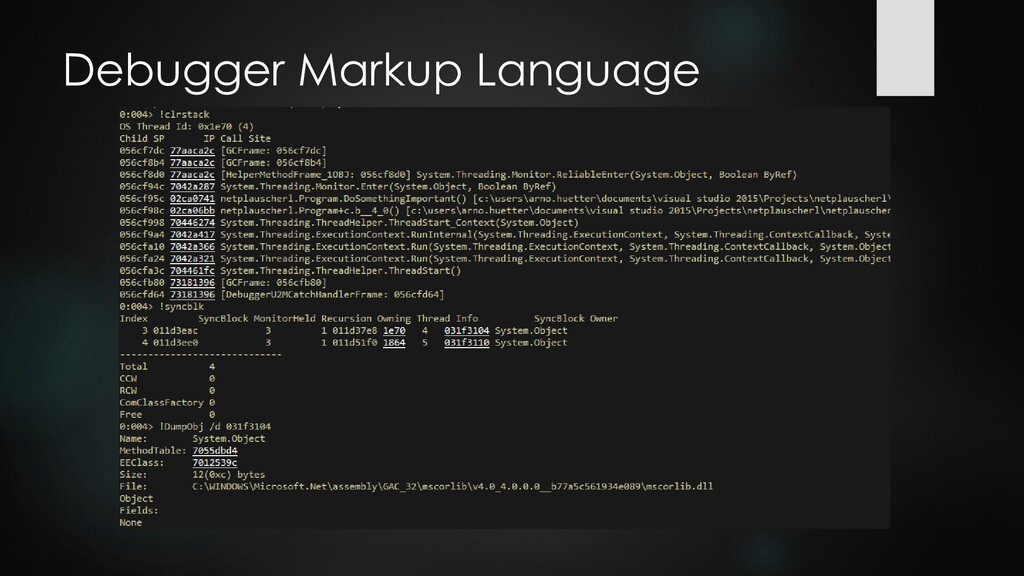
![Selected SOS commands Display managed callstack !CLRStack [-a] [-l]](https://files.speakerdeck.com/presentations/078d67ed12724006ab84949543daac51/slide_25.jpg)