Upgrade to Pro — share decks privately, control downloads, hide ads and more …

On the Benefits of Planning and Grouping Software Maintenance Requests (CSMR 2011)

On the Benefits of Planning and Grouping Software Maintenance Requests (CSMR 2011)

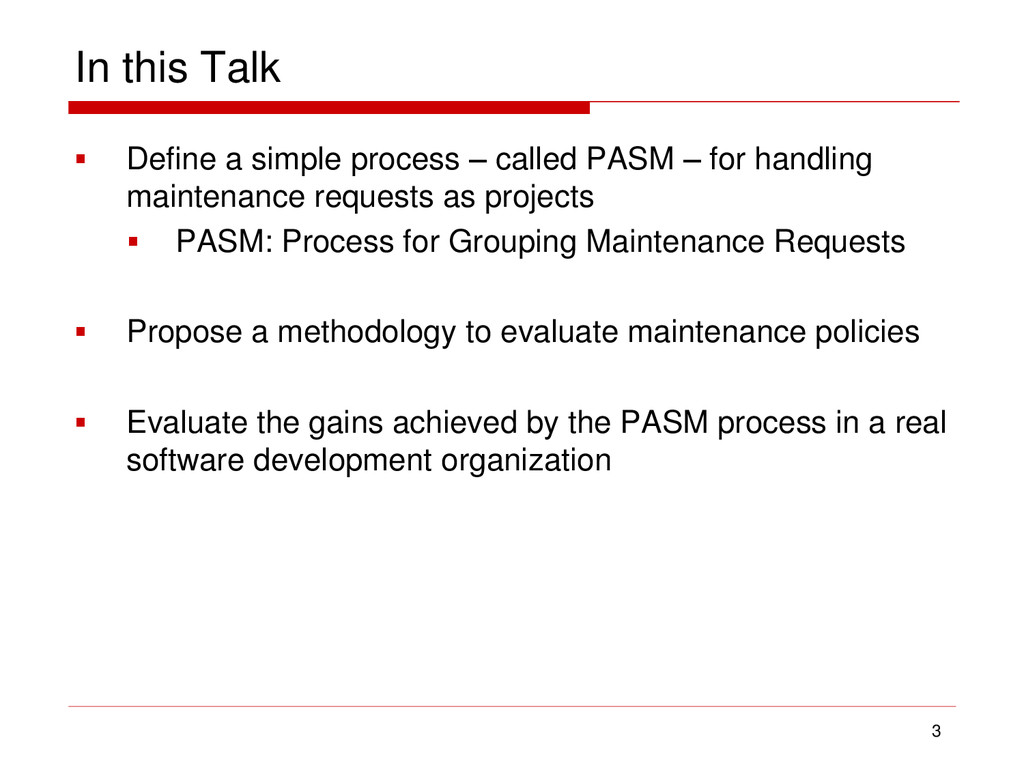
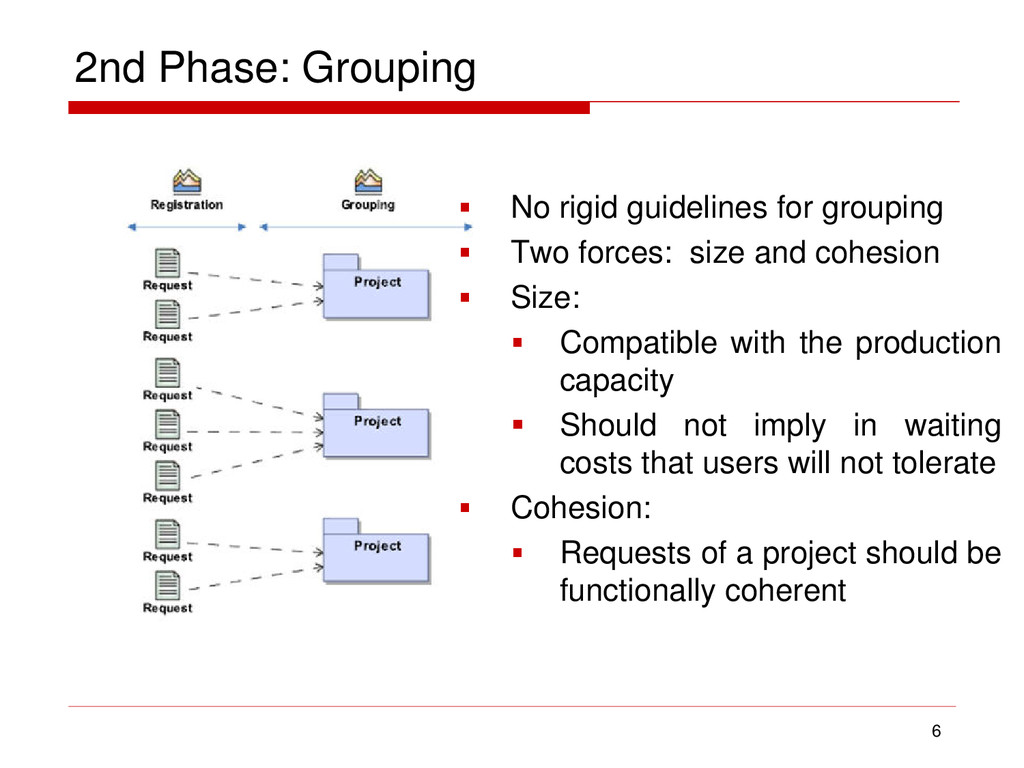
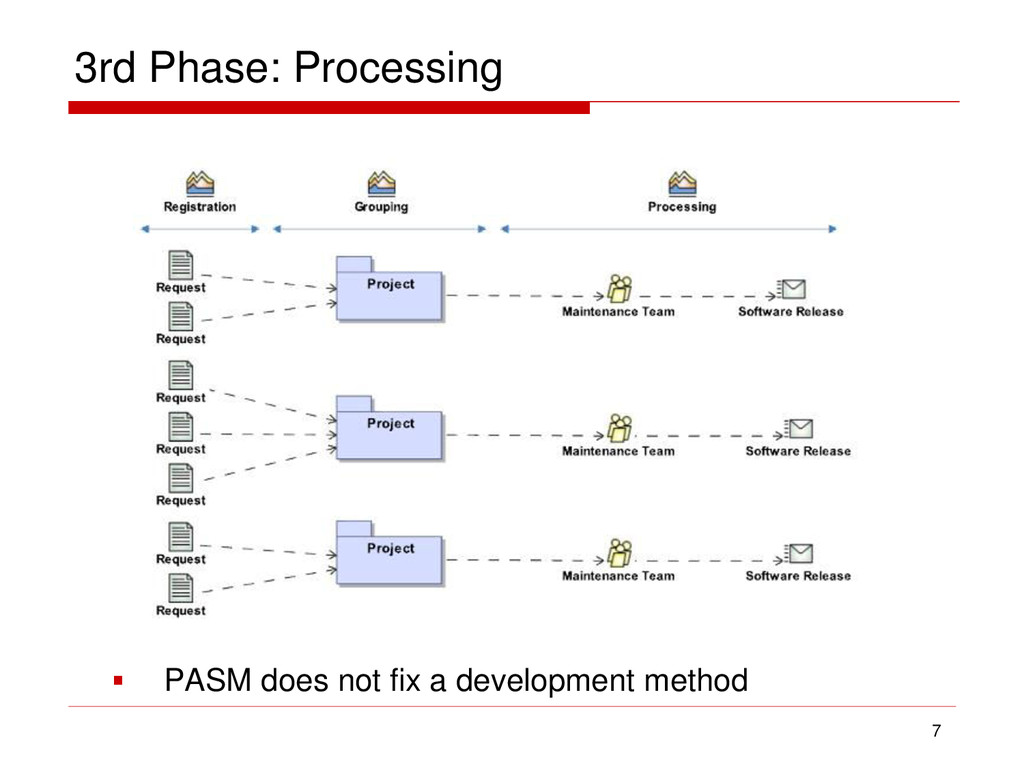
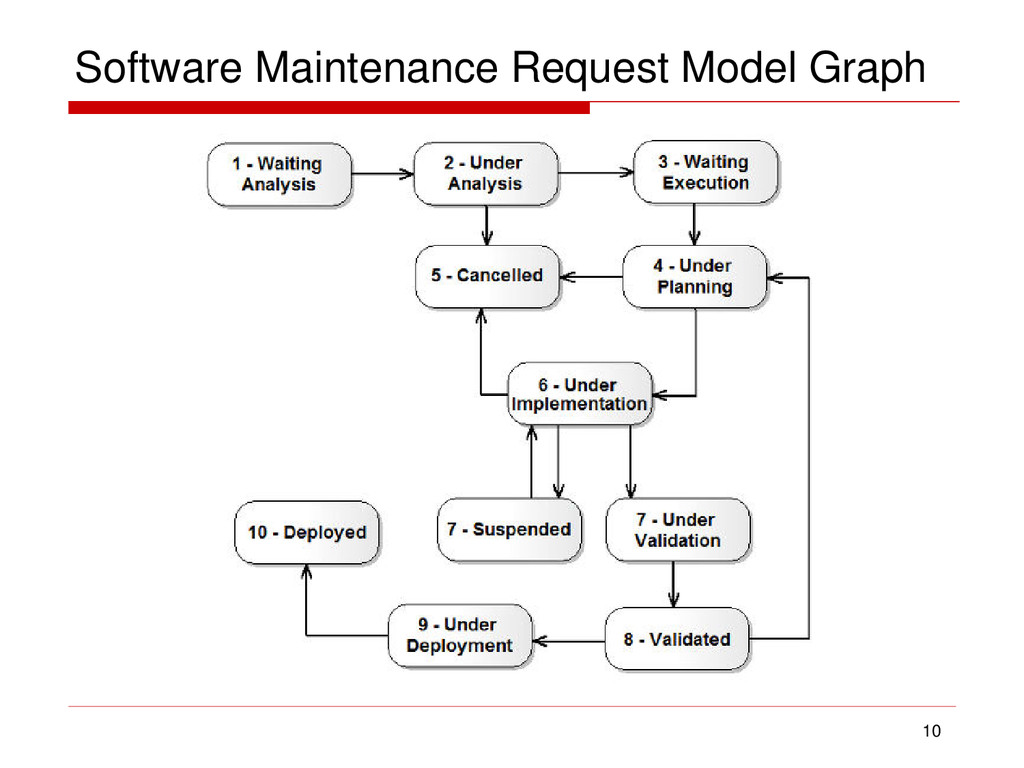
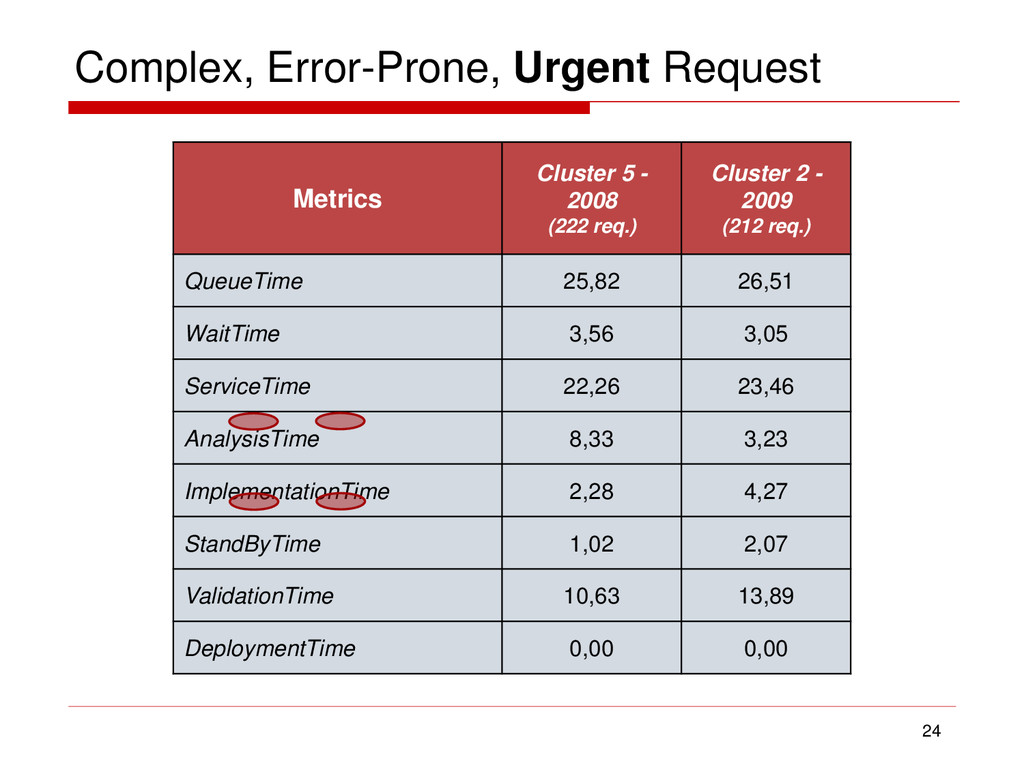
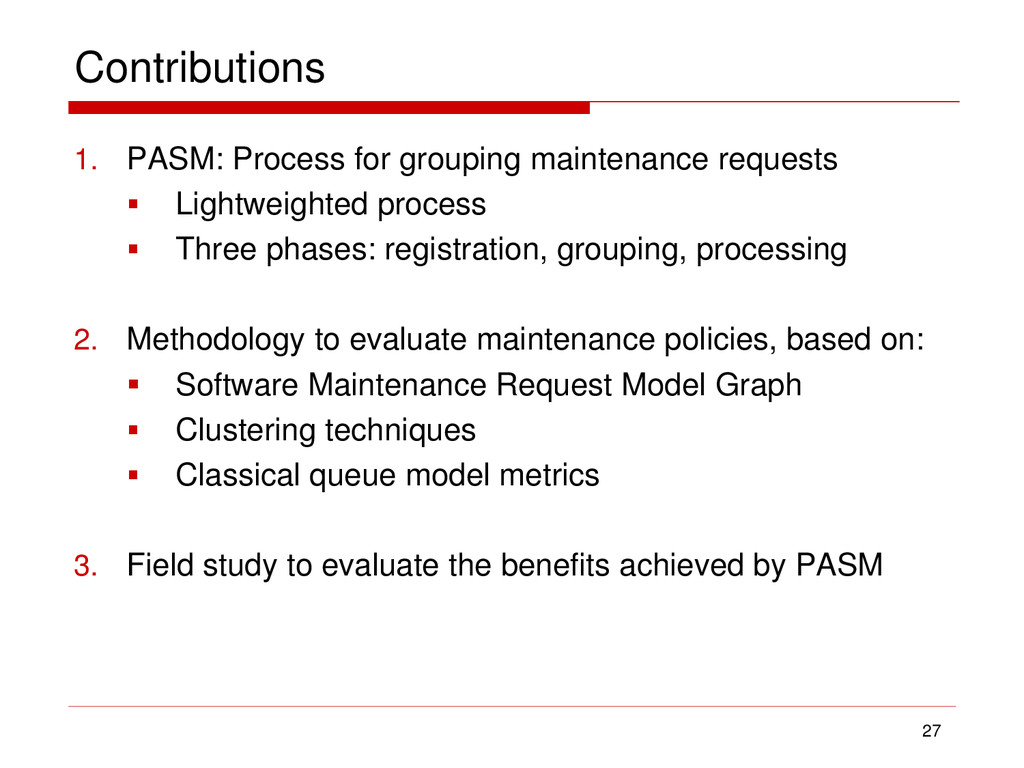
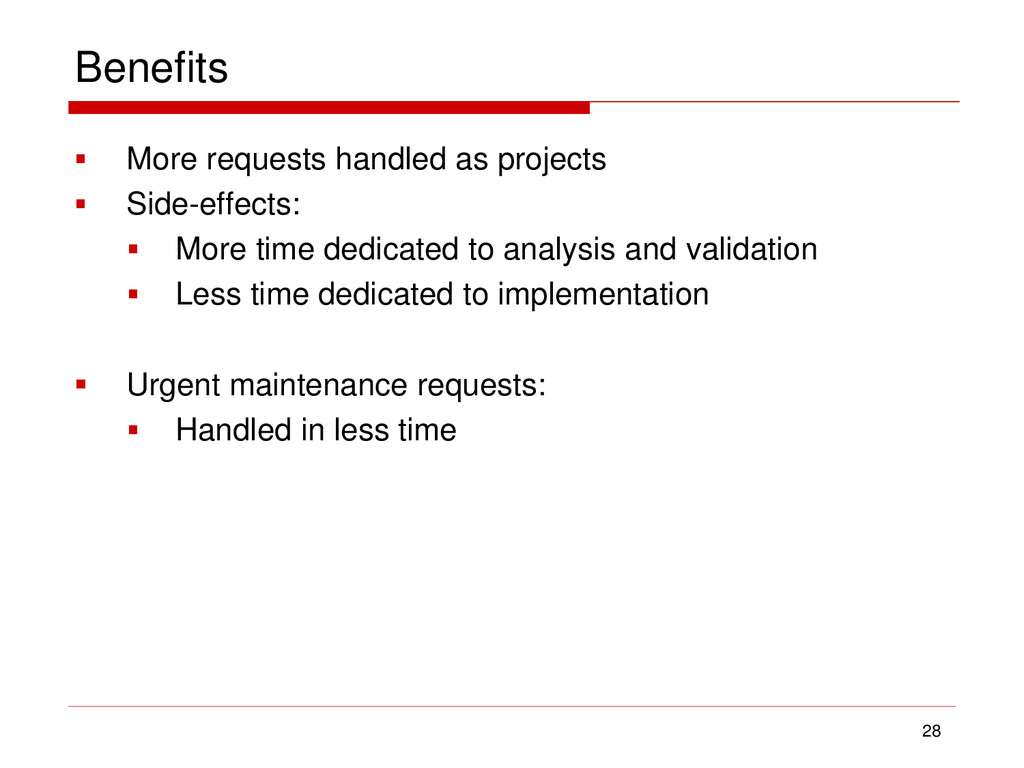
Despite its unquestionable importance, software maintenance usually has a negative image among software developers and even project managers. As a result, it is common to consider maintenance requests as short-term tasks that should be implemented as quick as possible to have a minimal impact for end-users. In order to promote software maintenance to a first-class software development activity, we first define in this paper a lightweighted process – called PASM (Process for Arranging Software Maintenance Requests) – for handling maintenance as software projects. Next, we describe an in-depth evaluation of the benefits achieved by the PASM process at a real software development organization. For this purpose, we rely on a set of clustering analysis techniques in order to better understand and compare the requests handled before and after the adoption of the proposed process. Our results indicate that the number of projects created to handle maintenance requests has increased almost three times after this organzation has adopted the PASM process. Furthermore, we also concluded that projects based on the PASM present a better balance between the various software engineering activities. For example, after adopting PASM the developers have dedicated more time to analysis and validation and less time to implementation and codification tasks.

ASERG, DCC, UFMG

March 02, 2011
Tweet

More Decks by ASERG, DCC, UFMG

Other Decks in Research

Transcript

  1. On the Benefits of Planning and Grouping Software Maintenance Requests

    CSMR – Oldenburg, Germany, March 2011 Gladston Aparecido Junio (PUC Minas, Brazil) Marcelo Malta (PUC Minas, Brazil) Humberto Mossri (PUC Minas, Brazil) Humberto Marques-Neto (PUC Minas, Brazil) Marco Tulio Valente (UFMG, Brazil)
  2. Motivation  Policies for scheduling maintenance requests:  Continuous: requests

    implemented as quick as possible  Periodic: requests packaged in larger projects  In theory, the benefits of periodic policies are widely known  Several statistical models have been proposed  Example: Banker et. al (+30% of cost reduction)  Do such gains happen in real organizations?  Theoretical models have not been validated by field studies 2
  3. In this Talk  Define a simple process – called

    PASM – for handling maintenance requests as projects  PASM: Process for Grouping Maintenance Requests  Propose a methodology to evaluate maintenance policies  Evaluate the gains achieved by the PASM process in a real software development organization 3
  4. 1st Phase: Registration 5  Pre-defined time frame for registration

     Typical requests are buffered  Users can specify that a request is urgent  If ratified by the process manager:  Request goes directly to implementation  No waiting-costs
  5. 2nd Phase: Grouping 6  No rigid guidelines for grouping

     Two forces: size and cohesion  Size:  Compatible with the production capacity  Should not imply in waiting costs that users will not tolerate  Cohesion:  Requests of a project should be functionally coherent
  6. Characterization Methodology  How to evaluate the gains achieved by

    PASM in a real setting?  Adapted a methodology proposed to understand the behavior of web users  Central idea: Software Maintenance Request Model Graph  Nodes: states of each request  Edges: transition between such states 9
  7. Metrics  QueueTime = WaitTime + ServiceTime  Service Time

    = PlanningTime + AnalysisTime + ImplementationTime + ValidationTime + DeploymentTime 11
  8. Methodology 1. Classify the requests in the following groups: 

    Before PASM, Urgent  Before PASM, Project  After PASM, Urgent  After PASM, Project 2. For each request in each of the previous groups  Generate the SMRMG  Generate a vector with the previous metrics 3. For the vectors in each group  Apply a clustering algorithm (k-means) 12
  9. Goal with Clustering 1. Discover the characteristics of the typical

    projects  Before PASM  After PASM 2. Evaluate the positive and negative effects of the PASM adoption on such projects 3. Discover the characteristics of typical urgent requests  Before PASM  After PASM 4. Evaluate the positive and negative effects of the PASM adoption on such requests 13
  10. Evaluation  We have evaluated the PASM process at DATAPUC

     DATAPUC: IT Department of PUC Minas  34 developers  40 systems, 4 MLOC  Until October 2008:  (most) maintenance requests handled on demand, in a continuous way.  Starting on November 2008:  DATAPUC has moved to the PASM process 14
  11. PASM @ DATAPUC  Registering Phase: first 10 days of

    each month  Grouping: next 20 days  Requests are evaluated and grouped in projects  Cycle is repeated in the next month 15
  12. Data Source  Same sequence of months:  Before PASM:

    February-October 2008  After PASM: February-October 2009 16 Requests Before PASM (2008) After PASM (2009) Urgents 1051 953 Projects 22 62
  13. Maintenance Projects: Clusters 18 Metrics 2008 2009 Cluster 1 (19

    proj.) Cluster 2 (3 proj.) Cluster 1 (52 proj.) Cluster 2 (10 proj.) QueueTime 185,00 771,87 245,04 694,91 WaitTime 12,16 17,50 26,85 11,95 ServiceTime 172,84 754,37 218,19 682,97 AnalysisTime 31,51 7,48 48,71 141,61 PlanningTime 6,34 5,02 3,66 64,61 ImplementationTime 74,63 348,27 50,39 122,56 StandByTime 0,00 0,00 0,20 0,00 ValidationTime 39,34 377,46 94,19 249,70 DeploymentTime 21,01 16,14 21,04 104,49  QueueTime: + 32%
  14. Maintenance Projects: Summary  More projects:  Before PASM: 22

    projects  After PASM: 62 projects  Dominant development task:  Before PASM: implementation (43%)  After PASM: validation (43%) 20
  15. Typical Urgent Requests 23 Metrics Cluster 2 - 2008 (651

    req) Cluster 5 - 2009 (383 req) QueueTime 16,79 12,82 WaitTime 2,80 3,22 ServiceTime 13,98 9,60 AnalysisTime 4,46 2,45 ImplementationTime 7,02 3,94 StandByTime 2,50 3,21 ValidationTime 0,00 0,00 DeploymentTime 0,00 0,00
  16. Complex, Error-Prone, Urgent Request 24 Metrics Cluster 5 - 2008

    (222 req.) Cluster 2 - 2009 (212 req.) QueueTime 25,82 26,51 WaitTime 3,56 3,05 ServiceTime 22,26 23,46 AnalysisTime 8,33 3,23 ImplementationTime 2,28 4,27 StandByTime 1,02 2,07 ValidationTime 10,63 13,89 DeploymentTime 0,00 0,00
  17. Urgent Requests: Summary  QueueTime, after PASM:  Typical requests:

    - 4 hours  Complex requests: + 1 hour (more time to validation) 25
  18. Contributions 1. PASM: Process for grouping maintenance requests  Lightweighted

    process  Three phases: registration, grouping, processing 2. Methodology to evaluate maintenance policies, based on:  Software Maintenance Request Model Graph  Clustering techniques  Classical queue model metrics 3. Field study to evaluate the benefits achieved by PASM 27
  19. Benefits  More requests handled as projects  Side-effects: 

    More time dedicated to analysis and validation  Less time dedicated to implementation  Urgent maintenance requests:  Handled in less time 28
  20. Further Work  Promote and evaluate the PASM’s adoption by

    other organizations  Assess the internal and external quality of the software released under PASM guidelines 29