Upgrade to Pro — share decks privately, control downloads, hide ads and more …

Architectural Metrics for Software Evolvability

Architectural Metrics for Software Evolvability

Presentation in the Distinguished Speaker series at UC Irvine, March 15, 2013. http://avandeursen.wordpress.com/2013/03/09/speaking-in-irvine-on-metrics-and-architecture/

Arie van Deursen

March 15, 2013
Tweet

More Decks by Arie van Deursen

Other Decks in Research

Transcript

  1. 1  
    Are  you  Afraid  of  Change?  
     
    Metrics  for  So7ware  Evolvability  
    Arie  van  Deursen,  Del.  University  of  Technology  
    Joint  work  with  Eric  Bouwers  and  Joost  Visser  (SIG)  
    UC  Irvine,  March  15,  2013                                    @avandeursen  
     

    View Slide

  2. 2  
    View  on  Del7  
    Johannes  Vermeer  
    1662  

    View Slide

  3. 3  
    ©  Pieter  van  Marion  
    2010  
    Photo  Pieter  van  Marion,  2010.  www.facebook.com/pvmphotography  

    View Slide

  4. •  2  mile  tunnel  +  staUon  
    •  4  train  tracks  
    •  Parking  for  100  cars  
    •  1200  new  apartments  
    •  24,000  m2  park  
    •  Parking  for  4000  bikes  
     
    4  
    How  would  you  manage  this  15  year  650M  Euro  project?  

    View Slide

  5. The  TU  Del7  
    So7ware  Engineering  Research  Group  
    Educa:on  
    •  Programming,    
    so7ware  engineering  
    •  MSc,  BSc  projects  
    Research  
    •  So7ware  tesUng  
    •  So7ware  architecture  
    •  Repository  mining  
    •  CollaboraUon  
    •  End-­‐user  programming  
    •  ReacUve  programming  
    •  Language  workbenches  
    5  

    View Slide

  6. SERG  Research  Partners  
    6  

    View Slide

  7. 7  
    www.sig.eu   Collect  detailed  technical  findings  
    about  so7ware-­‐intensive  systems  
    Translate  into  ac.onable  informa.on  
    for  high-­‐level  management  
    Using  methods  from  academic  and  
    self-­‐funded  research  

    View Slide

  8. Today’s  Programme  
    •  Goal:                      
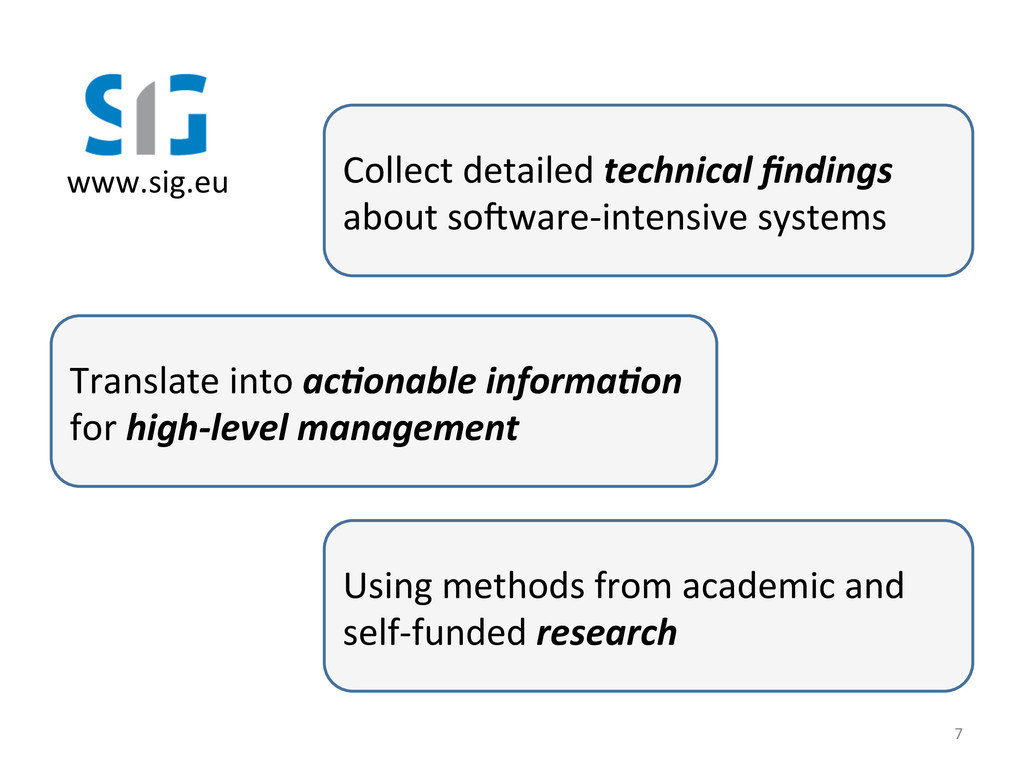
Can  we  measure  so7ware  quality?  
    •  Approach:    How  can  we  evaluate  metrics?  
    •  Research:      Can  we  measure  encapsulaUon?  
    •  Outlook:          What  are  the  implicaUons?  
    8  

    View Slide

  9. Context:  So>ware  Risk  Assessments  
    9  
    ICSM  
    2009  

    View Slide

  10. Early  versus  Late  EvaluaUons  
    •  Today’s  topic:  “Late”  evaluaUons.  
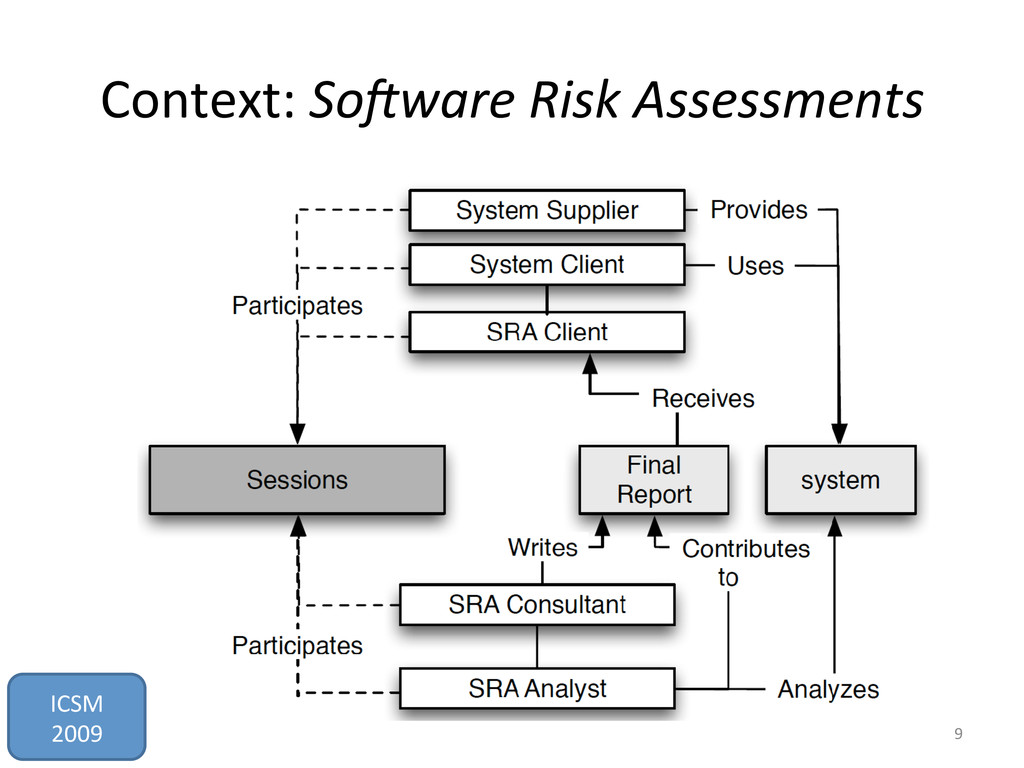
    – Actually  implemented  systems    
    – In  need  of  change  
    •  Out  of  scope  today:  
    – “Early”  evaluaUon  (e.g.,  ATAM)  
    – So7ware  process  (improvement)  
    10  
    van  Deursen,  et  al.  Symphony:  View-­‐Driven  So7ware  Architecture  ReconstrucUon.  WICSA  2004  
    L.  Dobrica  and  E.  Niemela.  A  survey  on  so7ware  architecture  analysis  methods.  TSE  2002  

    View Slide

  11. ISO  So7ware  Quality  CharacterisUcs  
    11  
    Functional Suitability Performance Efficiency Compatibility
    Reliability
    Portability
    Maintainability
    Security
    Usability ISO 25010

    View Slide

  12. So7ware  Metric  
    Pijalls  
    ReflecUons  on  decade  of  
    metric  usage  
    12  
    E.  Bouwers,  J.  Visser,  and    A.  
    van  Deursen.  Gelng  what  
    you  Measure.  CACM,  May  
    2012  

    View Slide

  13. Pijall  1:  TreaUng  the  Metric  
    Metric  values  are  symptoms:  
    It’s  the  root  cause  that  should  be  addressed  
    13  

    View Slide

  14. Pijall  2:  Metric  in  a  Bubble  
    Temporal  /  Trend  
    0.0 0.2 0.4 0.6 0.8 1.0
    Index
    systems$sbo
    1.0 1.1 1.2 1.3 1.4 2.0 2.1 2.2 2.3 2.4 3.0 3.1 3.2 3.3 3.4 3.5 4.0 4.1 4.2 4.3 4.4 5.0 5.1
    SBO
    CSU
    CB
    I II III IV
    Peers  /  Norms  
    Histogram of x$nmodules
    x$nmodules
    Density
    0 5 10 15 20 25 30
    0.00 0.02 0.04 0.06 0.08
    14  
    To  interpret  a  metric,  a  context  is  needed  

    View Slide

  15. Pijall  3:  Metrics  Galore  
    Not  everything  that  can  be  measured    
    needs  to  be  measured  
    15  

    View Slide

  16. Pijall  4:  One  Track  Metric  
    Trade-­‐offs  in  design  require  mulUple  metrics  
    In  carefully  cra7ed  metrics  suite,  
     negaUve  side  effects  of    
    opUmizing  one  metric  
     are  counter-­‐balanced    
    by  other  ones  
    16  

    View Slide

  17. Pulng  Metrics  in  Context  
    •  Establish  benchmark  
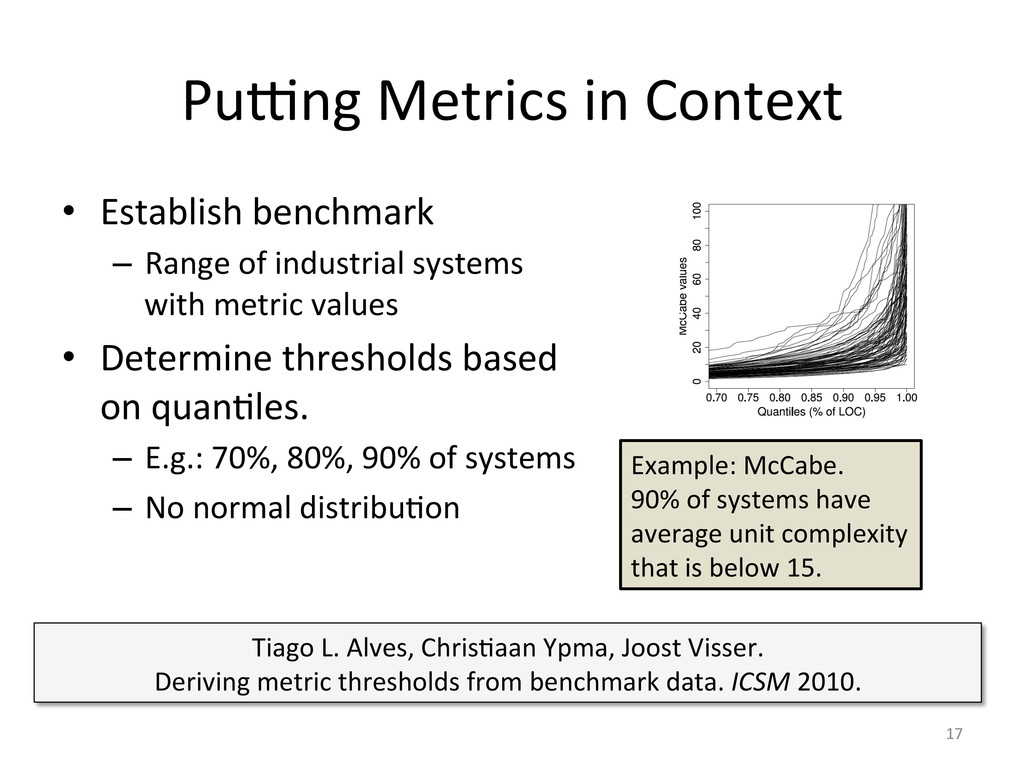
    –  Range  of  industrial  systems  
    with  metric  values  
    •  Determine  thresholds  based  
    on  quanUles.  
    –  E.g.:  70%,  80%,  90%  of  systems  
    –  No  normal  distribuUon  
    17  
    Tiago  L.  Alves,  ChrisUaan  Ypma,  Joost  Visser.    
    Deriving  metric  thresholds  from  benchmark  data.  ICSM  2010.  
    Example:  McCabe.  
    90%  of  systems  have  
    average  unit  complexity  
    that  is  below  15.  

    View Slide

  18. Assessments  2003-­‐-­‐2008  
    •  ISO  9126    quality  model  
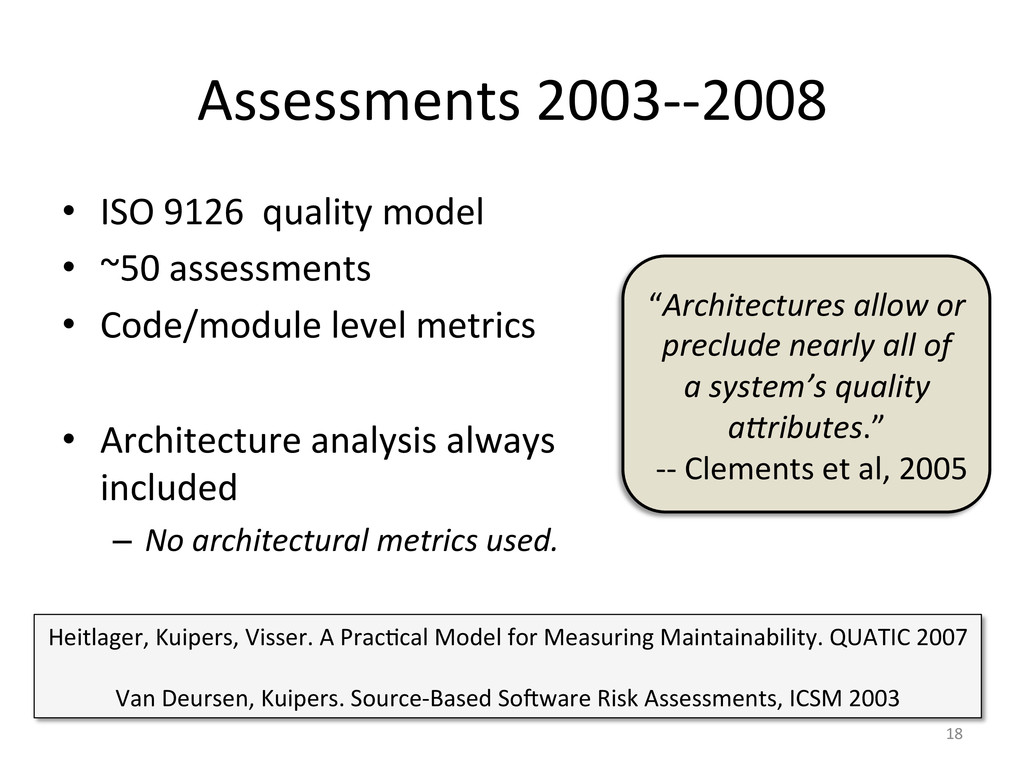
    •  ~50  assessments  
    •  Code/module  level  metrics  
    •  Architecture  analysis  always  
    included  
    –  No  architectural  metrics  used.  
    18  
    Heitlager,  Kuipers,  Visser.  A  PracUcal  Model  for  Measuring  Maintainability.  QUATIC  2007  
     
    Van  Deursen,  Kuipers.  Source-­‐Based  So7ware  Risk  Assessments,  ICSM  2003  
    “Architectures  allow  or  
    preclude  nearly  all  of    
    a  system’s  quality  
    aJributes.”  
    -­‐-­‐  Clements  et  al,  2005  

    View Slide

  19. 2009:  Re-­‐thinking  
    Architectural  Analysis  
     
    QualitaUve  study  of  
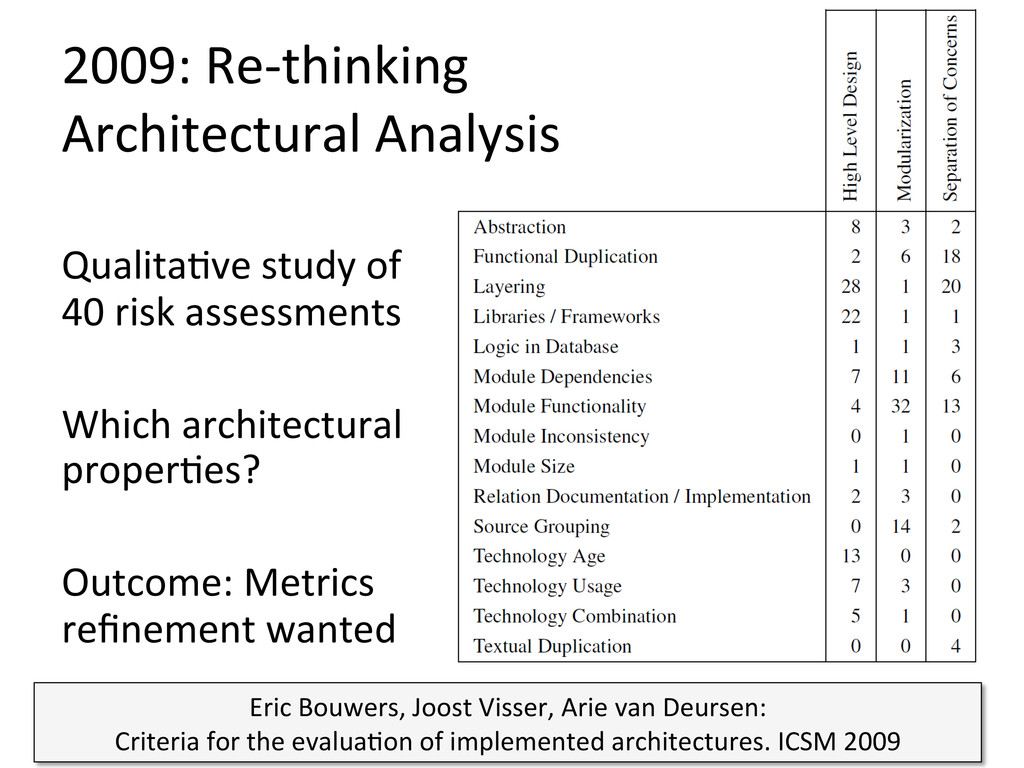
    40  risk  assessments  
     
    Which  architectural  
    properUes?  
     
    Outcome:  Metrics  
    refinement  wanted  
    19  
    Eric  Bouwers,  Joost  Visser,  Arie  van  Deursen:    
    Criteria  for  the  evaluaUon  of  implemented  architectures.  ICSM  2009  

    View Slide

  20. ISO  25010  Maintainability  
    “Degree  of  effecOveness  and  efficiency  with  
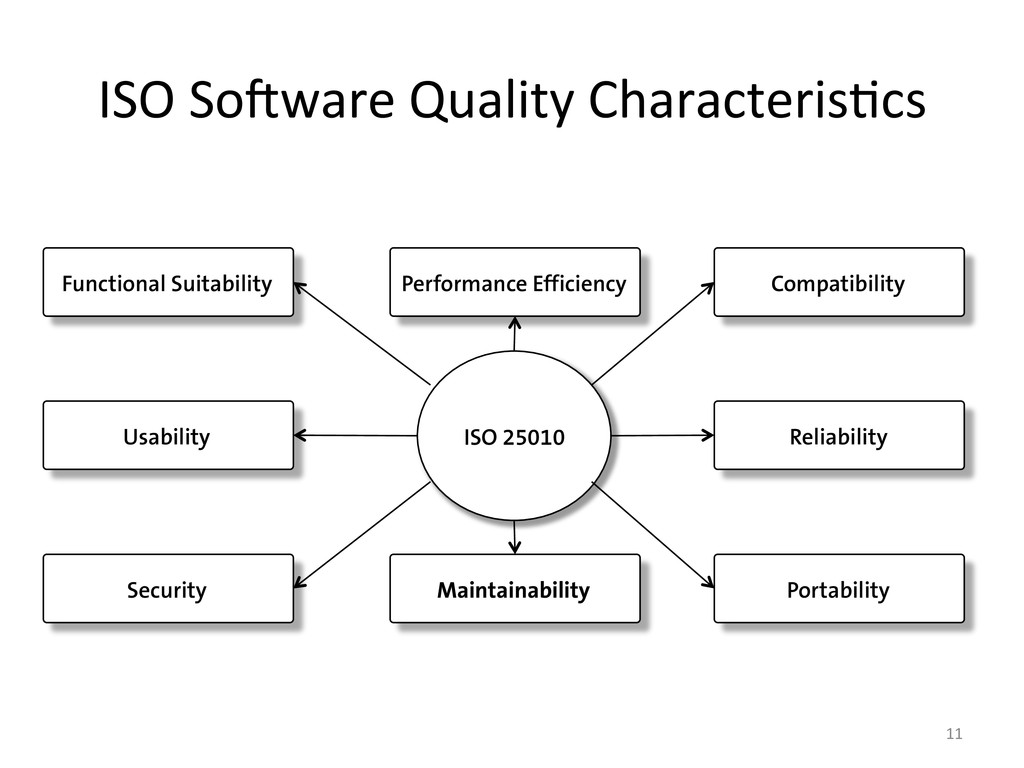
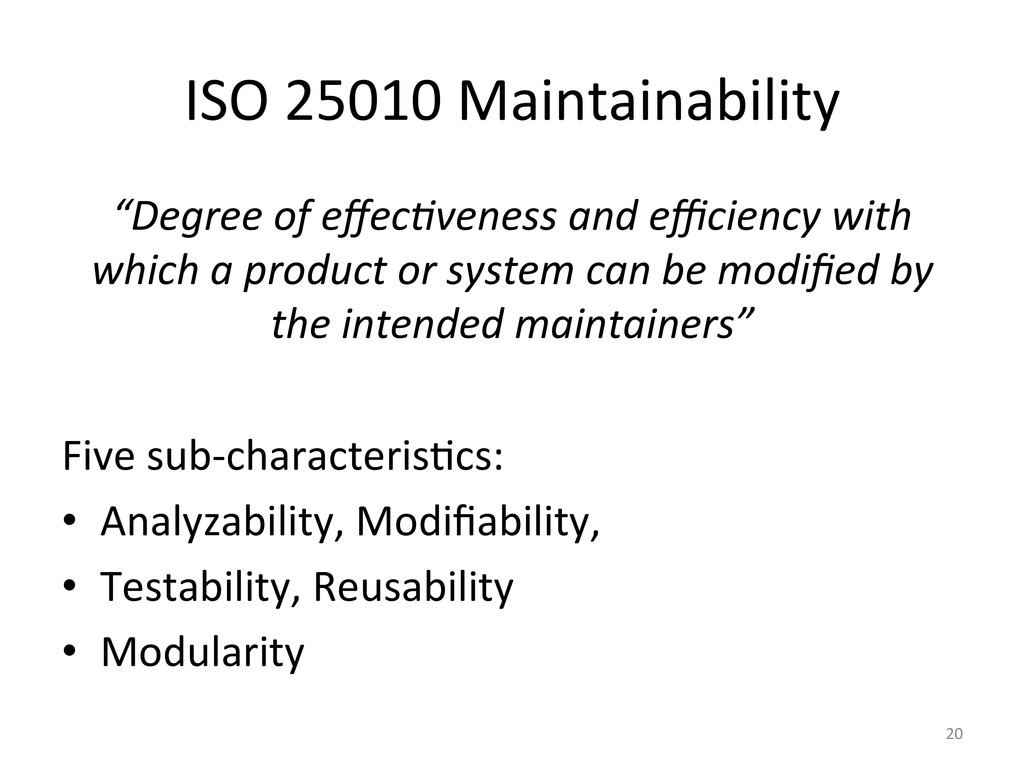
    which  a  product  or  system  can  be  modified  by  
    the  intended  maintainers”  
     
    Five  sub-­‐characterisUcs:  
    •  Analyzability,  Modifiability,    
    •  Testability,  Reusability  
    •  Modularity  
    20  

    View Slide

  21. Modularity  
    ISO  25010  maintainability  
    sub  characterisUc:  
     
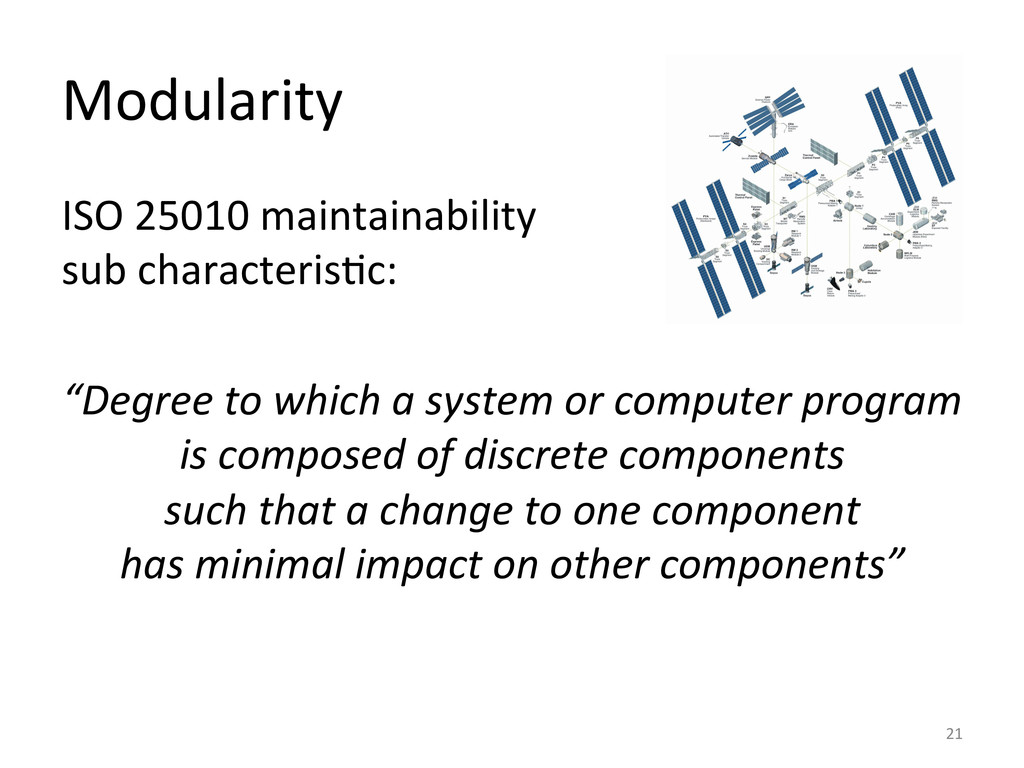
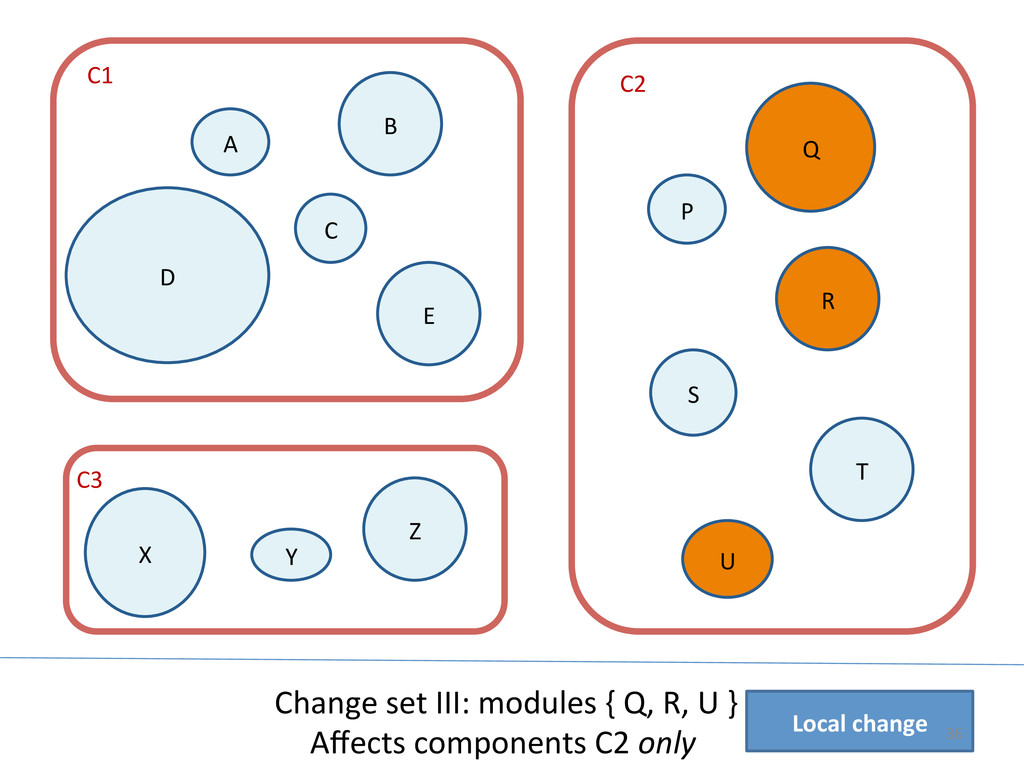
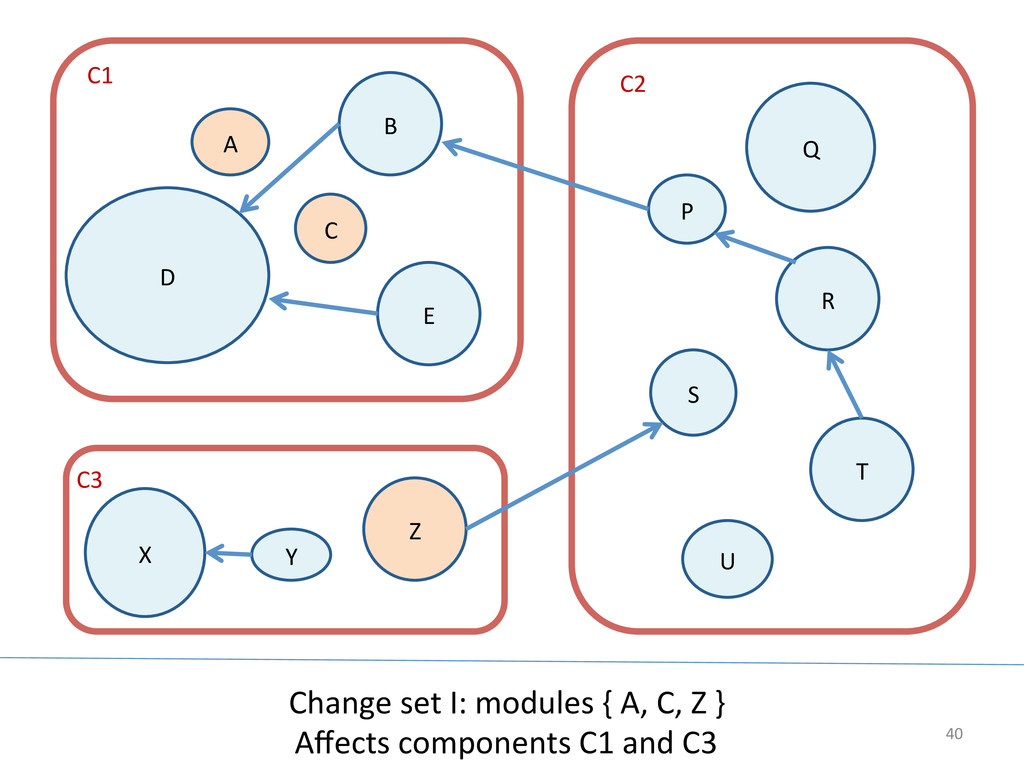
    “Degree  to  which  a  system  or  computer  program  
    is  composed  of  discrete  components    
    such  that  a  change  to  one  component    
    has  minimal  impact  on  other  components”  
     
    21  

    View Slide

  22. Informa:on  Hiding  
    22  
     
     
    Things  that  change  
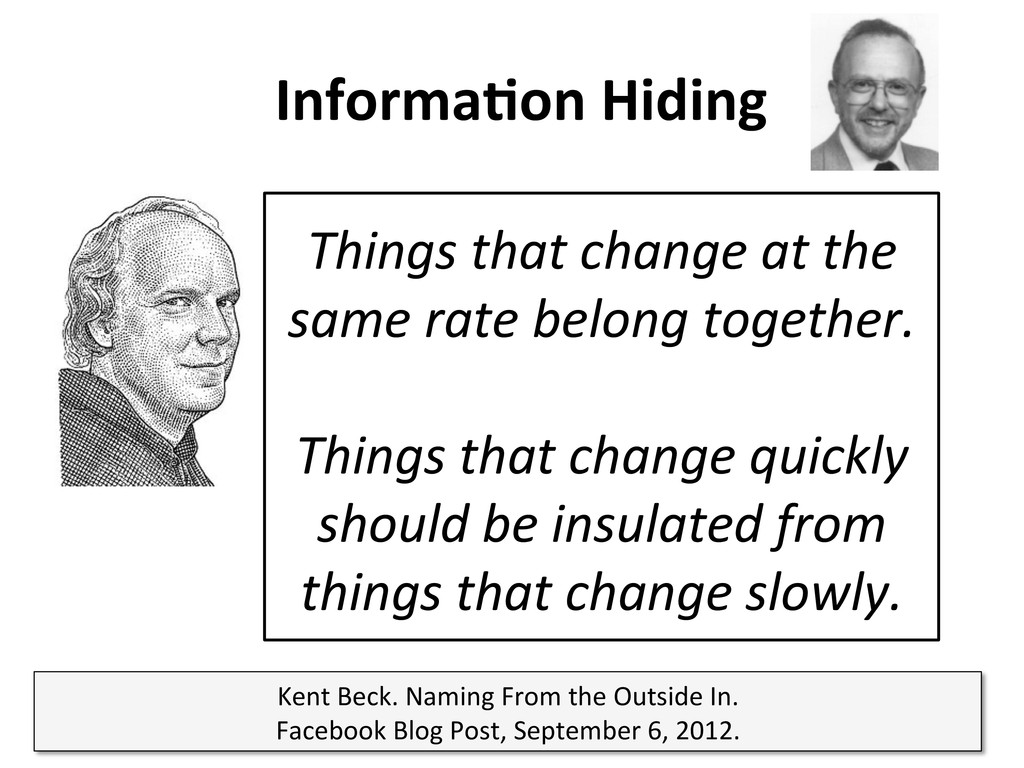
at  the  
    same  rate  belong  together.  
     
    Things  that  change  quickly  
    should  be  insulated  from  
    things  that  change  slowly.  
     
    Kent  Beck.  Naming  From  the  Outside  In.  
    Facebook  Blog  Post,  September  6,  2012.  

    View Slide

  23. Measuring  EncapsulaUon?  
    Can  we  find  so>ware  architecture  metrics  that  
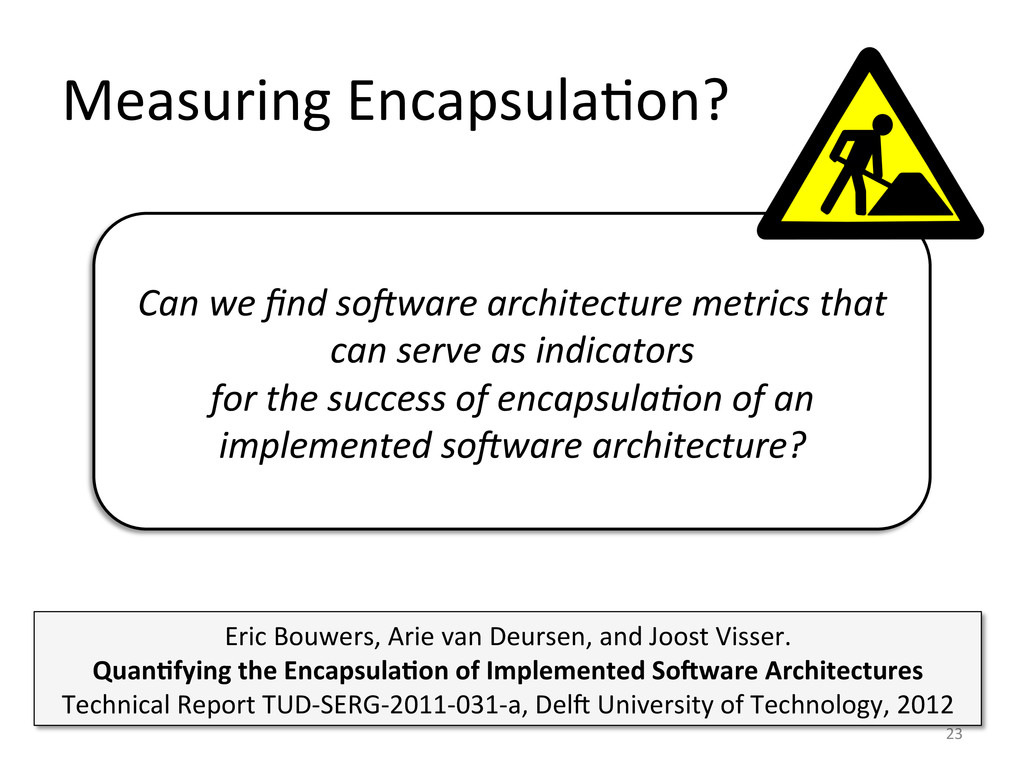
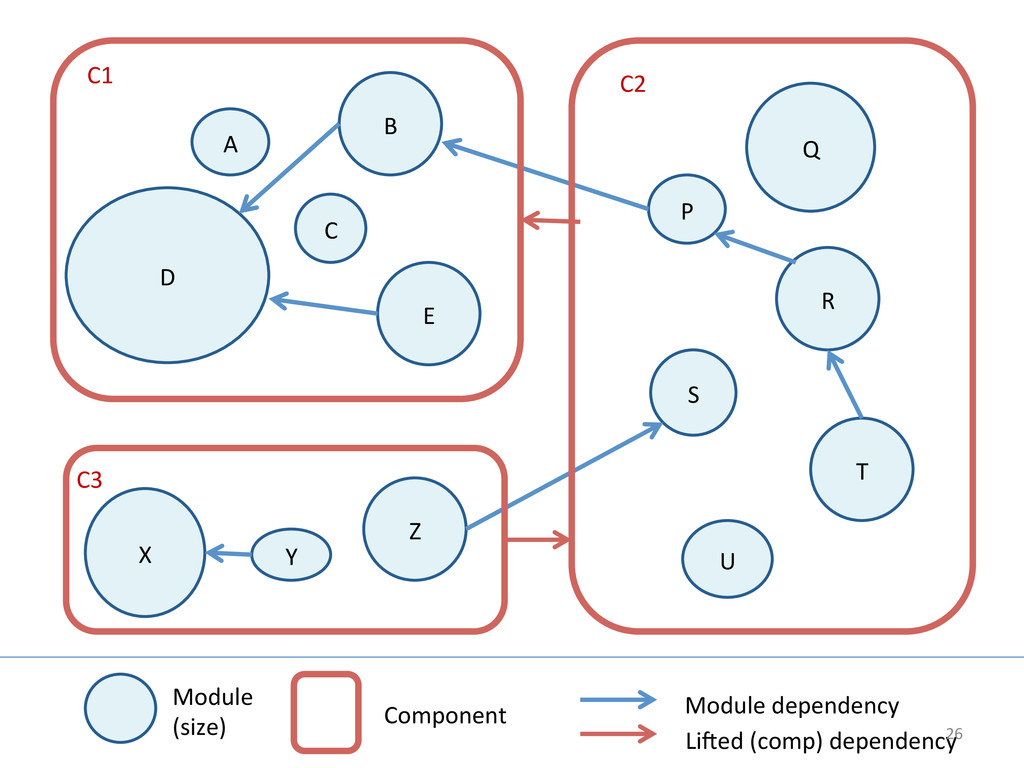
    can  serve  as  indicators    
    for  the  success  of  encapsulaOon  of  an  
    implemented  so>ware  architecture?  
    23  
    Eric  Bouwers,  Arie  van  Deursen,  and  Joost  Visser.  
    Quan:fying  the  Encapsula:on  of  Implemented  So.ware  Architectures  
    Technical  Report  TUD-­‐SERG-­‐2011-­‐031-­‐a,  Del7  University  of  Technology,  2012  

    View Slide

  24. Metric  Criteria  in  an    
    Assessment  Context  
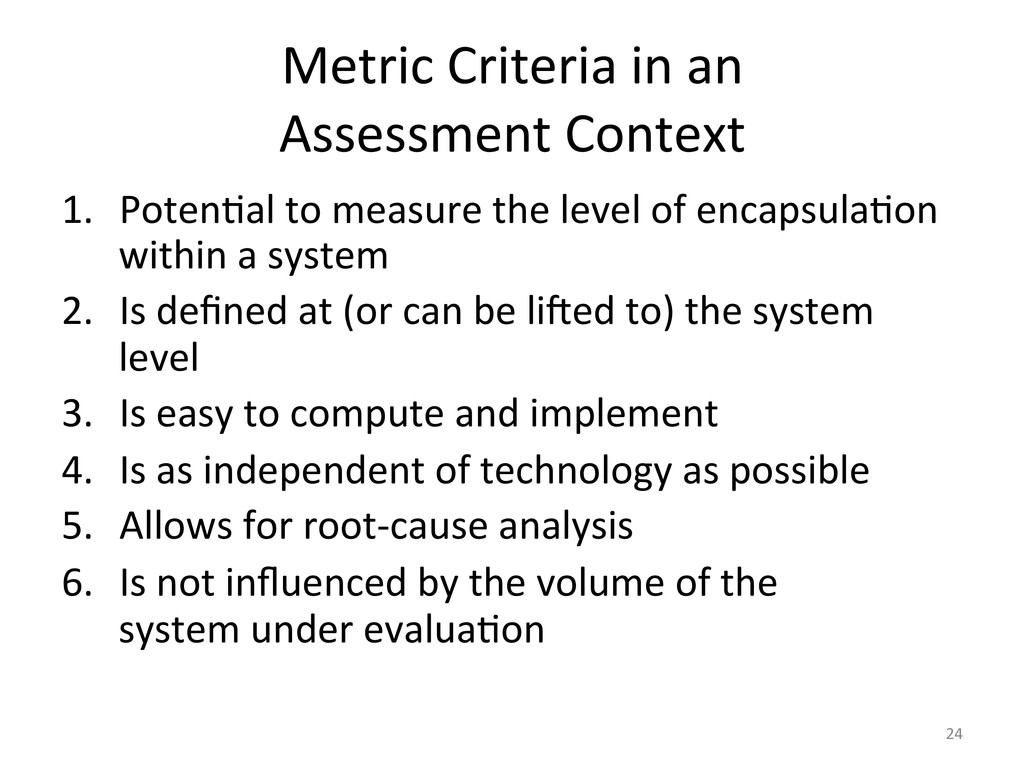
    1.  PotenUal  to  measure  the  level  of  encapsulaUon  
    within  a  system  
    2.  Is  defined  at  (or  can  be  li7ed  to)  the  system  
    level  
    3.  Is  easy  to  compute  and  implement  
    4.  Is  as  independent  of  technology  as  possible  
    5.  Allows  for  root-­‐cause  analysis  
    6.  Is  not  influenced  by  the  volume  of  the    
    system  under  evaluaUon  
    24  

    View Slide

  25. What  is  an  Architecture?  
    *
    1
    Name: String
    Size: Int
    Architectural
    Element
    Kind : Enum
    Cardinality: Int
    Dependency
    To From
    System
    *
    1
    Component
    *
    1
    Module
    Unit
    25  
    Architectural  
    Meta-­‐Model  

    View Slide

  26. U  
    Z  
    C  
    E  
    A  
    B  
    R  
    X  
    S  
    Y  
    P  
    T  
    Q  
    D  
    Module  
    (size)   Component   Module  dependency  
    Li7ed  (comp)  dependency  
    C1   C2  
    C3  
    26  

    View Slide

  27. Searching  the  Literature  
    •  IdenUfied  over  40  
    candidate  
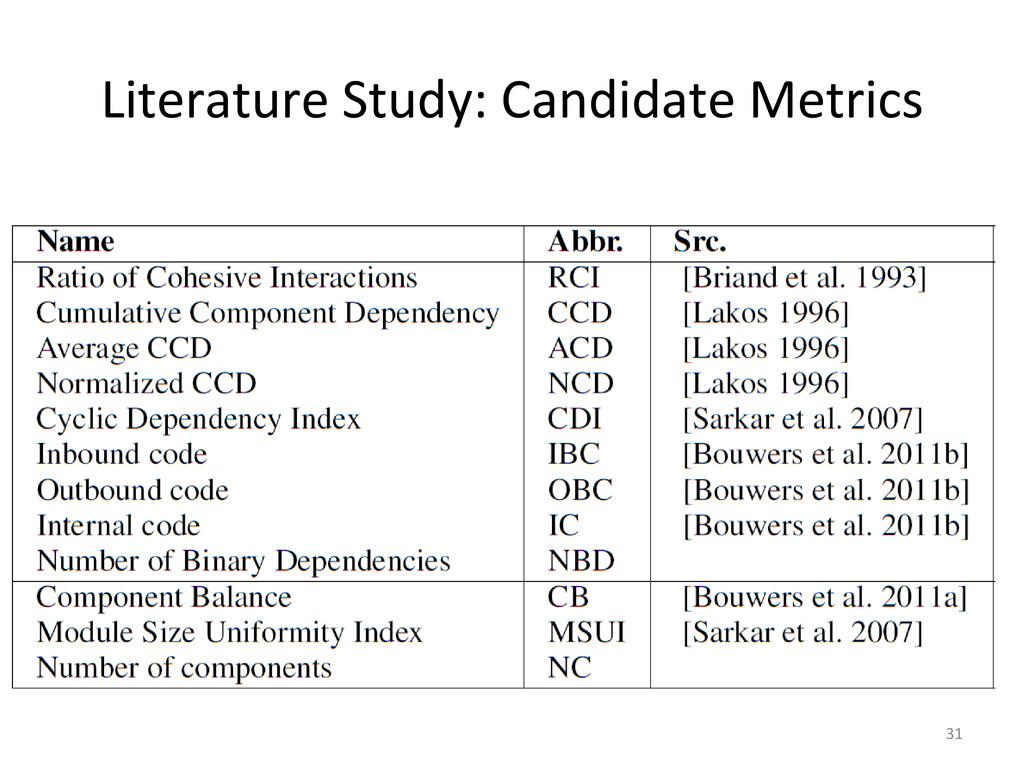
metrics  
    •  Survey  by  Koziolek  
    starUng  point  
    •  11  metrics  meet  
    criteria  
    27  
    H.  Koziolek.  Sustainability  evaluaUon  of  so7ware  architectures:  a  
    systemaUc  review.  In  QoSA-­‐ISARCS  ’11,  pages  3–12.  ACM,  2011  

    View Slide

  28. Our  own  Proposal:  
    Dependency  Profiles  
    Module  types:  
    1.  Internal  
    2.  Inbound  
    3.  Outbound  
    4.  Transit  
    28  
    Eric  Bouwers,  Arie  van  Deursen,  Joost  Visser.    
    Dependency  Profiles  for  So>ware  Architecture  EvaluaOons.  ICSM  ERA,  2011.  

    View Slide

  29. Dependency  Profiles  (2)  
    •  Look  at  relaUve  size  of  different  module  types  
    •  Dependency  profile  is  quadruple:  
    <%internal,  %inbound,  %outbound,  %transfer>  
    •  <40,  30,  20,  10>  versus  <60,  20,  10,  0>    
    •  Summary  of      
    componenUzaUon    
    at  the  system  level  
    29  

    View Slide

  30. 30  
    hiddenCode inboundCode outboundCode transitCode
    0 20 40 60 80 100
    Profiles  in  
    benchmark  
    of  ~100  
    systems  

    View Slide

  31. Literature  Study:  Candidate  Metrics  
    31  

    View Slide

  32. Metrics  EvaluaUon  
    1.  QuanUtaUve  approach    
    – Which  metric  
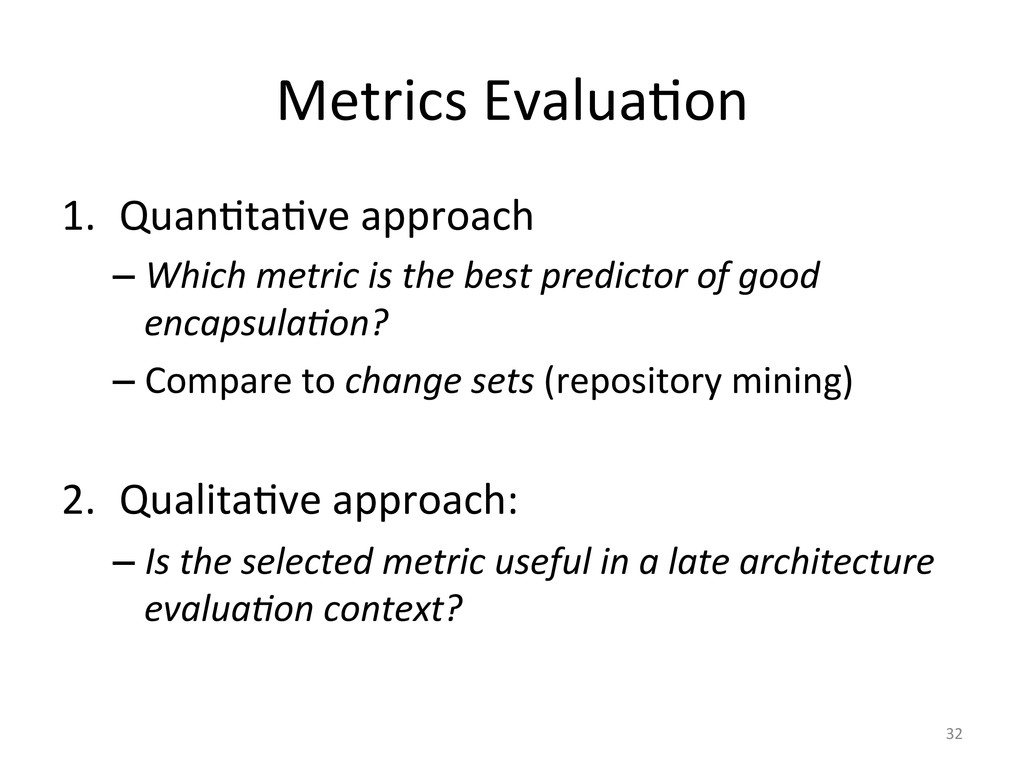
is  the  best  predictor  of  good  
    encapsulaOon?  
    – Compare  to  change  sets  (repository  mining)  
    2.  QualitaUve  approach:  
    – Is  the  selected  metric  useful  in  a  late  architecture  
    evaluaOon  context?  
    32  

    View Slide

  33. U  
    Z  
    C  
    E  
    A  
    B  
    R  
    X  
    S  
    Y  
    P  
    T  
    Q  
    D  
    C1   C2  
    C3  
    Commit  in  version  repository  results  in  change  set  
    33  

    View Slide

  34. U  
    Z  
    C  
    E  
    A  
    B  
    R  
    X  
    S  
    Y  
    P  
    T  
    Q  
    D  
    C1   C2  
    C3  
    Change  set  I:  modules  {  A,  C,  Z  }    
    Affects  components  C1  and  C3   34  

    View Slide

  35. U  
    Z  
    C  
    E  
    A  
    B  
    R  
    X  
    S  
    Y  
    P  
    T  
    Q  
    D  
    C1   C2  
    C3  
    Change  set  II:  modules  {  B,  D,  E  }    
    Affects  components  C1  only   Local  change  
    35  

    View Slide

  36. U  
    Z  
    C  
    E  
    A  
    B  
    R  
    X  
    S  
    Y  
    P  
    T  
    Q  
    D  
    C1   C2  
    C3  
    Change  set  III:  modules  {  Q,  R,  U  }    
    Affects  components  C2  only   Local  change  
    36  

    View Slide

  37. U  
    Z  
    C  
    E  
    A  
    B  
    R  
    X  
    S  
    Y  
    P  
    T  
    Q  
    D  
    C1   C2  
    C3  
    Change  set  IV:  modules  {  S,  T,  Z  }    
    Affects  components  C2  and  C3   Non-­‐Local  change  
    37  

    View Slide

  38. ObservaUon  1:  
    Local  Change-­‐Sets  are  Good  
    •  Combine  change  sets  into  series  
    •  The  more  local  changes  in  a  series,  the  beJer  
    the  encapsulaOon  worked  out.  
    38  

    View Slide

  39. ObservaUon  2:  
    Metrics  may  change  too  
    •  A  change  may  affect  the  value  of  the  metrics.  
    •  Cut  large  set  of  change  sets  into  sequence  of  
    stable  change-­‐set  series.  
    39  

    View Slide

  40. U  
    Z  
    C  
    E  
    A  
    B  
    R  
    X  
    S  
    Y  
    P  
    T  
    Q  
    D  
    C1   C2  
    C3  
    Change  set  I:  modules  {  A,  C,  Z  }    
    Affects  components  C1  and  C3   40  

    View Slide

  41. U  
    Z  
    C  
    E  
    A B  
    R  
    X  
    S  
    Y  
    P  
    T  
    Q  
    D  
    C1   C2  
    C3  
    Change  set  I:  modules  {  A,  C,  Z  }    
    The  Change  Set  may  affect  metric  outcomes!!   41  

    View Slide

  42. SoluUon:  Stable  Period  IdenOficaOon  
    42  

    View Slide

  43. Experimental  Setup  
    •  IdenUfy  10  long  running  open  source  
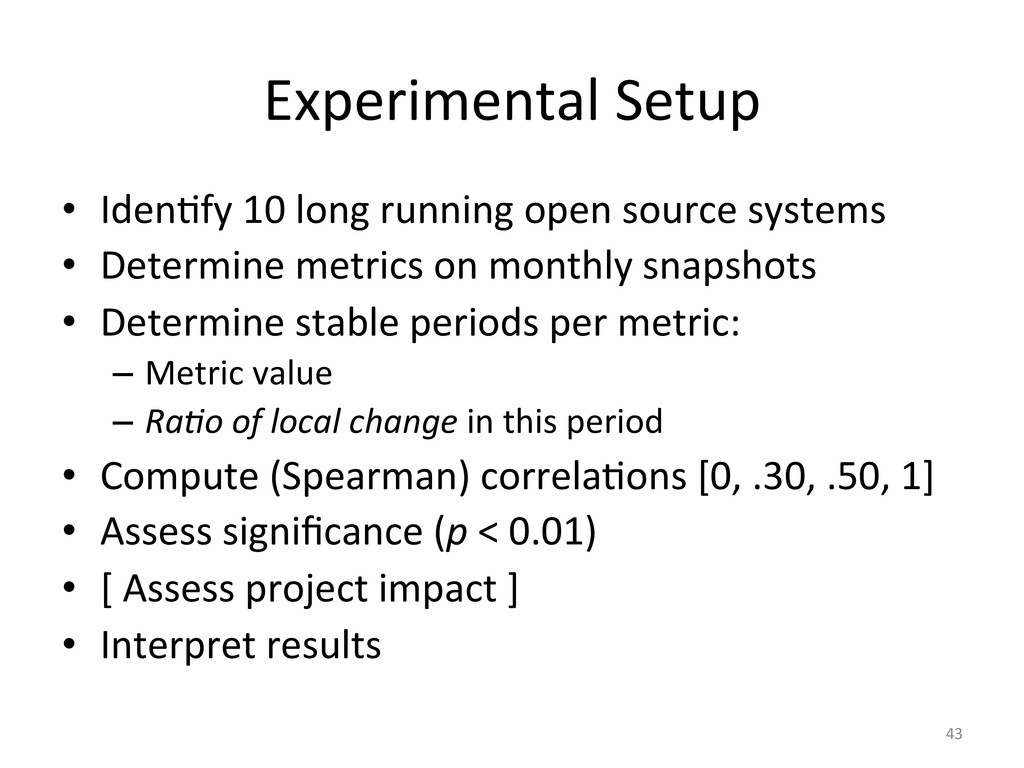
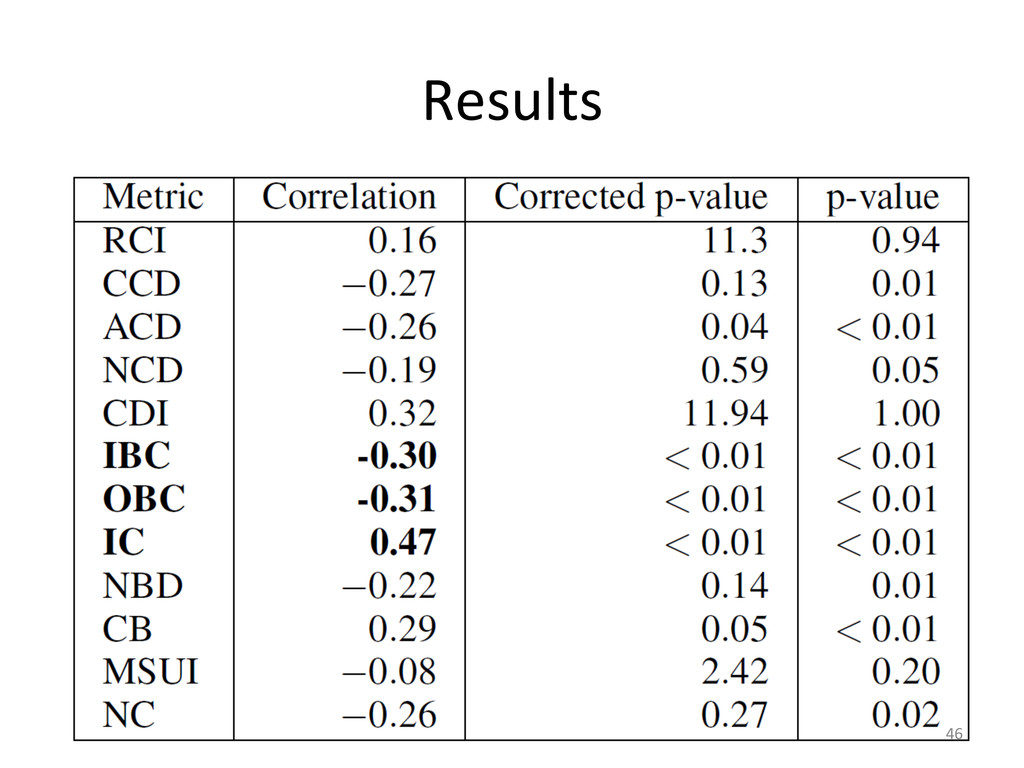
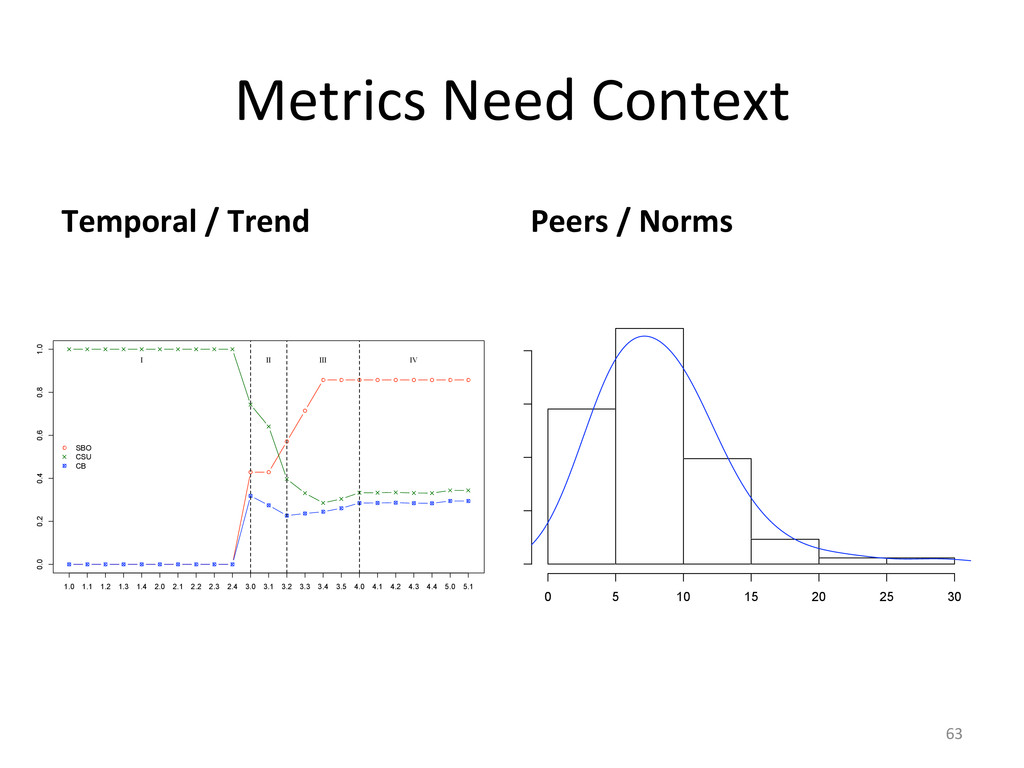
systems  
    •  Determine  metrics  on  monthly  snapshots  
    •  Determine  stable  periods  per  metric:  
    –  Metric  value  
    –  RaOo  of  local  change  in  this  period  
    •  Compute  (Spearman)  correlaUons  [0,  .30,  .50,  1]  
    •  Assess  significance  (p  <  0.01)  
    •  [  Assess  project  impact  ]  
    •  Interpret  results  
    43  

    View Slide

  44. Systems  Under  Study  
    44  

    View Slide

  45. Stable  Periods  
    45  

    View Slide

  46. Results  
    46  

    View Slide

  47. Best    Indicator  for  EncapsulaUon:  
    Percentage  of  Internal  Code  
    Module  types:  
    1.  Internal  
    2.  Inbound  
    3.  Outbound  
    4.  Transit  
    47  

    View Slide

  48. Threats  to  Validity  
    Construct  validity  
    •  EncapsulaUon  ==    
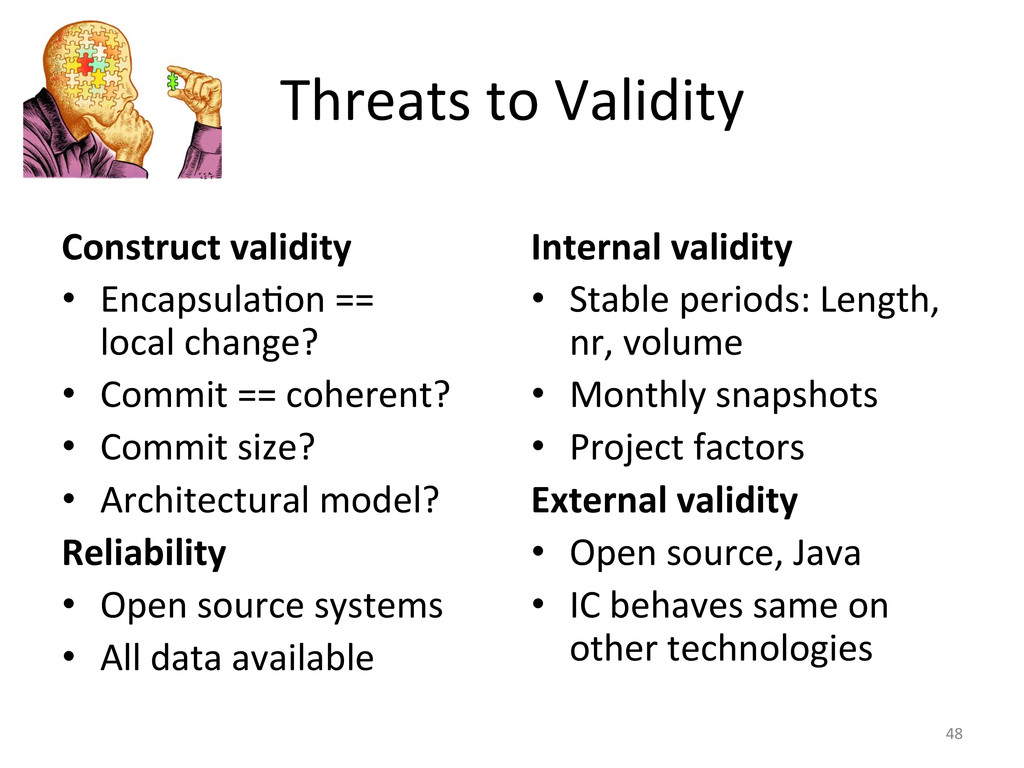
    local  change?  
    •  Commit  ==  coherent?  
    •  Commit  size?  
    •  Architectural  model?  
    Reliability  
    •  Open  source  systems  
    •  All  data  available  
     
    Internal  validity  
    •  Stable  periods:  Length,  
    nr,  volume  
    •  Monthly  snapshots  
    •  Project  factors  
    External  validity  
    •  Open  source,  Java  
    •  IC  behaves  same  on  
    other  technologies  
     
    48  

    View Slide

  49. Shi7ing  paradigms  
    •  StaUsUcal  hypothesis  tesUng:  
    Percentage  of  internal  change  is    
    valid  indicator  for  encapsulaOon  
    •  But  is  it  of  any  use?  
    •  Can  people  work  with?  
    •  Shi>  to  pragmaOc  knowledge  paradigm  
    49  

    View Slide

  50. So7ware  Risk  Assessments  
    50  

    View Slide

  51. Experimental  Design  
    Goal:  
    •  Understand  the  usefulness  of  
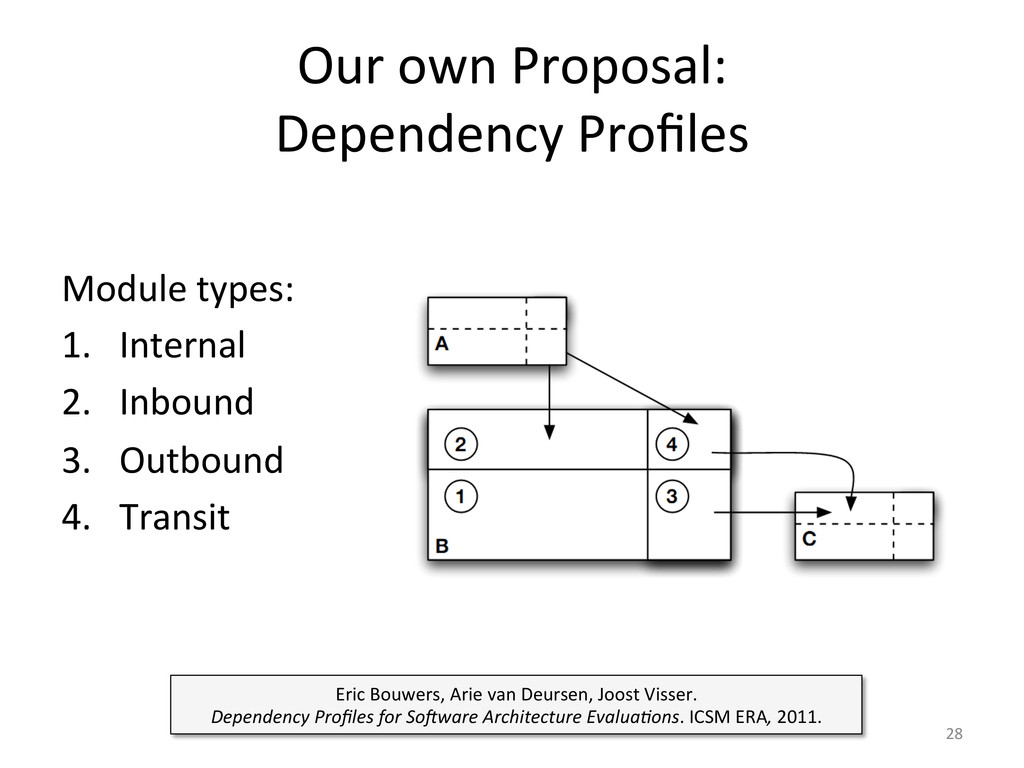
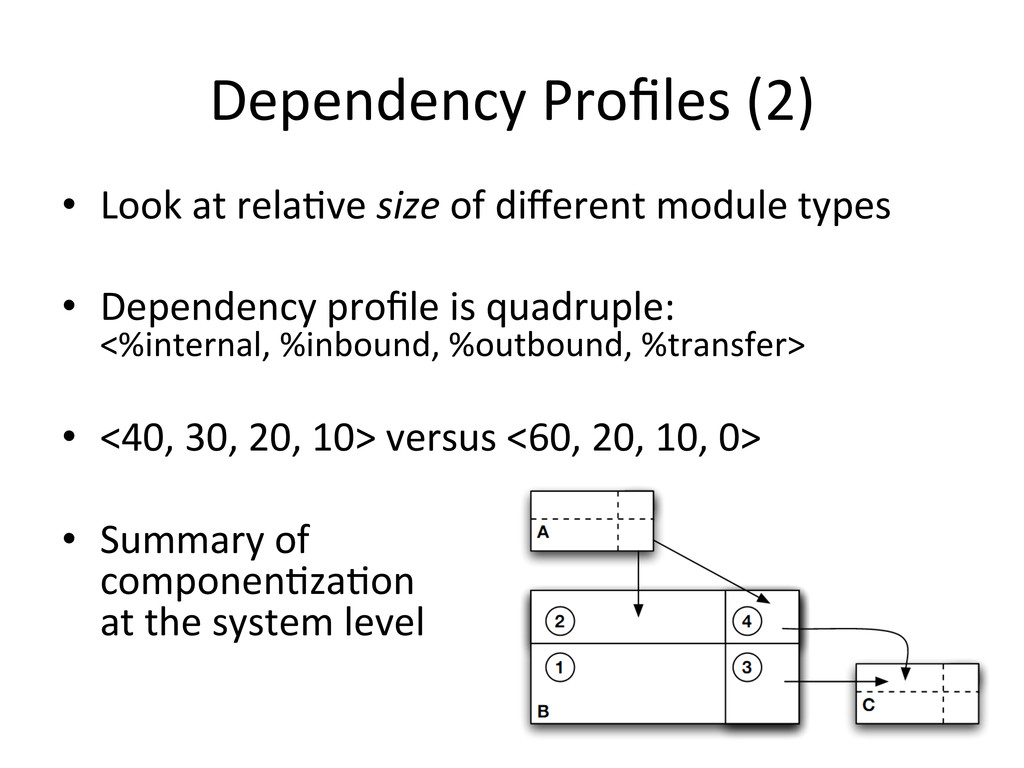
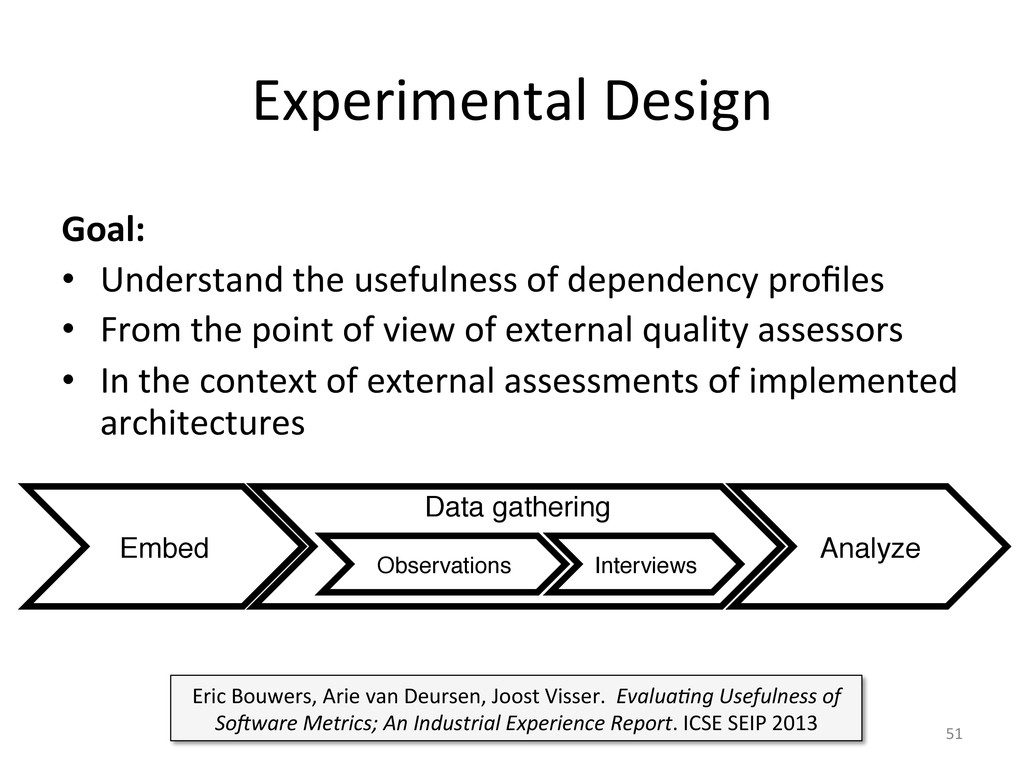
dependency  profiles  
    •  From  the  point  of  view  of  external  quality  assessors  
    •  In  the  context  of  external  assessments  of  implemented  
    architectures  
    51  
    Data gathering
    "
    "
    "
    "
    "
    Embed
    "
    Observations
    " Interviews
    "
    Analyze
    "
    Eric  Bouwers,  Arie  van  Deursen,  Joost  Visser.    EvaluaOng  Usefulness  of  
    So>ware  Metrics;  An  Industrial  Experience  Report.  ICSE  SEIP  2013  

    View Slide

  52. Embedding  
    •  January  2012:  New  metrics  in  SIG  models  
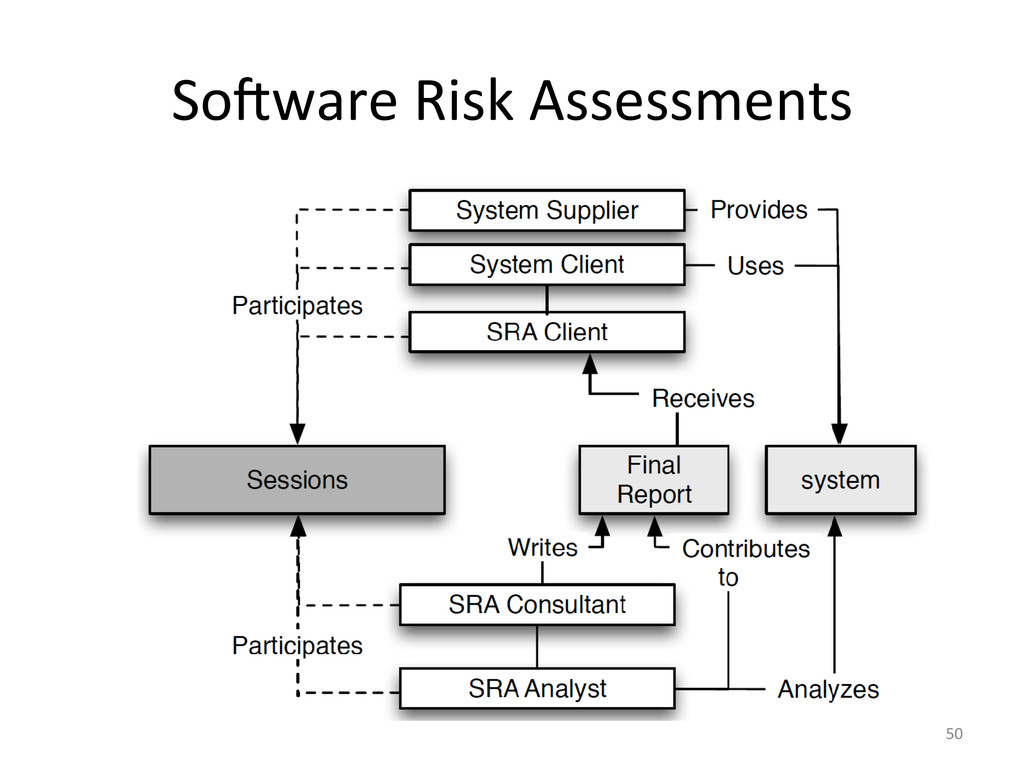
    – 50  risk  assessments  during  6  months  
    – Monitors  for  over  500  systems  
    – “Component  Independence”  
    •  System  characterisUcs:  
    – C#,  Java,  ASP,  SQL,  Cobol,  Tandem,  …  
    – 1000s  to  several  millions  of  lines  of  code  
    – Banking,  government,  insurance,  logisUcs,  …  
    52  

    View Slide

  53. Data  Gathering:  ObservaUons  
    •  February-­‐August  2012  
    •  Observer  
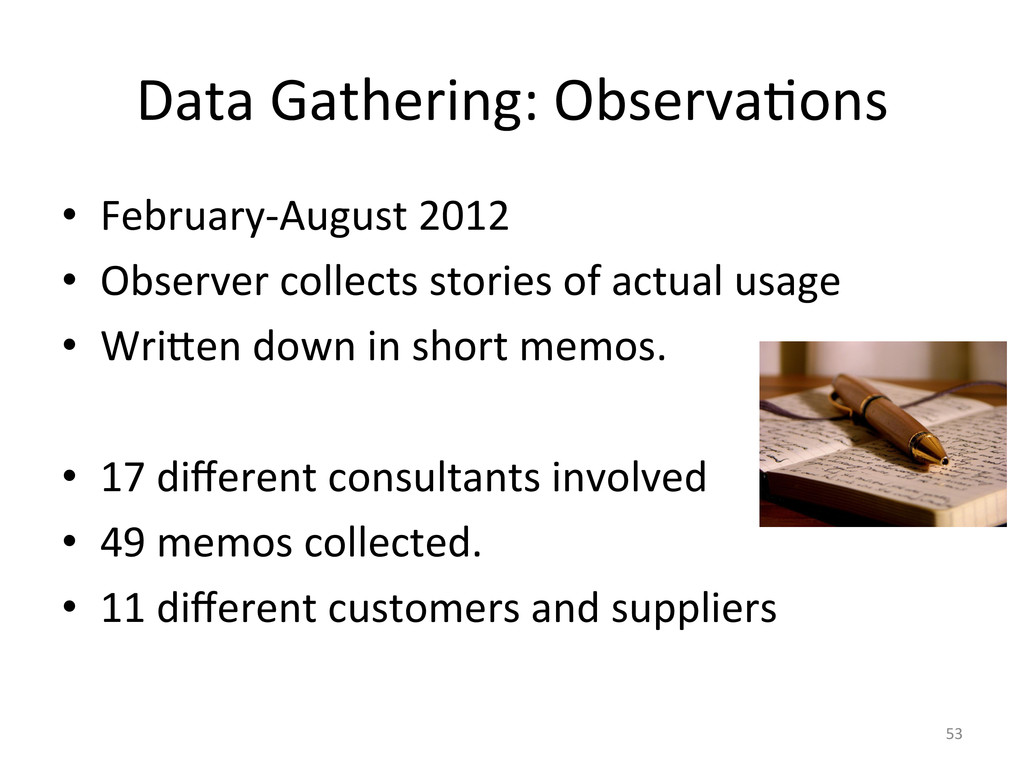
collects  stories  of  actual  usage  
    •  Wri•en  down  in  short  memos.  
    •  17  different  consultants  involved  
    •  49  memos  collected.  
    •  11  different  customers  and  suppliers  
    53  

    View Slide

  54. Data  Gathering:  Interviews  
    •  30  minute  interviews  with  11  assessors  
    •  Open  discussion:    
    – “How  do  you  use  the  new  component  
    independence  metric”?  
    – Findings  in  1  page  summaries  
    •  Scale  1-­‐5  answer:  
    – How  useful  do  you  find  the  metric?  
    – Does  it  make  your  job  easier?  
    54  
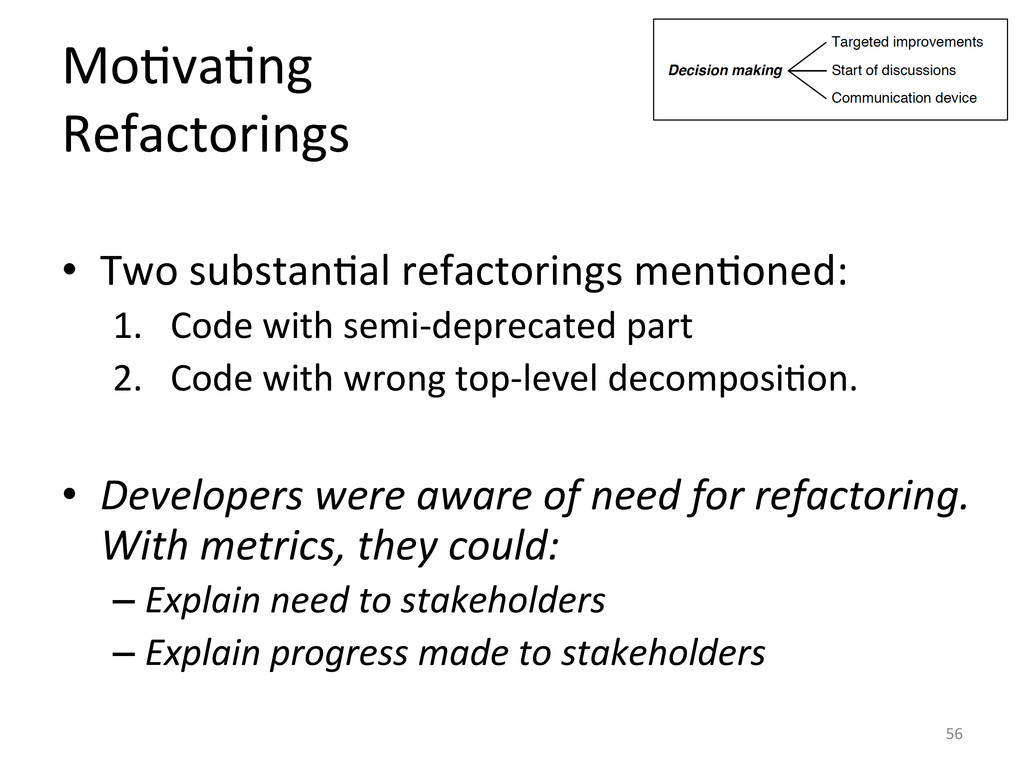
    View Slide

  55. ResulUng  Coding  System  
    55  
    Michaela  Greiler,  Arie  van  Deursen,  Margaret-­‐Anne  D.  Storey:  Test  confessions:  A  
    study  of  tesUng  pracUces  for  plug-­‐in  systems.  ICSE  2012:  244-­‐253  

    View Slide

  56. MoUvaUng    
    Refactorings  
    •  Two  substanUal  refactorings  menUoned:  
    1.  Code  with  semi-­‐deprecated  part  
    2.  Code  with  wrong  top-­‐level  decomposiUon.  
    •  Developers  were  aware  of  need  for  refactoring.  
    With  metrics,  they  could:  
    – Explain  need  to  stakeholders  
    – Explain  progress  made  to  stakeholders  
    56  

    View Slide

  57. What  is  a    
    Component?  
    Different  “architectures”  exist:  
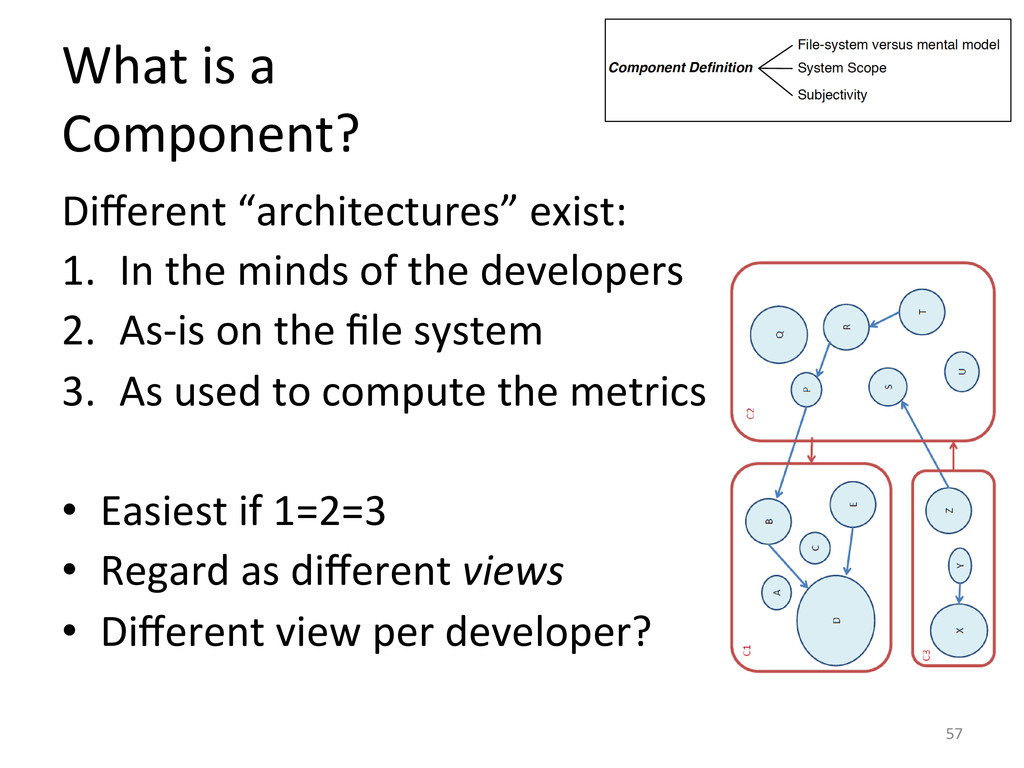
    1.  In  the  minds  of  the  developers  
    2.  As-­‐is  on  the  file  system  
    3.  As  used  to  compute  the  metrics    
    •  Easiest  if  1=2=3  
    •  Regard  as  different  views  
    •  Different  view  per  developer?  
    57  

    View Slide

  58. Concerns  
    •  Do  size  or  age  affect  informaUon  hiding?  
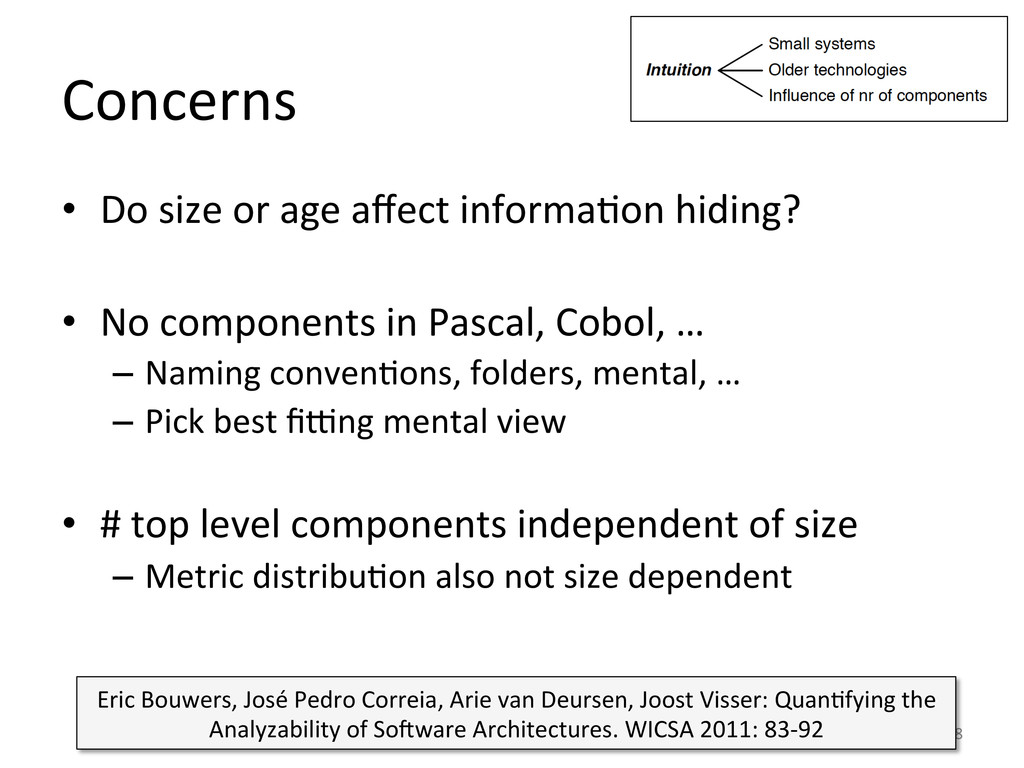
    •  No  components  in  Pascal,  Cobol,  …  
    –  Naming  convenUons,  folders,  mental,  …  
    –  Pick  best  filng  mental  view  
    •  #  top  level  components  independent  of  size  
    –  Metric  distribuUon  also  not  size  dependent  
    58  
    Eric  Bouwers,  José  Pedro  Correia,  Arie  van  Deursen,  Joost  Visser:  QuanUfying  the  
    Analyzability  of  So7ware  Architectures.  WICSA  2011:  83-­‐92  

    View Slide

  59. Not  Easy-­‐to-­‐Use.  
    59  
    0!
    1!
    2!
    3!
    4!
    5!
    1! 2! 3! 4! 5!
    Frequency!
    Scores!
     But  Useful.  

    View Slide

  60. Dependency  Profiles:  Conclusions  
    Lessons  Learned  
    Need  for  
    •  Strict  component  definiUon  
    guidelines  
    •  Body  of  knowledge    
    –  Value  pa•erns  
    –  With  recommendaUons  
    –  Effort  esUmaUon  
    •  Improved  dependency  
    resoluUon  
    Threats  to  Validity  
    •  High  realism  
    •  Data  confidenUal  
    •  Range  of  different  systems  
    and  technologies  
    Wanted:  replicaUon  in    open  
    source  (Java  /  Sonar)  context  
    60  

    View Slide

  61. A  Summary  in  Seven  Slides  
    61  

    View Slide

  62. Accountability  and  Explainability  
    •  Accountability  in  
    so7ware  architecture?  
    –   Not  very  popular  
    •  Stakeholders  are  enUtled  
    to  an  explanaUon  
    •  Metrics  are  a  necessary  
    ingredient  
    62  

    View Slide

  63. Metrics  Need  Context  
    Temporal  /  Trend  
    0.0 0.2 0.4 0.6 0.8 1.0
    Index
    systems$sbo
    1.0 1.1 1.2 1.3 1.4 2.0 2.1 2.2 2.3 2.4 3.0 3.1 3.2 3.3 3.4 3.5 4.0 4.1 4.2 4.3 4.4 5.0 5.1
    SBO
    CSU
    CB
    I II III IV
    Peers  /  Norms  
    Histogram of x$nmodules
    x$nmodules
    Density
    0 5 10 15 20 25 30
    0.00 0.02 0.04 0.06 0.08
    63  

    View Slide

  64. Metrics  Research  Needs  Datasets  
    Two  recent  Del7  data  sets:  
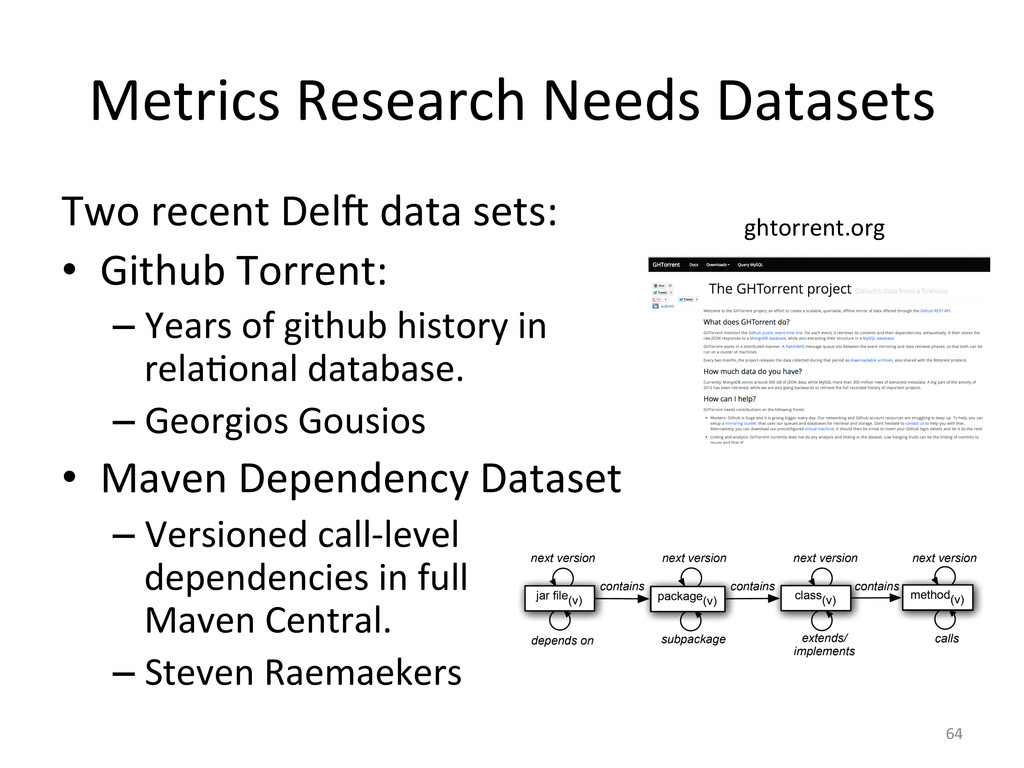
    •  Github  Torrent:  
    – Years  of  github  history  in  
    relaUonal  database.  
    – Georgios  Gousios  
    •  Maven  Dependency  Dataset  
    – Versioned  call-­‐level  
    dependencies  in  full  
    Maven  Central.  
    – Steven  Raemaekers  
    64  
    ghtorrent.org  

    View Slide

  65. Metrics  Research  needs  
    QualitaUve  Methods  
    •  Evaluate  based  upon  the  
    possibiliOes  of  acOon  
    •  Calls  for  rigorous  studies  capturing    
    reality  in  rich  narraOves  
    •  Case  studies,  interviews,  surveys,    
    ethnography,  grounded  theory,  …  
    65  

    View Slide

  66. EncapsulaUon  Can  be  Measured  
    Module  types:  
    1.  Internal  
    2.  Inbound  
    3.  Outbound  
    4.  Transit  
    66  
    And  doing  so,  leads  to  meaningful  
    discussions.  

    View Slide

  67. 67  
    Should  we  be  Afraid  of  Change?  
     
    Metrics  for  So7ware  Evolvability  
    Arie  van  Deursen,  Del.  University  of  Technology  
    Joint  work  with  Eric  Bouwers  &  Joost  Visser  (SIG)  
    @avandeursen  
     

    View Slide