Upgrade to Pro — share decks privately, control downloads, hide ads and more …

Monitoring Production Systems At Wix

Monitoring Production Systems At Wix

An overview of Wix monitoring tools and how we grew them with the company

Aviran Mordo

October 02, 2013
Tweet

More Decks by Aviran Mordo

Other Decks in Technology

Transcript

  1. Red Alert Or False Alarm Monitoring Production Systems Aviran Mordo

    Head Of Back-End Engineering @ Wix @aviranm http://www.linkedin.com/in/aviran http://www.aviransplace.com 07:30
  2. Wixin Numbers • Over 39,000,000 users – Adding over 1,000,000

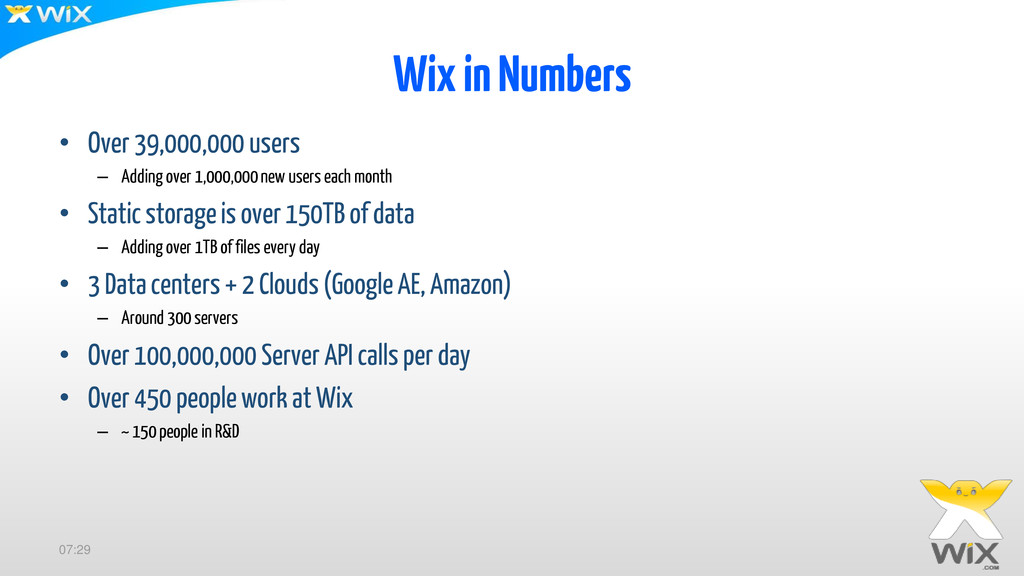
    new users each month • Static storage is over 150TB of data – Adding over 1TB of files every day • 3 Data centers + 2 Clouds (Google AE, Amazon) – Around 300 servers • Over 100,000,000 Server API calls per day • Over 450 people work at Wix – ~ 150 people in R&D 07:29
  3. 07:29 Cons • No early warning –Only when site is

    down • Don’t know what is the problem • Does not monitor API Pros • 24 / 7 Uptime monitoring • Different Geo locations Pingdom
  4. 07:29 Cons • Manually record flows • Does not monitor

    internal servers Pros • Transaction monitoring from real user perspective • Support Flash • Different geo locations Keynote
  5. Monitor Hardware and OS 07:29 Cons • Monitor at the

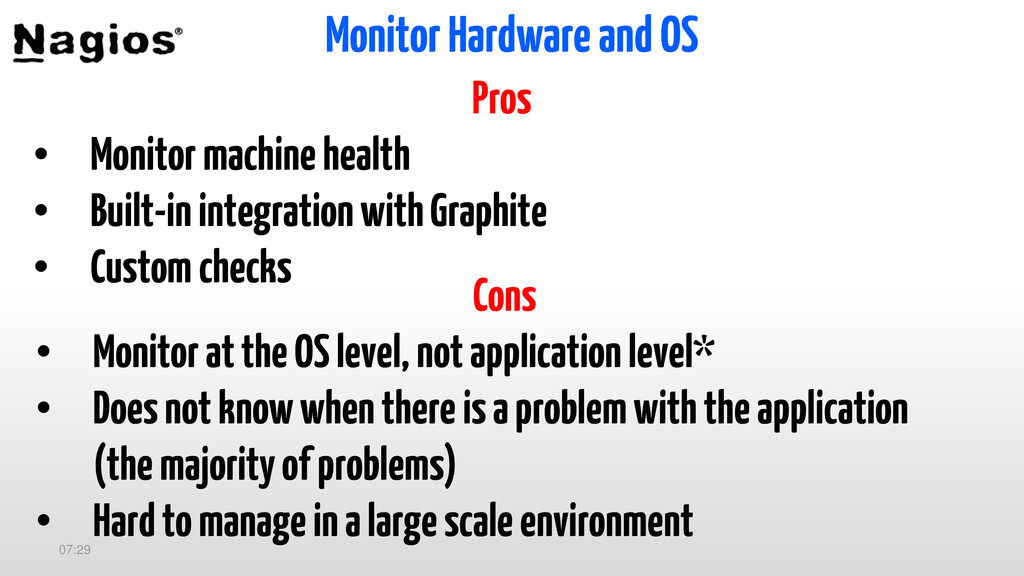
    OS level, not application level* • Does not know when there is a problem with the application (the majority of problems) • Hard to manage in a large scale environment Pros • Monitor machine health • Built-in integration with Graphite • Custom checks
  6. Server Logs 07:29 Cons • Too much information • Hard

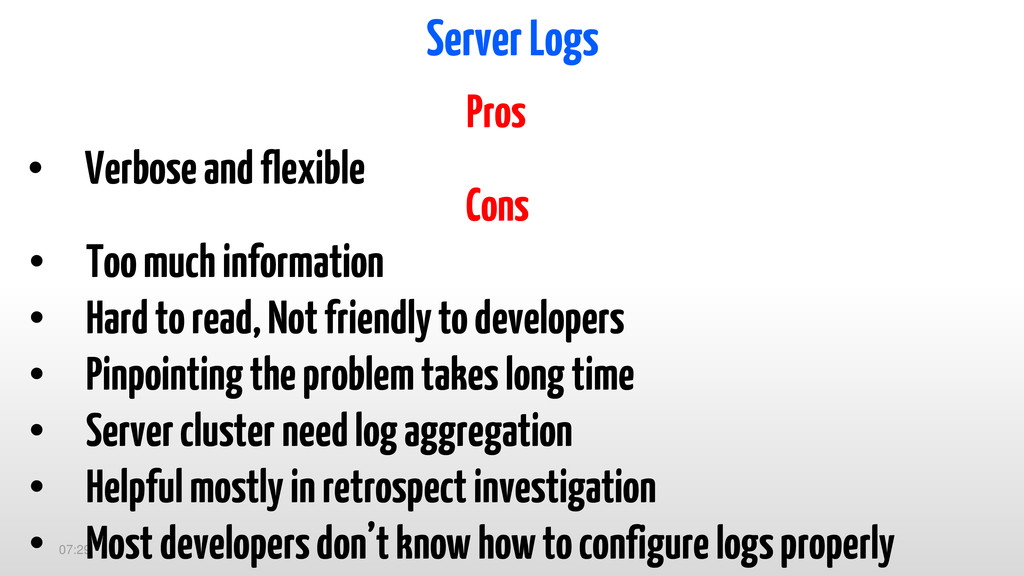
    to read, Not friendly to developers • Pinpointing the problem takes long time • Server cluster need log aggregation • Helpful mostly in retrospect investigation • Most developers don’t know how to configure logs properly Pros • Verbose and flexible
  7. Self Reporting Framework 07:29 • Automatic method level performance reporting

    • Custom metering • Exception classifications • 4 severity levels (Recoverable, Warning, Error, Fatal) • Business Exceptions • System Exceptions
  8. App-Info Monitoring 07:29 • Expose via API as JSON •

    Collect Metrics via Nagios/ Graphite • Nagiosalerts based on app-info metrics
  9. App-Info Monitoring 07:29 Cons • Cores grained information for an

    overview • Too much information Pros • Detailed and easy view of a server • Almost no need to look at logs
  10. Log collections 07:29 • Client & Server logs are collected

    with Flume and Syslog-ng • Storm + Esperanalyzes log events and feeds Graphite • Store in Hadoop+HBasefor in-depth analysis
  11. Graphite 07:29 • All systems feed Graphite with metrics (Nagios,

    App-info, Storm) • Nagiosquery Graphite and triggers alerts
  12. Graphite 07:29 Cons • Not a dashboard (you can build

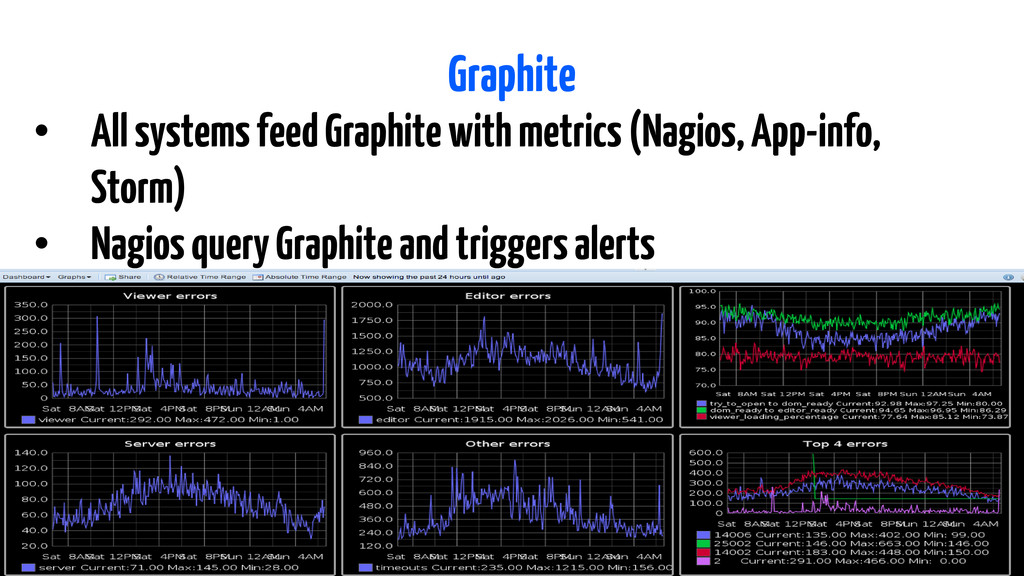
    dashboard on top of it) • Design data schema (hierarchy) in advance • Difficult to get scaling right Pros • Numerous formulas available • Share graphs • Easy to create new graphs
  13. New Relic 07:29 Pros • Easy to use –developer friendly

    • Service level overview (both cluster and single server) • Customizable dashboards • JVM profiler on production • Code instrumentation • Real User Monitoring • Hardware monitoring
  14. New Relic 07:29 Cons • No distributed transaction trace for

    specific server • No exception classification • A lot of false alarms due to misbehaving bots • False alarms for low throughput services • Hard to pinpoint a problematic server / operation