Upgrade to Pro — share decks privately, control downloads, hide ads and more …

May 2021 [Video]: Azure Monitoring by Thomas Hafermalz

May 2021 [Video]: Azure Monitoring by Thomas Hafermalz

Link to the recording: https://youtu.be/GT6BfGatLDQ

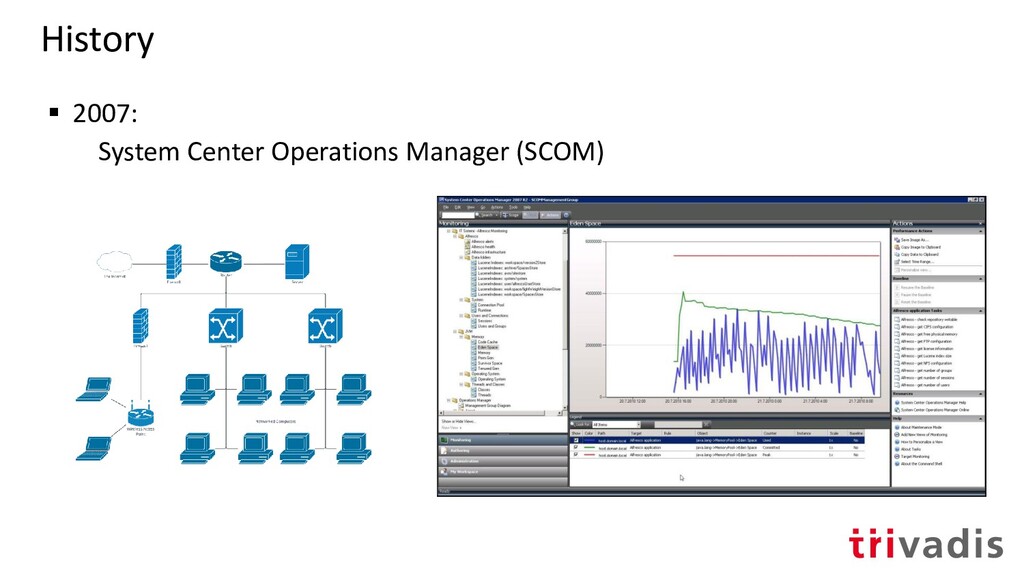
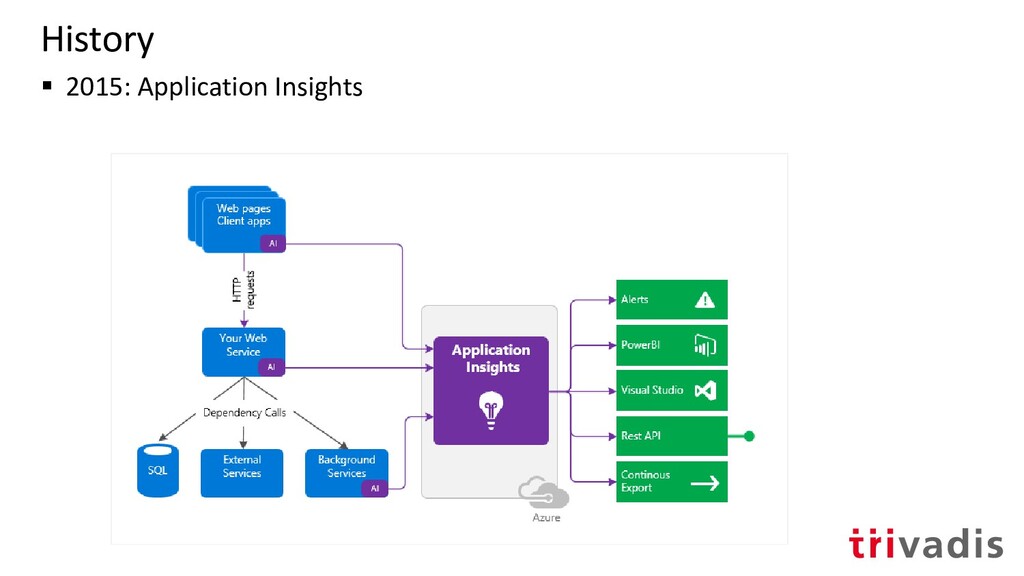
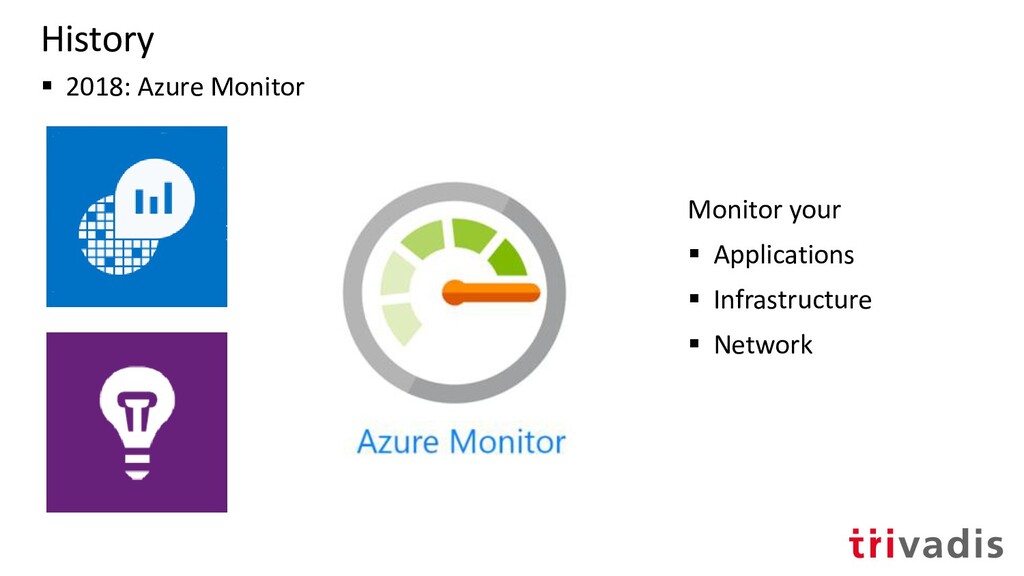
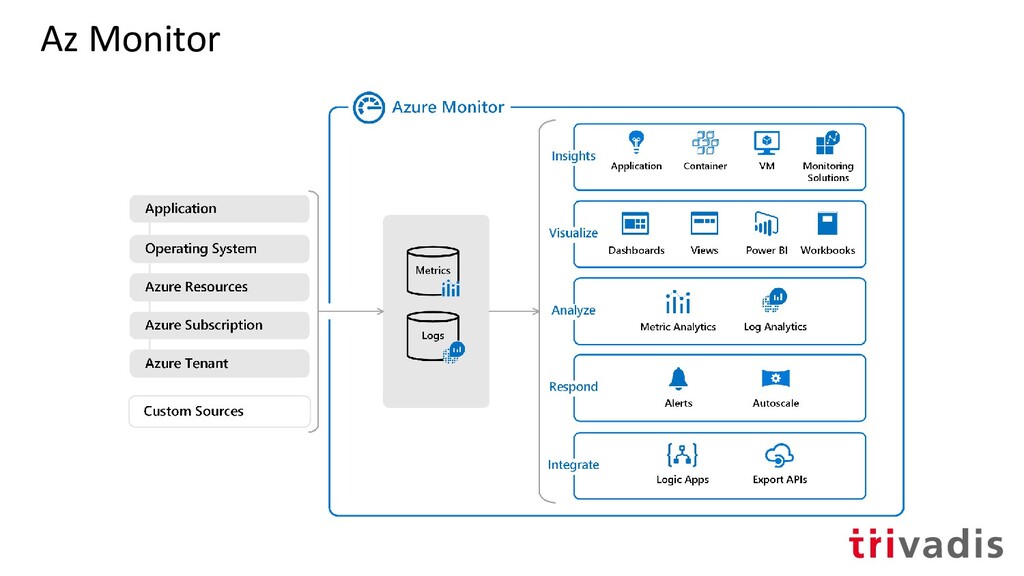
The Azure universe is enormous. A little bit smaller, but still impressive is the galaxy of monitoring options in Azure. Which data can and should be collected, what types of data are there? And after the collection, what can and should you do with the data? The history of Azure Monitoring spans over multiple products such as OMS, Log Analytics, Application Insights and Azure Monitor. Some of them are gone, others prevail, some have been cut into pieces.

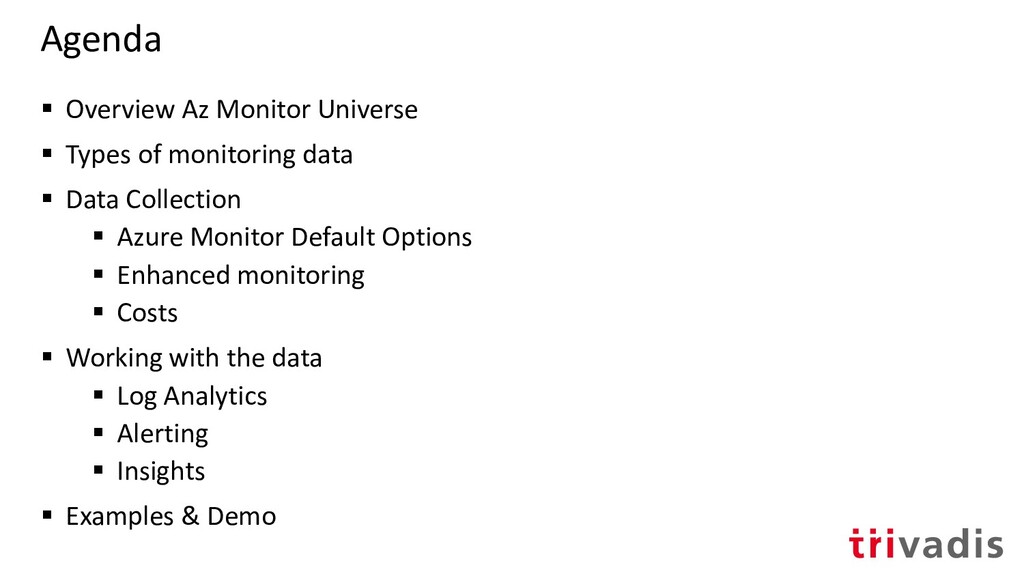
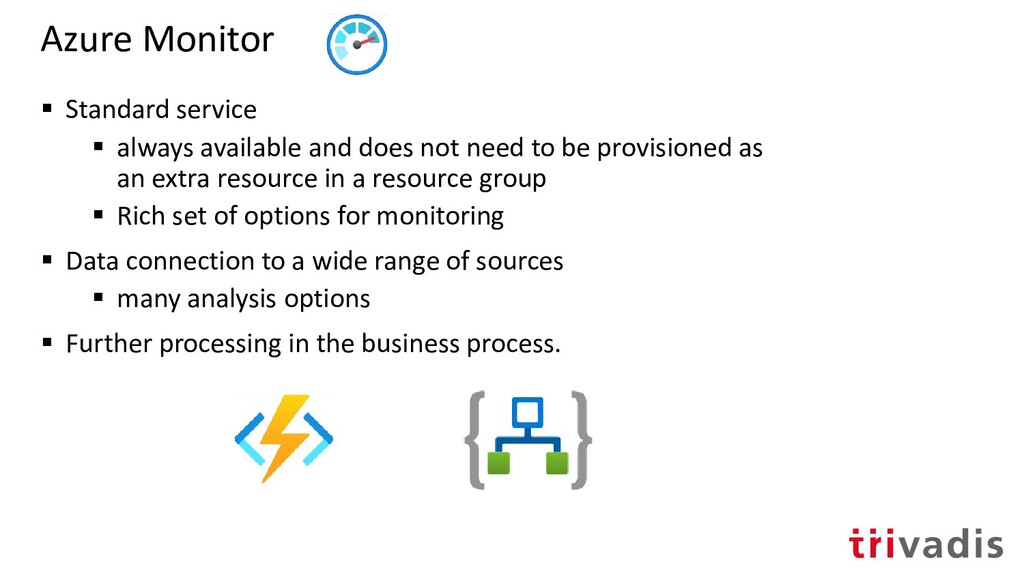
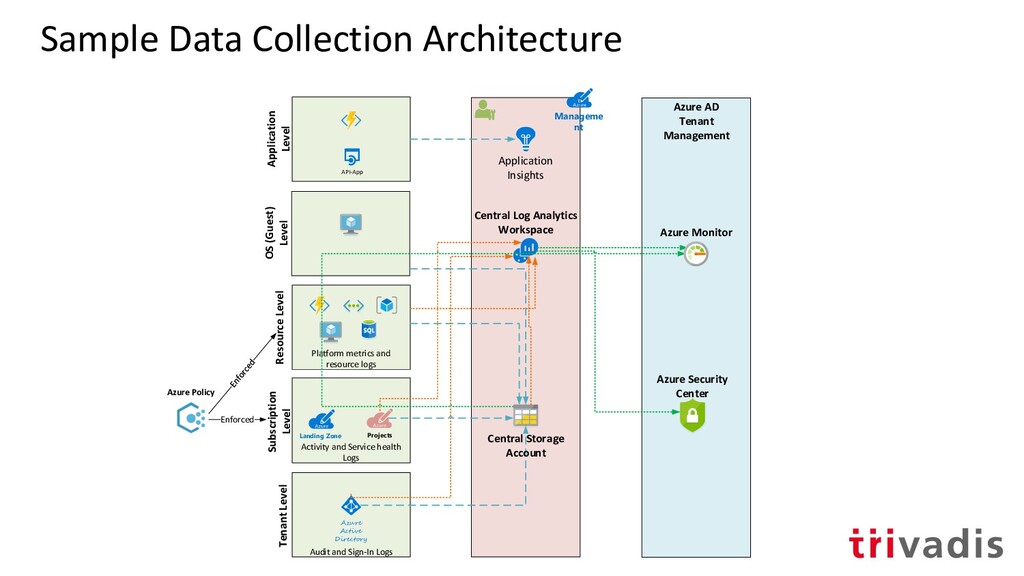
In this session Thomas will provide an overview of the Azure Monitor(ing) options. We will learn from where you can collect your telemetry data and how you can analyze it with queries and display options as well as how you can react on it. The session contains a lot of demos.
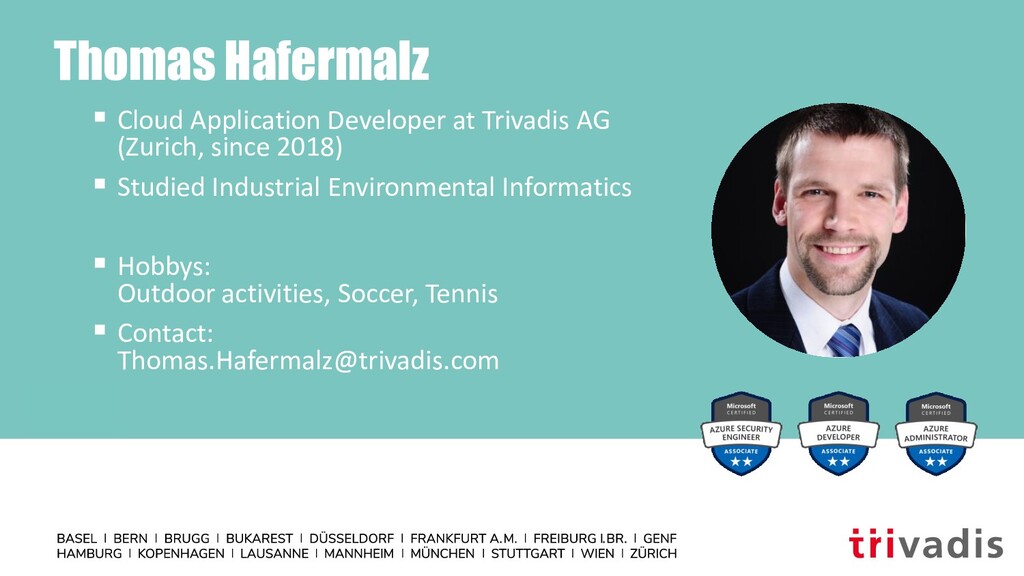
Bio:
Thomas works as an Azure Solution Architect for Trivadis, supporting companies from various industries on their way to cloud based workload solutions. He moved from Germany to Switzerland and is always on the run to learn new tech things. Before working in IT consulting, Thomas gained experiences in the automotive and aviation industries.

More information about him can be found at:
https://thomashafermalz.net/
https://linkedin.com/in/thomashafermalz

More Decks by Azure Zurich User Group

Other Decks in Technology

Transcript

  1. Agenda ▪ Overview Az Monitor Universe ▪ Types of monitoring

    data ▪ Data Collection ▪ Azure Monitor Default Options ▪ Enhanced monitoring ▪ Costs ▪ Working with the data ▪ Log Analytics ▪ Alerting ▪ Insights ▪ Examples & Demo
  2. Azure Monitor ▪ Standard service ▪ always available and does

    not need to be provisioned as an extra resource in a resource group ▪ Rich set of options for monitoring ▪ Data connection to a wide range of sources ▪ many analysis options ▪ Further processing in the business process.
  3. Data Types ▪ Metrics ▪ numeric data in a time-series

    database ▪ lightweight for real-time scenarios ▪ Logs ▪ Log Data in text form (JSON) ▪ Table data row with columns ▪ Insights ▪ customized monitoring experience for some services.
  4. Monitoring Levels ▪ Tenant (AAD Logs) ▪ sign-in activities AAD

    ▪ Subscription (Activity logs) ▪ Subscription operations & health of Azure itself ▪ Ressource Level (Diagnostics Settings) ▪ Metrics, configuration changes ▪ Guest OS Data ▪ VM-Data, performance counters and event logs, Boot diagnostics ▪ Application ▪ Performance and functionality of the code
  5. Sample Data Collection Architecture Azure Active Directory Manageme nt Projects

    Landing Zone Tenant Level Subscription Level Resource Level OS (Guest) Level Application Level Azure AD Tenant Management Enforced Azure Policy Azure Monitor Azure Security Center Audit and Sign-In Logs Activity and Service health Logs Platform metrics and resource logs Central Log Analytics Workspace Central Storage Account Application Insights API-App
  6. Standard Monitoring ▪ Automatic collection of different data ▪ Logs

    & Metrics ▪ Retention time of data differs: ▪ Activity Logs 90d ▪ Tenant Logs 30d ▪ Metrics 93d ▪ AppService / VM performance metrics ▪ Service Bus / Event Hub message traffic
  7. Enhanced Collection: Diagnostic settings ▪ Ressource Level ▪ Different options

    depending on each Azure resource ▪ Requests on storage account ▪ Web Application Firewall Logs ▪ 3 Options sending the data to: ▪ Log Analytics Workspace ▪ Storage Account ▪ Event hub
  8. Virtual Machine Data ▪ Performance counters ▪ Boot diagnostics ▪

    Event Logs / Sys Logs ▪ Security Center ▪ Crash dumps ▪ Network traffic
  9. VM Monitoring Agents ▪ Log Analytics agent ▪ -> Log

    Analytics Workspace ▪ Update Management, Change Tracking, State config, Security Center, Sentinel ▪ Azure Monitor agent (preview) ▪ -> AZ Monitor, Storage, Event Hub, Security Center, Sentinel ▪ Diagnostics extension ▪ -> Storage, Az Monitor Metrics, Event Hub, AppInsights ▪ Boot diagnostics ▪ Dependency agent ▪ processes on VM, external process dependencies ▪ Telegraf agent (Linux) -> Az Monitor Metrics
  10. Data store: Log Analytics Workspace ▪ Central data repository for

    collection ▪ Based on Azure Data Explorer Database ▪ Different sources = different tables ▪ at least one workspace needed for Log Analytics (or: AppInsights)
  11. Costs ▪ Daily data cap configurable ▪ Capacity Reservations for

    Workspace possible ▪ Archive in Storage account possible. Feature Free Further Data Ingress 5 GB/Month/Bill Account ~ 2,94 CHF/GB Data Retention 31 d (Workspace) 90 d (AppInsights) ~ 0,13 CHF/Month Data Export - ~ 0,32 CHF/GB Custom Metrics 150 MB/month CHF 0.254/MB: 150-100,000 MB CHF 0.149/MB: 100,000-250,000 MB CHF 0.061/MB: above 250,000 MB
  12. Log Analytics ▪ Term confusing (not Log Analytics Workspace or

    Log Analytics as part of an OMS Suite) ▪ Here: Area in the Azure Portal to query the log data
  13. KQL ▪ KQL (this context) = Kusto Query Language. ▪

    SQL-like query language, also based on tables and columns ▪ optimized for read queries of big data ▪ Invented for MSFT Big Data Telemetry Analysis ▪ Azure Data Explorer ▪ Used in ▪ Resource Graph ▪ Log Analytics Workspace ▪ Application Insights ▪ Data Explorer
  14. KQL ▪ Queries: ▪ Essentially: table source, filtered with conditions

    and possible projections ▪ The pipe | operator is used to pass the intermediate results. ▪ MSSQL: SELECT operation_Name, type, method FROM exceptions WHERE operation_Name = “Myfunction” ▪ → KQL: exceptions | where operation_Name == “Myfunction” | project operation_Name, type, method
  15. KQL ▪ Conditions ▪ Where, equals, in, or ▪ Search

    ▪ All tables, specific tables, case (in)sensitive, wildcards ▪ Group ▪ Summarize, avg, max, bin ▪ Select ▪ Project, extend, project-away, top, take, limit, distinct ▪ Charts ▪ Time chart, pie chart, bar charts
  16. Workbooks ▪ Kind of dashboard ▪ collections of KQL queries

    & chart ▪ Parametrizable, Results chainable
  17. Alerts ▪ Always based on log / metric data ▪

    Scope ▪ Which resource / event shall be checked? ▪ Definition of criterias ▪ Which condition / Query ▪ Definition of Action Groups ▪ Who should ne notified? ▪ Additional actions ▪ States: ▪ New, Acknowledged, Closed
  18. Alerts - Attention ▪ Specifying a query period in alert

    config actually already filters ▪ only this subset is queried, regardless of timeframe stated in the query ▪ selection of a stored query only takes over its text - no reference is made ▪ action groups and the alert rules are stored as resources in a resource group. However, these are hidden by default.
  19. Insights ▪ WTH is insights??? ▪ Applications Insights ▪ own

    resource ▪ “Additional” insights ▪ Tailored monitoring view for several resources ▪ VM Insights ▪ Container Insights ▪ Key Vault ▪ Storage ▪ Some require Workspace / configuration
  20. Application Insights ▪ Tracking web applications, Azure functions ▪ Requests

    ▪ response times, failure rates ▪ Page views , loading times ▪ Exceptions ▪ Host diagnostics ▪ Custom events & metrics ▪ Application Map ▪ Distributed Tracing
  21. Real World: File processing Error ▪ Error during file processing

    -> Log object to AppInsights (filepath, error code) ▪ Alert query, triggered from error code -> mail to dev team Alerts App Insights Error File Error Code, Path Web App Storage
  22. Real World: Dynamics 365 Telemetry logs ▪ D365 Plugin telemtrie

    data over Service Bus & Logic App -> AppInsights ▪ Using alerts & Workbooks to display / analyze performance issues
  23. Useful Links: ▪ Monitor Scopes: https://docs.microsoft.com/en-us/azure/azure-monitor/logs/scope ▪ Data / service:

    https://docs.microsoft.com/en-us/azure/azure-monitor/monitor- reference ▪ Table change AI classis: https://docs.microsoft.com/en-us/azure/azure- monitor/app/apm-tables ▪ Connect AI/LAW to Az Data Explorer: https://docs.microsoft.com/en-us/azure/data- explorer/query-monitor-data ▪ Style Workbooks: https://docs.microsoft.com/en-us/azure/azure- monitor/visualize/workbooks-grid-visualizations
  24. Thomas Hafermalz ▪ Cloud Application Developer at Trivadis AG (Zurich,

    since 2018) ▪ Studied Industrial Environmental Informatics ▪ Hobbys: Outdoor activities, Soccer, Tennis ▪ Contact: [email protected]