Upgrade to Pro
— share decks privately, control downloads, hide ads and more …
Speaker Deck
Features
Speaker Deck
PRO
Sign in
Sign up for free
Search
Search
2nd Python Bootcamp IAG - Displaying Data
Search
Sponsored
·
Your Podcast. Everywhere. Effortlessly.
Share. Educate. Inspire. Entertain. You do you. We'll handle the rest.
→
Bruno Quint
April 14, 2017
Programming
0
48
2nd Python Bootcamp IAG - Displaying Data
Bruno Quint
April 14, 2017
Tweet
Share
More Decks by Bruno Quint
See All by Bruno Quint
2nd Python Bootcamp IAG - Basics II
b1quint
0
68
2nd Python Bootcamp IAG - Pretty and Healthy
b1quint
0
190
2nd Python Bootcamp IAG - Toolboxes
b1quint
0
47
2nd Python Bootcamp IAG - Basics I
b1quint
0
60
Other Decks in Programming
See All in Programming
2026年は Rust 置き換えが流行る! / 20260220-niigata-5min-tech
girigiribauer
0
230
Claude Codeログ基盤の構築
giginet
PRO
7
2.5k
Takumiから考えるSecurity_Maturity_Model.pdf
gessy0129
1
140
「やめとこ」がなくなった — 1月にZennを始めて22本書いた AI共創開発のリアル
atani14
0
370
ふつうのRubyist、ちいさなデバイス、大きな一年 / Ordinary Rubyists, Tiny Devices, Big Year
chobishiba
1
430
どんと来い、データベース信頼性エンジニアリング / Introduction to DBRE
nnaka2992
1
270
CSC307 Lecture 14
javiergs
PRO
0
470
AIコーディングの理想と現実 2026 | AI Coding: Expectations vs. Reality 2026
tomohisa
0
1.2k
AWS Infrastructure as Code の新機能 2025 総まとめ 〜SA 4人による怒涛のデモ祭り〜
konokenj
10
3.3k
CSC307 Lecture 13
javiergs
PRO
0
320
Goの型安全性で実現する複数プロダクトの権限管理
ishikawa_pro
1
120
Docコメントで始める簡単ガードレール
keisukeikeda
1
110
Featured
See All Featured
The World Runs on Bad Software
bkeepers
PRO
72
12k
[Rails World 2023 - Day 1 Closing Keynote] - The Magic of Rails
eileencodes
38
2.8k
Why Our Code Smells
bkeepers
PRO
340
58k
Lessons Learnt from Crawling 1000+ Websites
charlesmeaden
PRO
1
1.1k
Navigating Algorithm Shifts & AI Overviews - #SMXNext
aleyda
1
1.2k
The SEO Collaboration Effect
kristinabergwall1
0
390
Scaling GitHub
holman
464
140k
Chrome DevTools: State of the Union 2024 - Debugging React & Beyond
addyosmani
10
1.1k
エンジニアに許された特別な時間の終わり
watany
106
240k
Digital Projects Gone Horribly Wrong (And the UX Pros Who Still Save the Day) - Dean Schuster
uxyall
0
670
Primal Persuasion: How to Engage the Brain for Learning That Lasts
tmiket
0
290
Understanding Cognitive Biases in Performance Measurement
bluesmoon
32
2.8k
Transcript
Python Bootcamp Data Display with MatPlotLib PhD Bruno C. Quint
[email protected]
Resident Astronomer at SOAR Telescope https://github.com/b1quint/PythonBootcamp2017
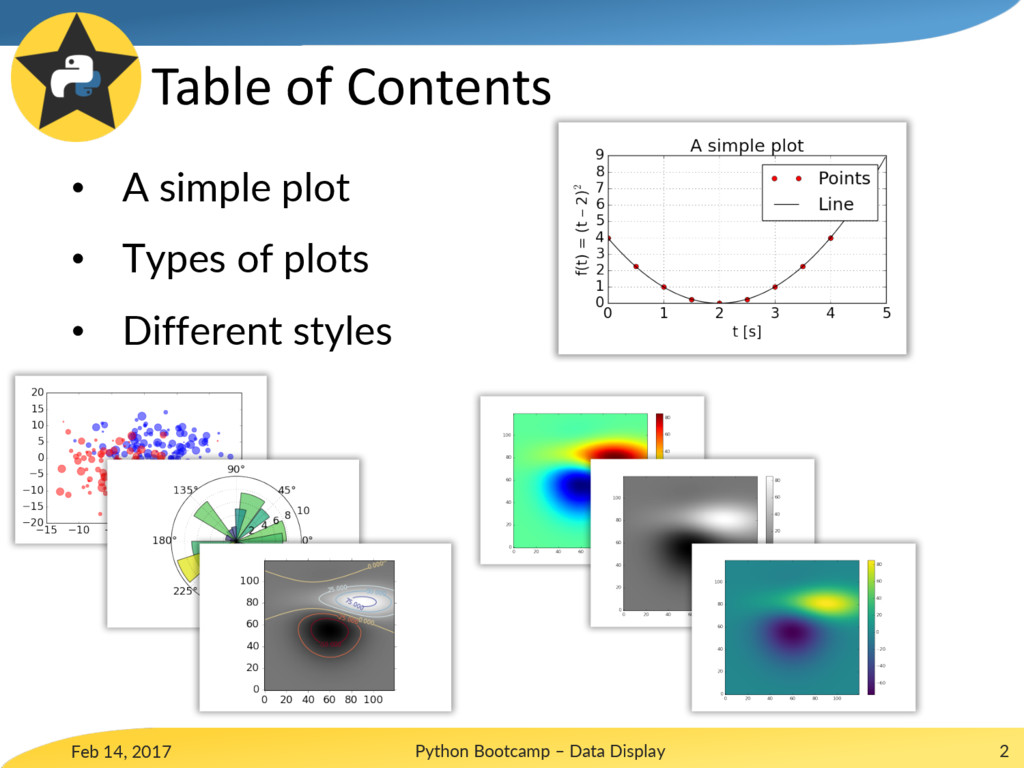
Table of Contents Feb 14, 2017 Python Bootcamp – Data
Display 2 • A simple plot • Types of plots • Different styles
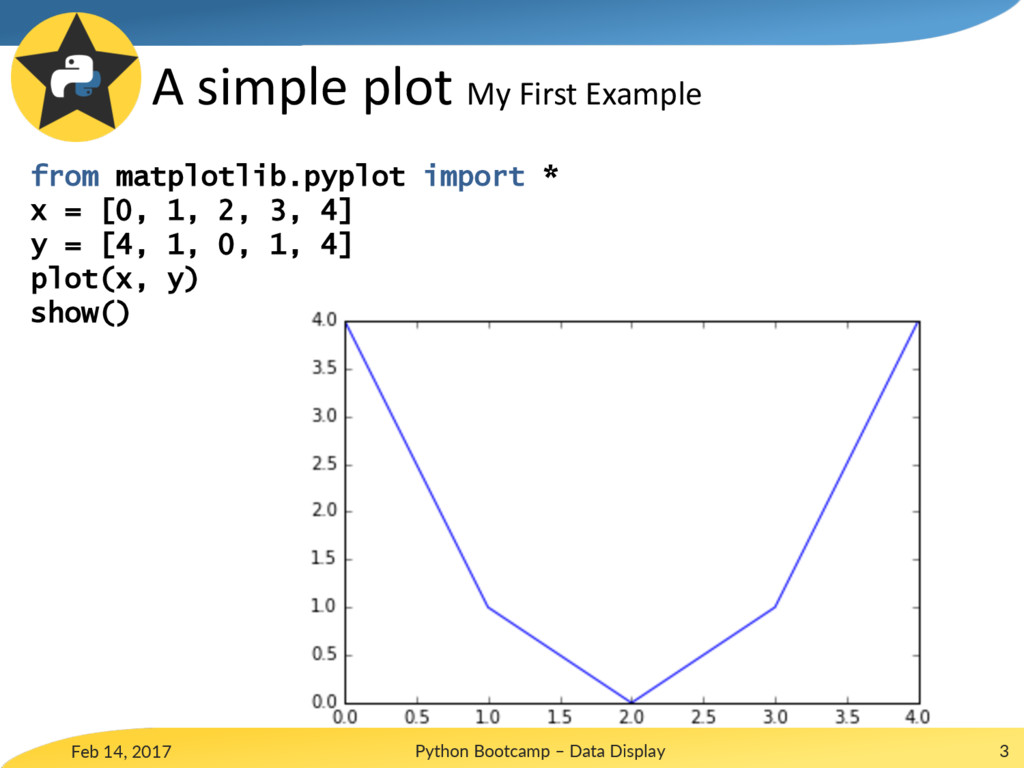
A simple plot My First Example Feb 14, 2017 Python
Bootcamp – Data Display 3 from matplotlib.pyplot import * x = [0, 1, 2, 3, 4] y = [4, 1, 0, 1, 4] plot(x, y) show()
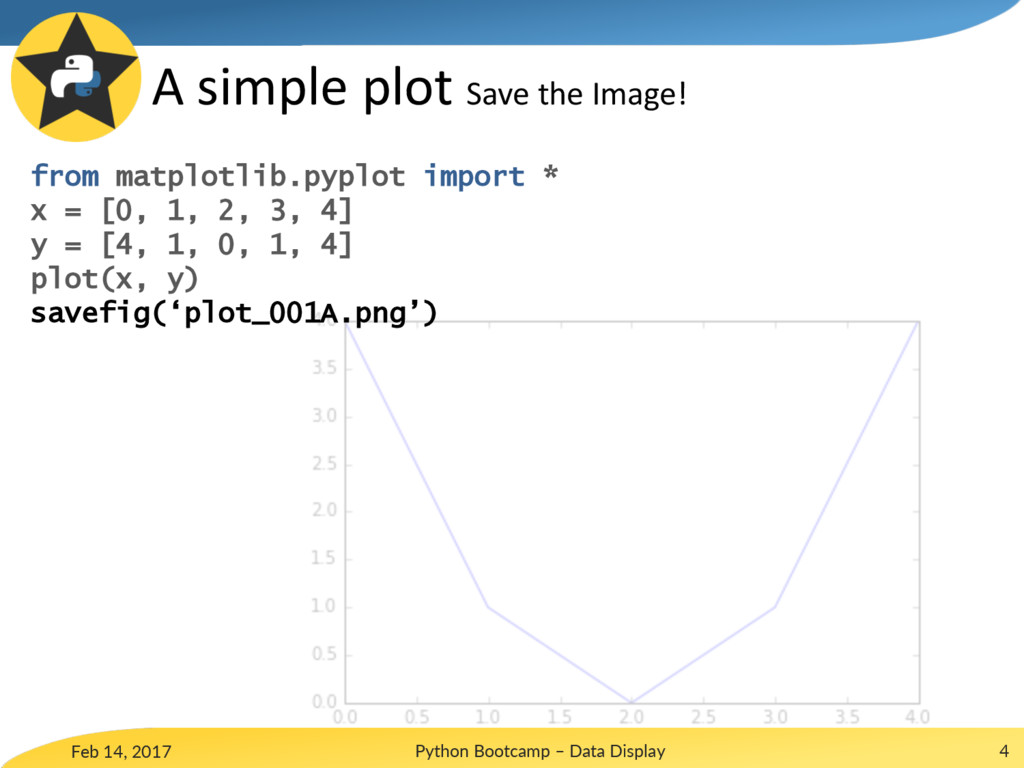
A simple plot Save the Image! Feb 14, 2017 Python
Bootcamp – Data Display 4 from matplotlib.pyplot import * x = [0, 1, 2, 3, 4] y = [4, 1, 0, 1, 4] plot(x, y) savefig(‘plot_001A.png’)
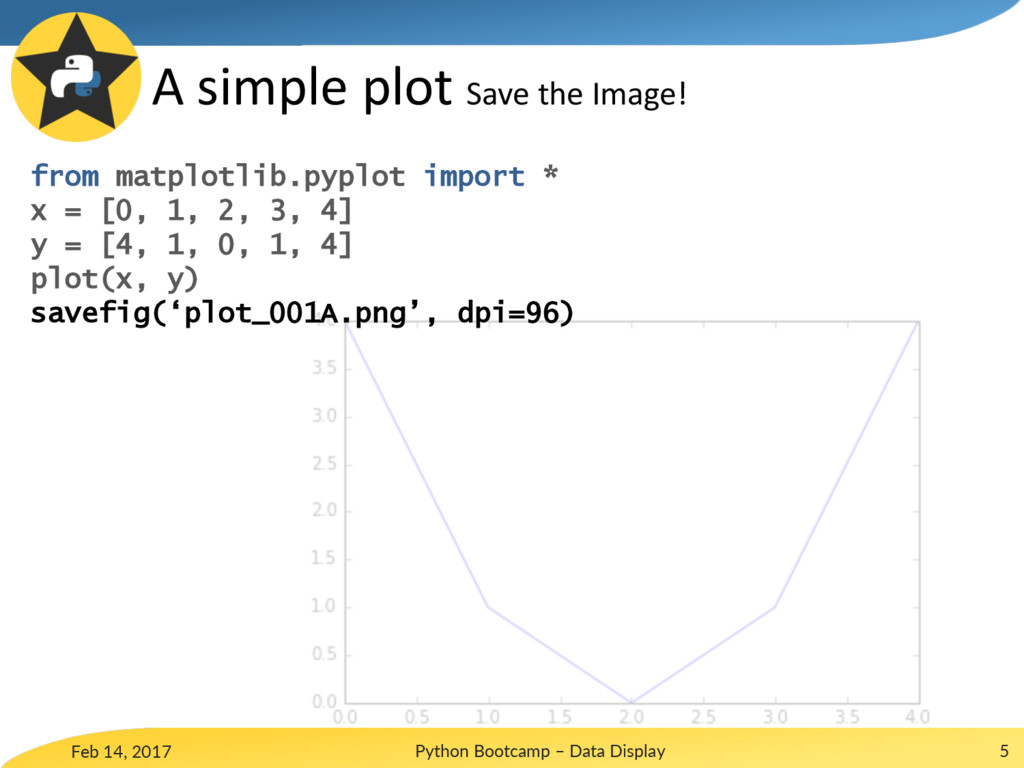
A simple plot Save the Image! Feb 14, 2017 Python
Bootcamp – Data Display 5 from matplotlib.pyplot import * x = [0, 1, 2, 3, 4] y = [4, 1, 0, 1, 4] plot(x, y) savefig(‘plot_001A.png’, dpi=96)
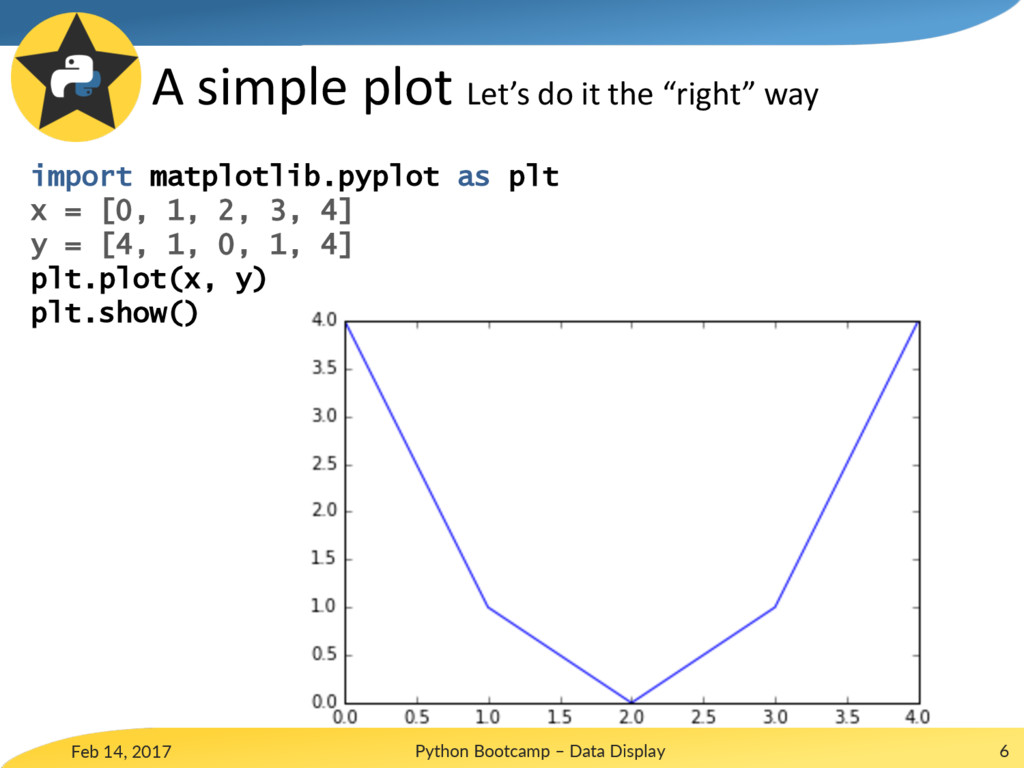
A simple plot Let’s do it the “right” way Feb
14, 2017 Python Bootcamp – Data Display 6 import matplotlib.pyplot as plt x = [0, 1, 2, 3, 4] y = [4, 1, 0, 1, 4] plt.plot(x, y) plt.show()
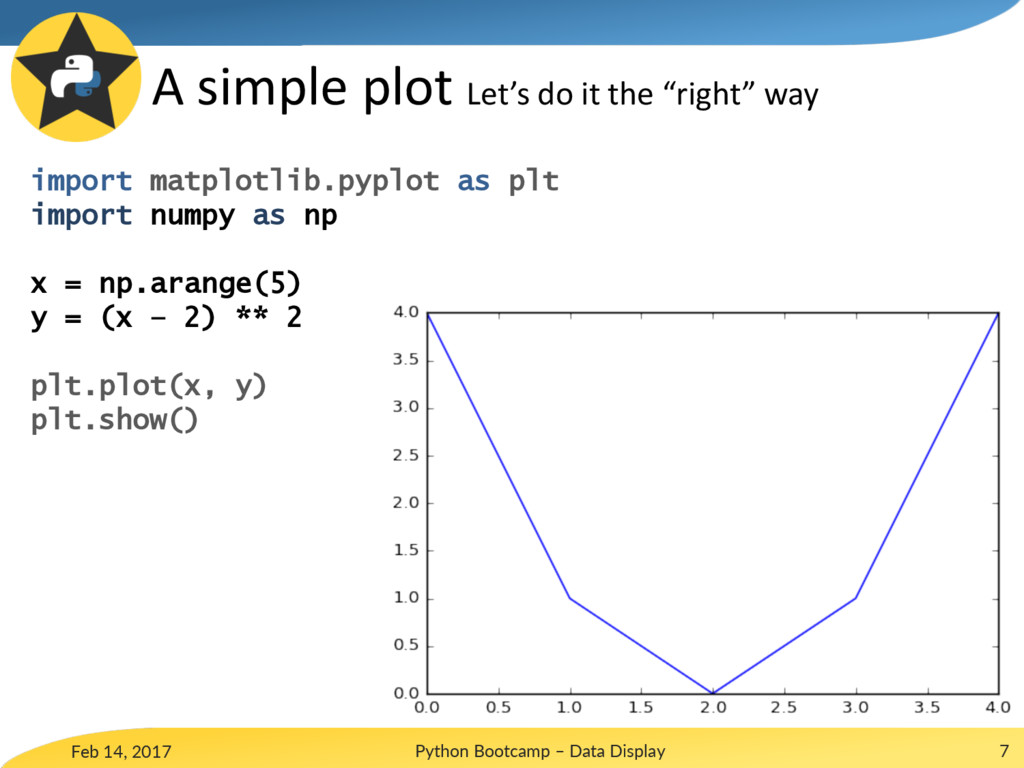
A simple plot Let’s do it the “right” way Feb
14, 2017 Python Bootcamp – Data Display 7 import matplotlib.pyplot as plt import numpy as np x = np.arange(5) y = (x – 2) ** 2 plt.plot(x, y) plt.show()
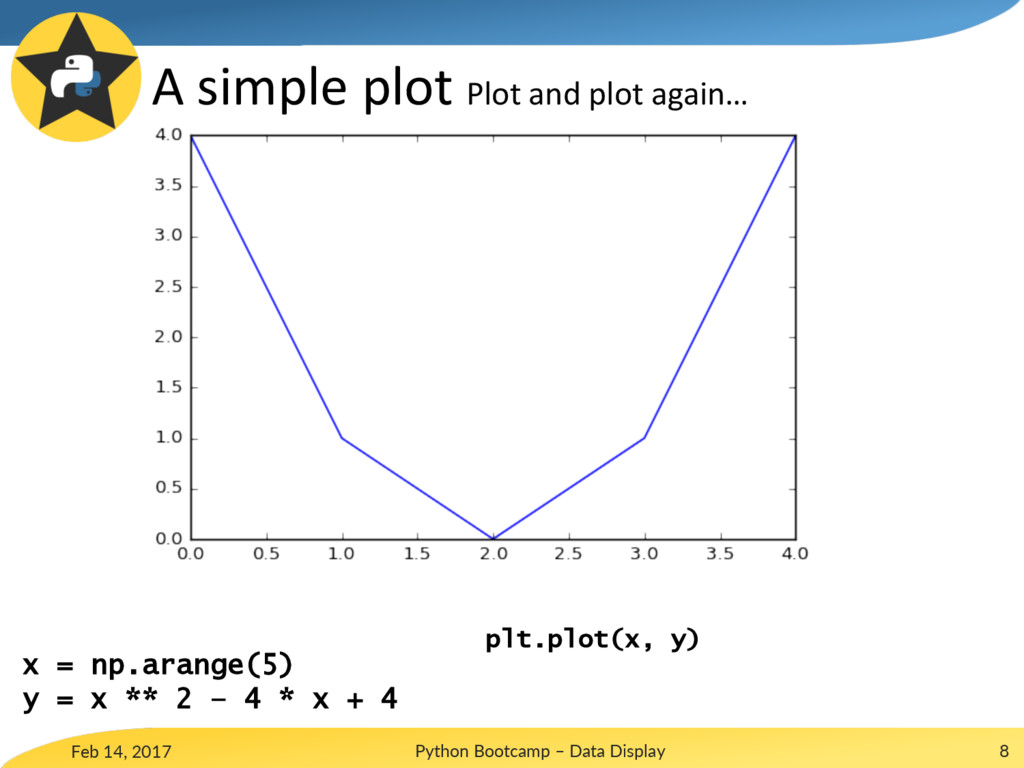
Feb 14, 2017 Python Bootcamp – Data Display 8 x
= np.arange(5) y = x ** 2 – 4 * x + 4 A simple plot Plot and plot again… plt.plot(x, y)
Feb 14, 2017 Python Bootcamp – Data Display 9 x
= np.arange(5) y = x ** 2 – 4 * x + 4 A simple plot Plot and plot again… plt.plot(x, y) plt.plot(x, y)
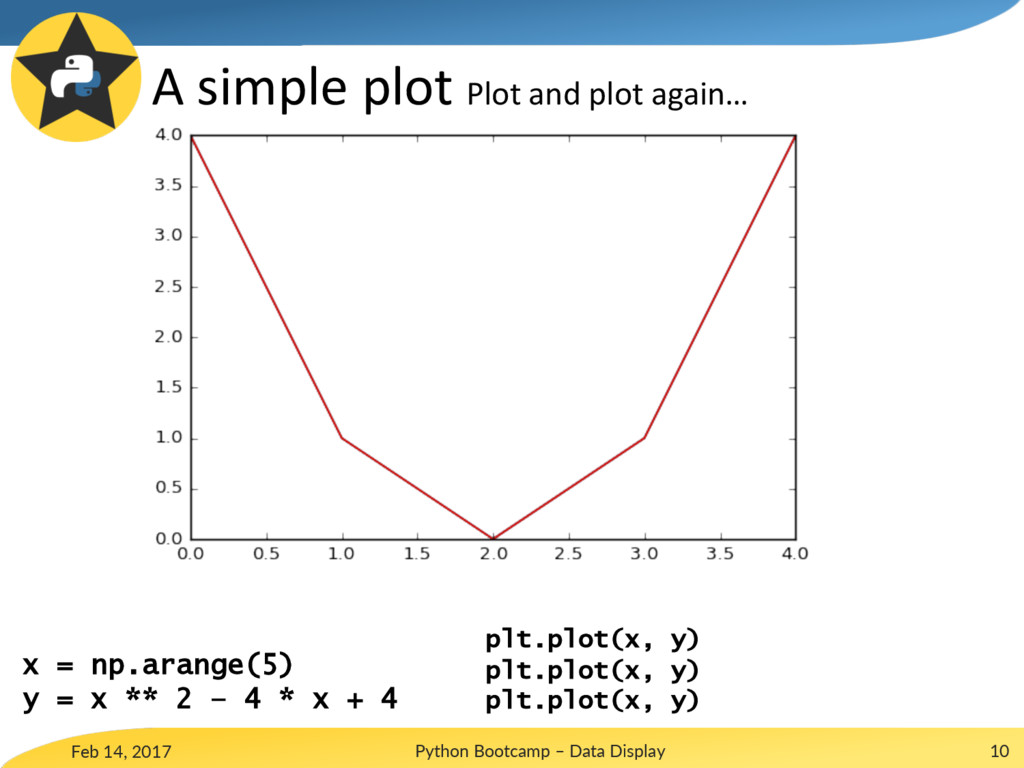
Feb 14, 2017 Python Bootcamp – Data Display 10 x
= np.arange(5) y = x ** 2 – 4 * x + 4 A simple plot Plot and plot again… plt.plot(x, y) plt.plot(x, y) plt.plot(x, y)
A simple plot Let’s do it the “right” way Feb
14, 2017 Python Bootcamp – Data Display 11 import matplotlib.pyplot as plt import numpy as np x = np.arange(-5, 5, 0.1) y = (x – 2) ** 2 plt.plot(x, y) plt.show()
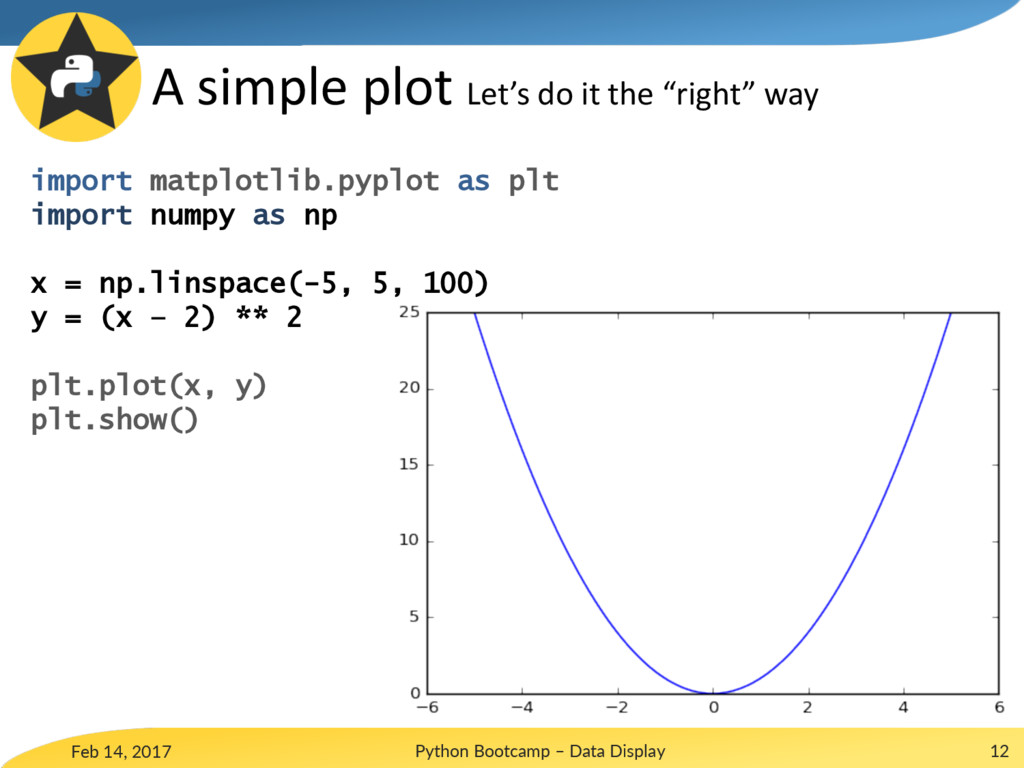
A simple plot Let’s do it the “right” way Feb
14, 2017 Python Bootcamp – Data Display 12 import matplotlib.pyplot as plt import numpy as np x = np.linspace(-5, 5, 100) y = (x – 2) ** 2 plt.plot(x, y) plt.show()
Feb 14, 2017 Python Bootcamp – Data Display 13 A
simple plot Plot with style def f(t): return (t - 2) ** 2
Feb 14, 2017 Python Bootcamp – Data Display 14 A
simple plot Plot with style def f(t): return (t - 2) ** 2 t1 = np.arange(0.0, 5.0, 0.5) t2 = np.arange(0.0, 5.0, 0.02)
Feb 14, 2017 Python Bootcamp – Data Display 15 A
simple plot Plot with style def f(t): return (t - 2) ** 2 t1 = np.arange(0.0, 5.0, 0.5) t2 = np.arange(0.0, 5.0, 0.02) plt.plot(t1, f(t1), 'ro’) plt.plot(t2, f(t2), 'k')
Feb 14, 2017 Python Bootcamp – Data Display 16 A
simple plot Plot with style def f(t): return (t - 2) ** 2 t1 = np.arange(0.0, 5.0, 0.5) t2 = np.arange(0.0, 5.0, 0.02) plt.plot(t1, f(t1), 'ro', t2, f(t2), 'k')
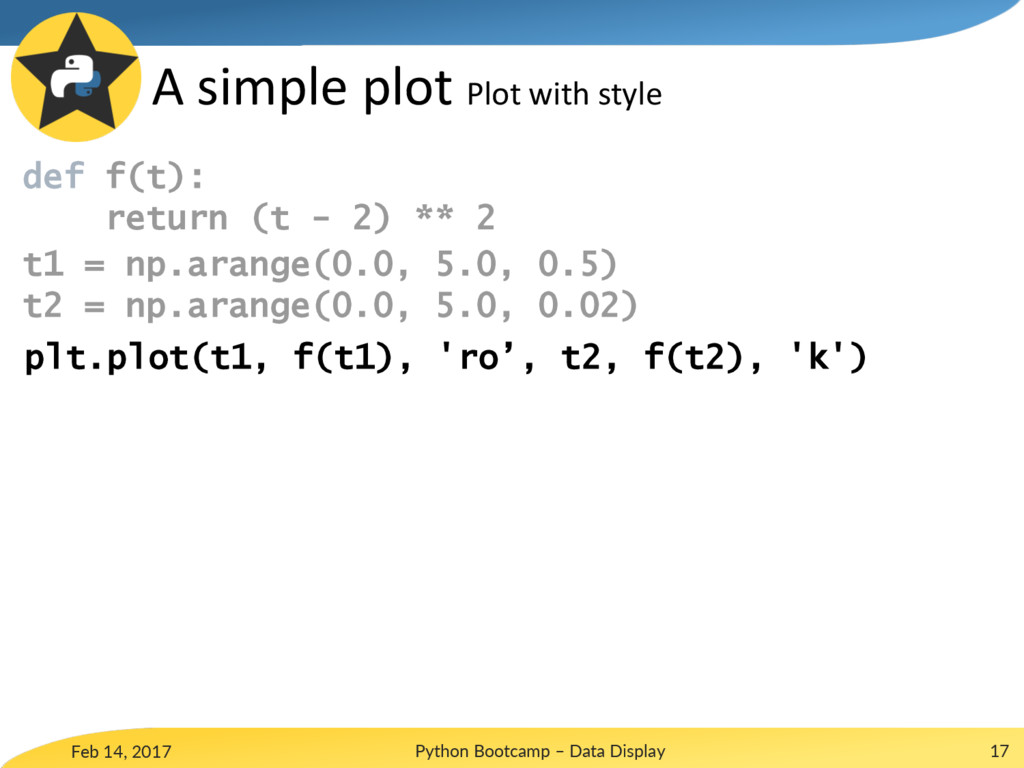
Feb 14, 2017 Python Bootcamp – Data Display 17 A
simple plot Plot with style def f(t): return (t - 2) ** 2 t1 = np.arange(0.0, 5.0, 0.5) t2 = np.arange(0.0, 5.0, 0.02) plt.plot(t1, f(t1), 'ro’, t2, f(t2), 'k')
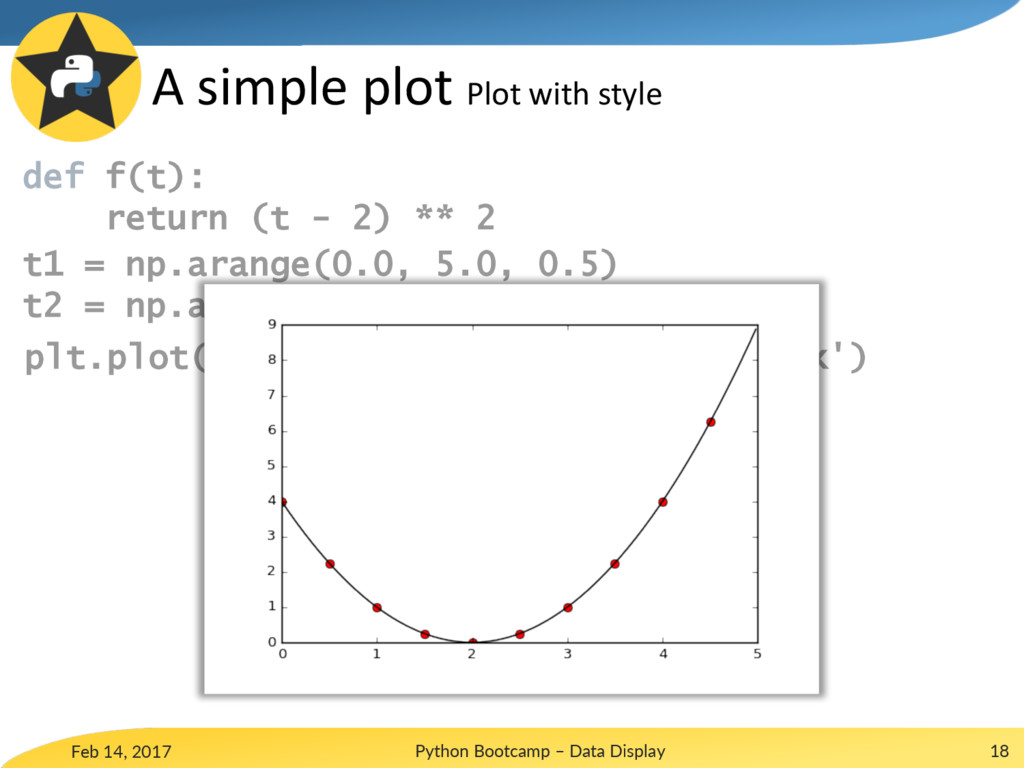
Feb 14, 2017 Python Bootcamp – Data Display 18 A
simple plot Plot with style def f(t): return (t - 2) ** 2 t1 = np.arange(0.0, 5.0, 0.5) t2 = np.arange(0.0, 5.0, 0.02) plt.plot(t1, f(t1), 'ro', t2, f(t2), 'k')
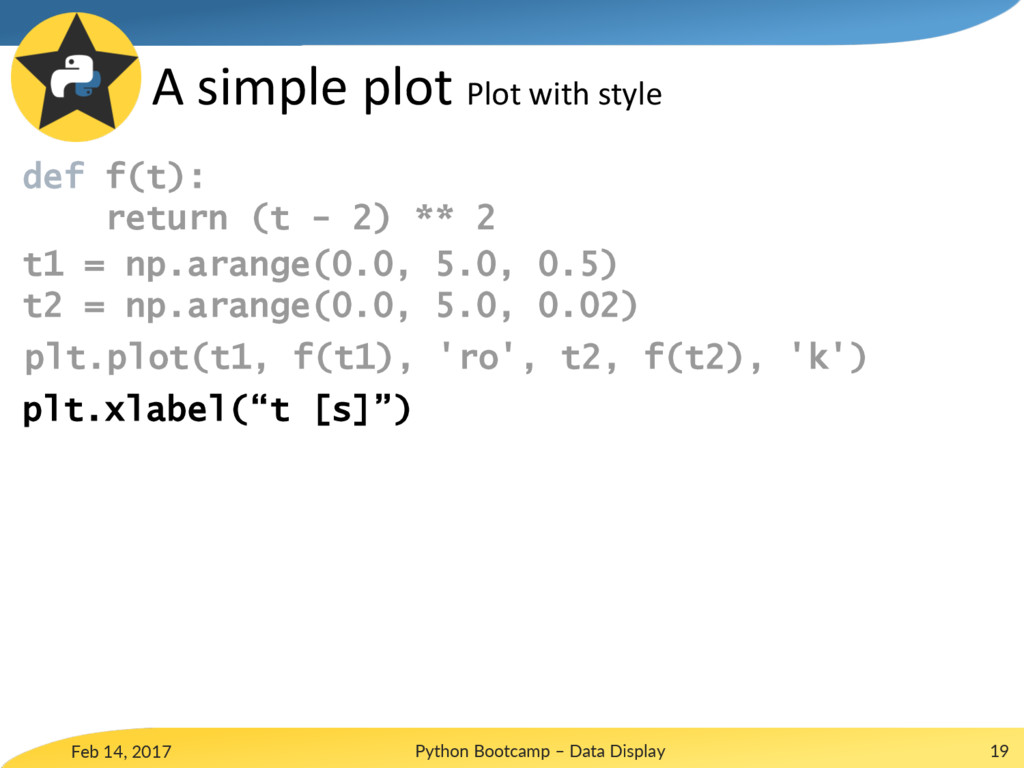
Feb 14, 2017 Python Bootcamp – Data Display 19 A
simple plot Plot with style def f(t): return (t - 2) ** 2 t1 = np.arange(0.0, 5.0, 0.5) t2 = np.arange(0.0, 5.0, 0.02) plt.plot(t1, f(t1), 'ro', t2, f(t2), 'k') plt.xlabel(“t [s]”)
plt.xlabel(“t [s]”) Feb 14, 2017 Python Bootcamp – Data Display
20 A simple plot Plot with style def f(t): return (t - 2) ** 2 t1 = np.arange(0.0, 5.0, 0.5) t2 = np.arange(0.0, 5.0, 0.02) plt.plot(t1, f(t1), 'ro', t2, f(t2), 'k')
plt.xlabel(“t [s]”) Feb 14, 2017 Python Bootcamp – Data Display
21 A simple plot Plot with style def f(t): return (t - 2) ** 2 t1 = np.arange(0.0, 5.0, 0.5) t2 = np.arange(0.0, 5.0, 0.02) plt.plot(t1, f(t1), 'ro', t2, f(t2), 'k') plt.ylabel(u"f(t) = (t – 2)$^2$")
plt.xlabel(“t [s]”) Feb 14, 2017 Python Bootcamp – Data Display
22 A simple plot Plot with style def f(t): return (t - 2) ** 2 t1 = np.arange(0.0, 5.0, 0.5) t2 = np.arange(0.0, 5.0, 0.02) plt.plot(t1, f(t1), 'ro', t2, f(t2), 'k') plt.ylabel(u"f(t) = (t – 2)$^2$")
plt.xlabel(“t [s]”, fontsize=24) Feb 14, 2017 Python Bootcamp – Data
Display 23 A simple plot Plot with style def f(t): return (t - 2) ** 2 t1 = np.arange(0.0, 5.0, 0.5) t2 = np.arange(0.0, 5.0, 0.02) plt.plot(t1, f(t1), 'ro', t2, f(t2), 'k') plt.ylabel(u"f(t) = (t – 2)$^2$”, fontsize=24)
plt.xlabel(“t [s]”, fontsize=24) Feb 14, 2017 Python Bootcamp – Data
Display 24 A simple plot Plot with style def f(t): return (t - 2) ** 2 t1 = np.arange(0.0, 5.0, 0.5) t2 = np.arange(0.0, 5.0, 0.02) plt.plot(t1, f(t1), 'ro', t2, f(t2), 'k') plt.ylabel(u"f(t) = (t – 2)$^2$”, fontsize=24)
plt.xlabel(“t [s]”, fontsize=24) Feb 14, 2017 Python Bootcamp – Data
Display 25 A simple plot Plot with style def f(t): return (t - 2) ** 2 t1 = np.arange(0.0, 5.0, 0.5) t2 = np.arange(0.0, 5.0, 0.02) plt.plot(t1, f(t1), 'ro', t2, f(t2), 'k') plt.ylabel(u"f(t) = (t – 2)$^2$”, fontsize=24) plt.xticks(fontsize=18)
plt.xlabel(“t [s]”, fontsize=24) Feb 14, 2017 Python Bootcamp – Data
Display 26 A simple plot Plot with style def f(t): return (t - 2) ** 2 t1 = np.arange(0.0, 5.0, 0.5) t2 = np.arange(0.0, 5.0, 0.02) plt.plot(t1, f(t1), 'ro', t2, f(t2), 'k') plt.ylabel(u"f(t) = (t – 2)$^2$”, fontsize=24)
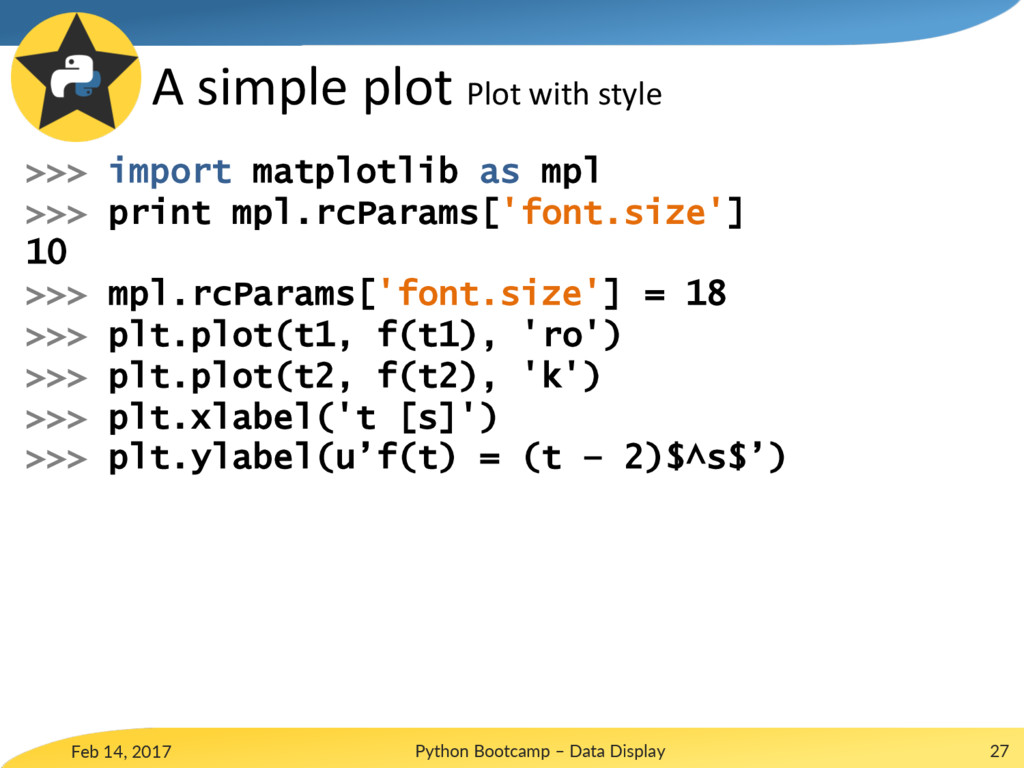
Feb 14, 2017 Python Bootcamp – Data Display 27 A
simple plot Plot with style >>> import matplotlib as mpl >>> print mpl.rcParams['font.size'] 10 >>> mpl.rcParams['font.size'] = 18 >>> plt.plot(t1, f(t1), 'ro') >>> plt.plot(t2, f(t2), 'k') >>> plt.xlabel('t [s]') >>> plt.ylabel(u’f(t) = (t – 2)$^s$’)
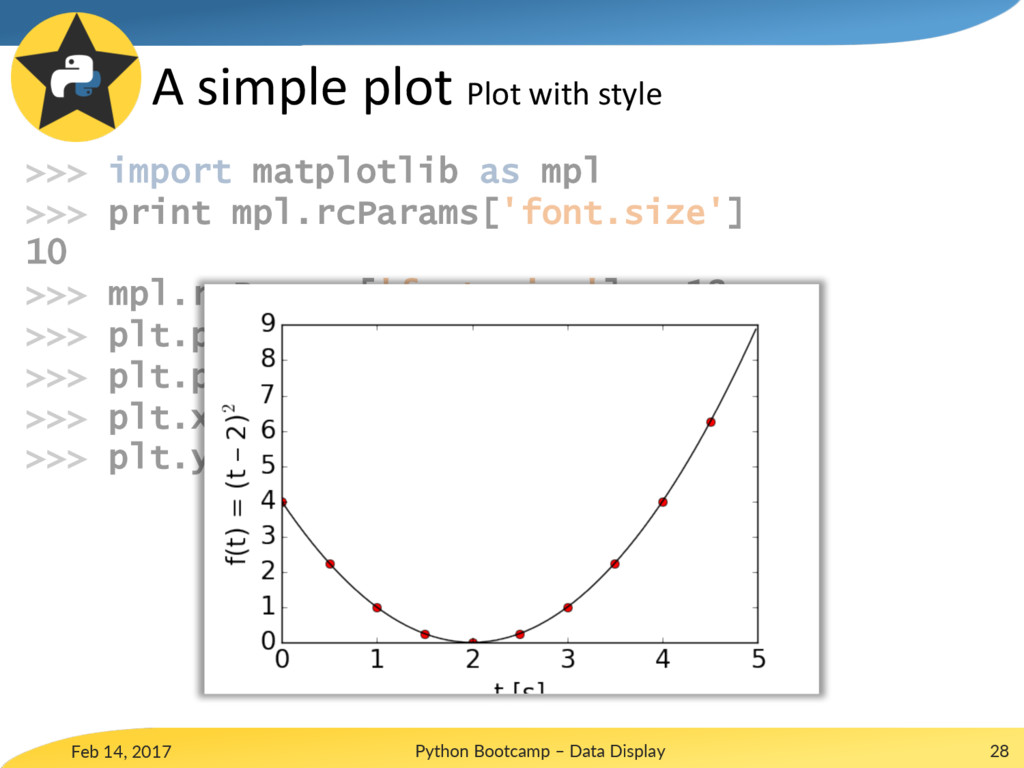
Feb 14, 2017 Python Bootcamp – Data Display 28 A
simple plot Plot with style >>> import matplotlib as mpl >>> print mpl.rcParams['font.size'] 10 >>> mpl.rcParams['font.size'] = 18 >>> plt.plot(t1, f(t1), 'ro') >>> plt.plot(t2, f(t2), 'k') >>> plt.xlabel('t [s]') >>> plt.ylabel(u’f(t) = (t – 2)$^s$’)
Feb 14, 2017 Python Bootcamp – Data Display 29 A
simple plot Plot with style >>> plt.title(“A simple plot”)
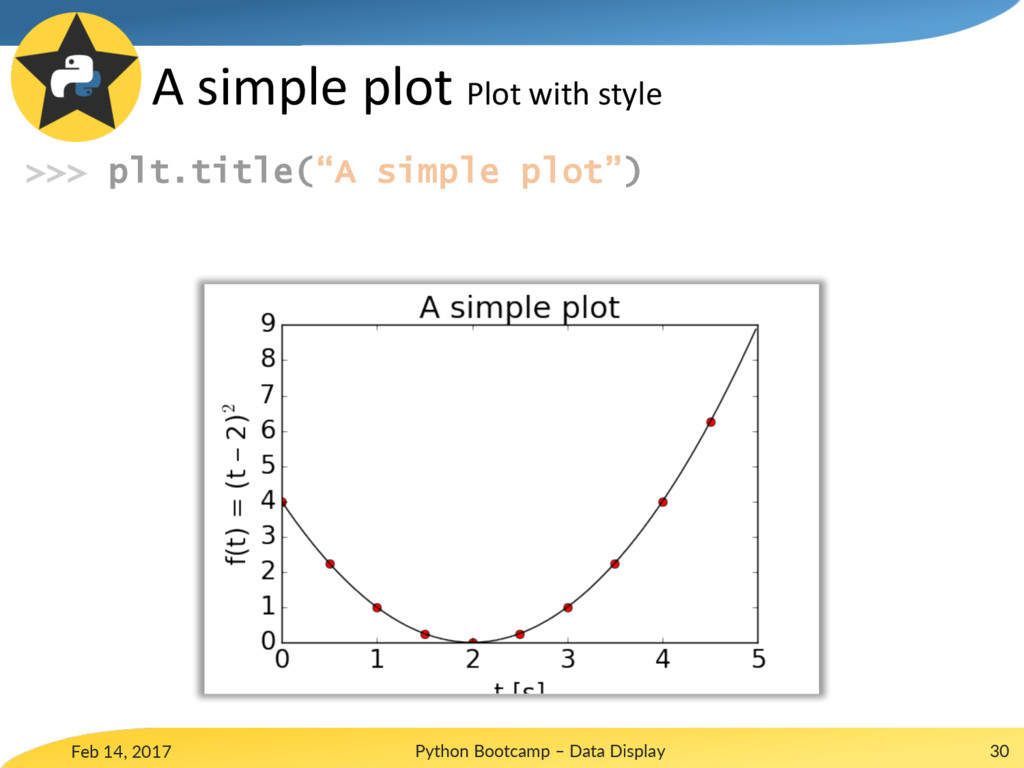
Feb 14, 2017 Python Bootcamp – Data Display 30 A
simple plot Plot with style >>> plt.title(“A simple plot”)
Feb 14, 2017 Python Bootcamp – Data Display 31 A
simple plot Plot with style >>> plt.grid()
Feb 14, 2017 Python Bootcamp – Data Display 32 A
simple plot Plot with style >>> plt.grid()
Feb 14, 2017 Python Bootcamp – Data Display 33 A
simple plot Plot with style >>> plt.plot(t1, f(t1), 'ro', label="Points") >>> plt.plot(t2, f(t2), 'k', label="Line") >>> plt.legend()
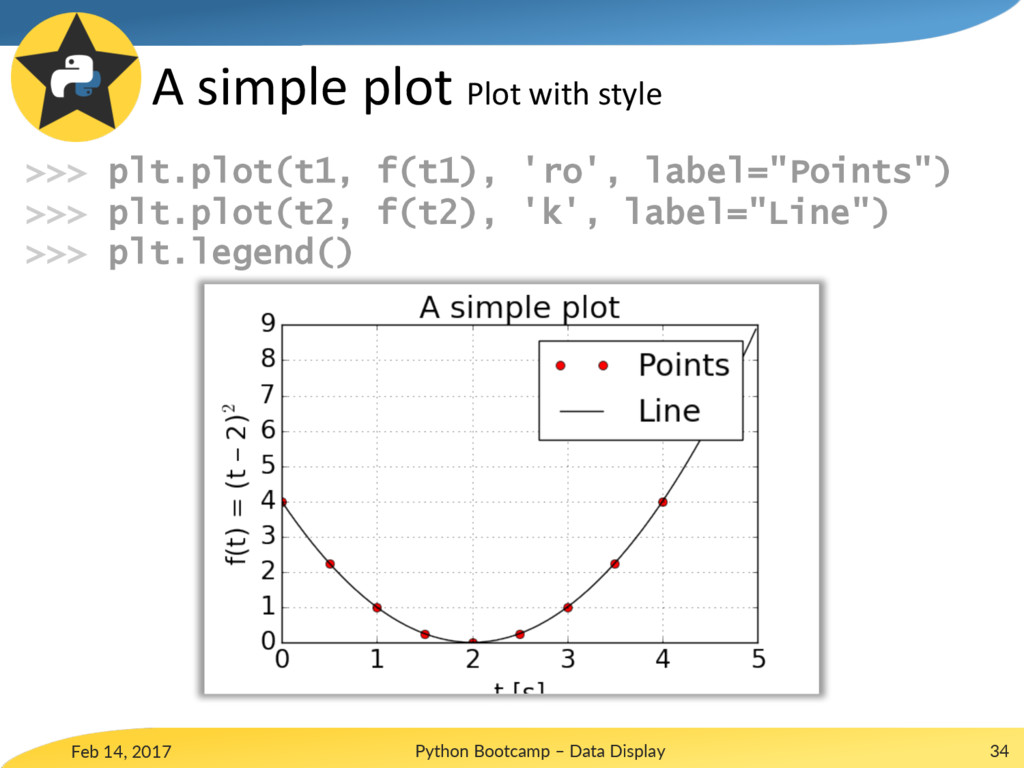
Feb 14, 2017 Python Bootcamp – Data Display 34 A
simple plot Plot with style >>> plt.plot(t1, f(t1), 'ro', label="Points") >>> plt.plot(t2, f(t2), 'k', label="Line") >>> plt.legend()
Feb 14, 2017 Python Bootcamp – Data Display 35 A
simple plot Plot with style >>> plt.plot(t1, f(t1), 'ro', label="Points") >>> plt.plot(t2, f(t2), 'k', label="Line") >>> plt.legend()
Feb 14, 2017 Python Bootcamp – Data Display 36 A
simple plot Plot with style >>> plt.tight_layout()
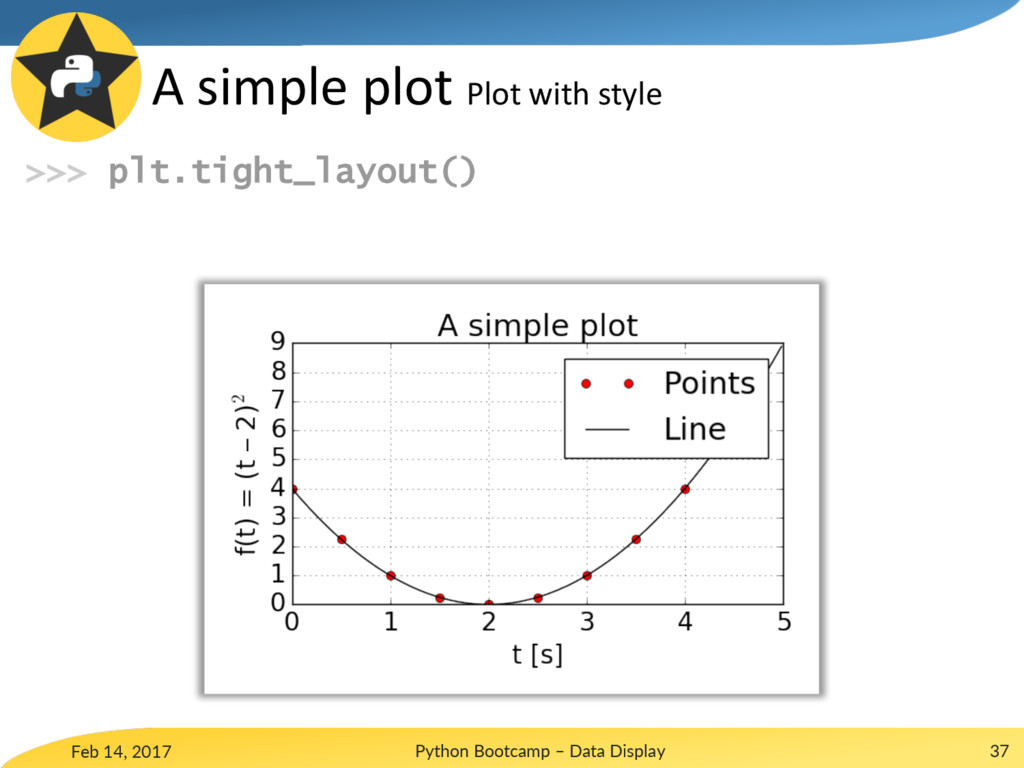
Feb 14, 2017 Python Bootcamp – Data Display 37 A
simple plot Plot with style >>> plt.tight_layout()
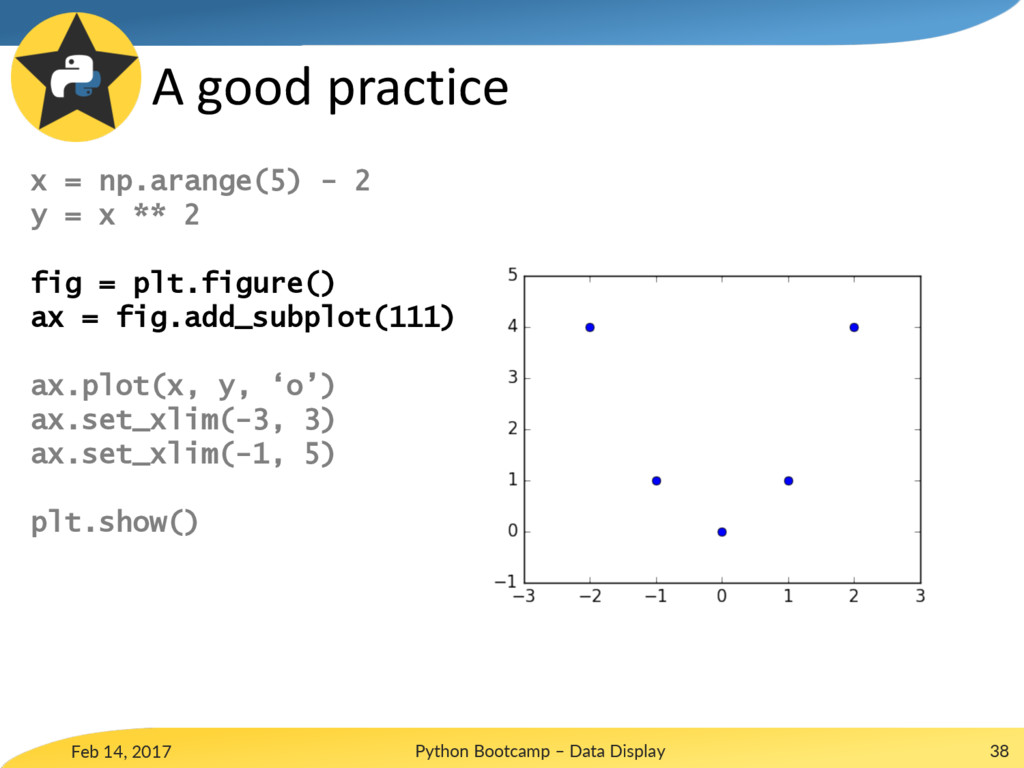
Feb 14, 2017 Python Bootcamp – Data Display 38 A
good practice x = np.arange(5) - 2 y = x ** 2 fig = plt.figure() ax = fig.add_subplot(111) ax.plot(x, y, ‘o’) ax.set_xlim(-3, 3) ax.set_xlim(-1, 5) plt.show()
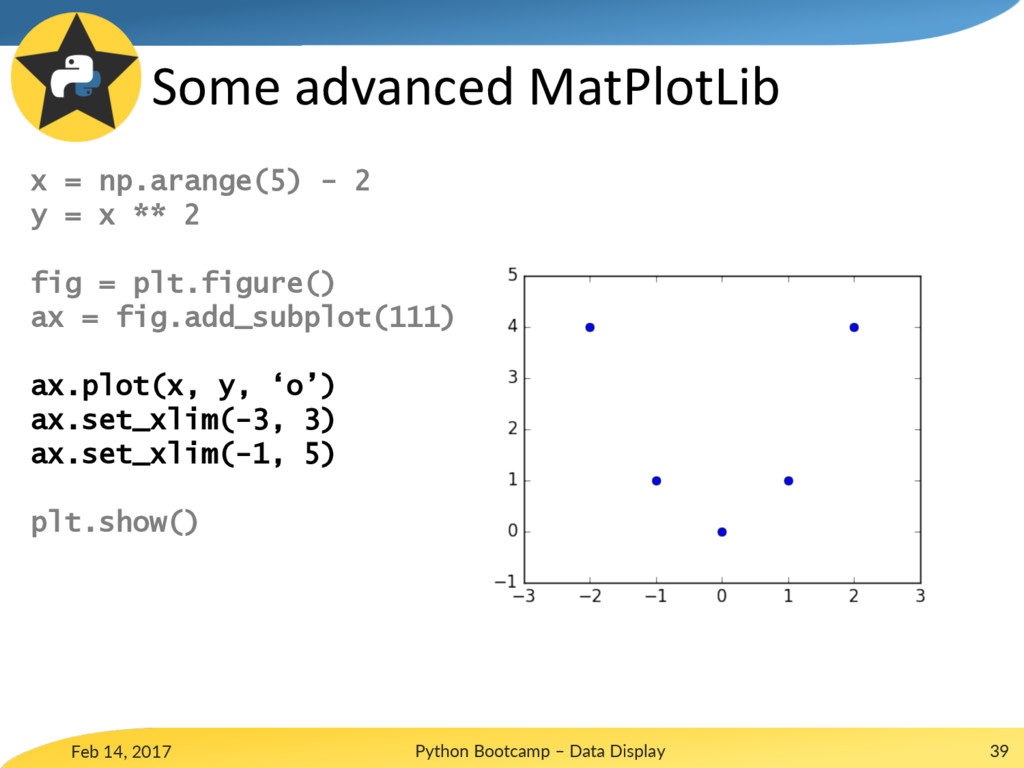
Feb 14, 2017 Python Bootcamp – Data Display 39 Some
advanced MatPlotLib x = np.arange(5) - 2 y = x ** 2 fig = plt.figure() ax = fig.add_subplot(111) ax.plot(x, y, ‘o’) ax.set_xlim(-3, 3) ax.set_xlim(-1, 5) plt.show()
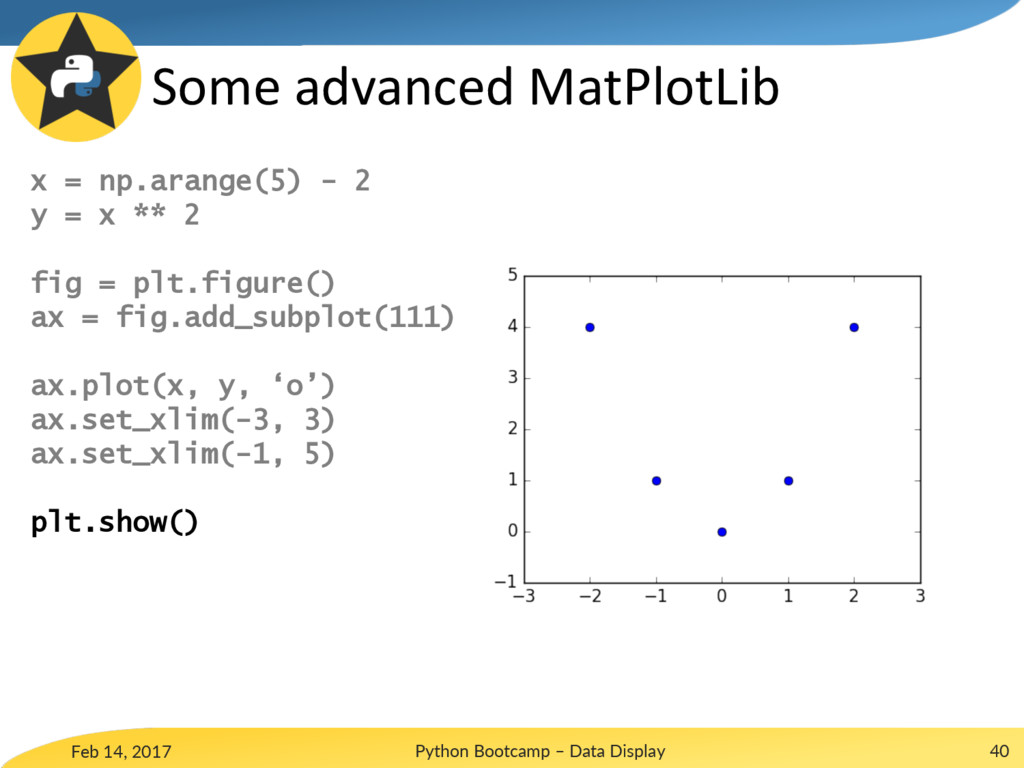
Feb 14, 2017 Python Bootcamp – Data Display 40 Some
advanced MatPlotLib x = np.arange(5) - 2 y = x ** 2 fig = plt.figure() ax = fig.add_subplot(111) ax.plot(x, y, ‘o’) ax.set_xlim(-3, 3) ax.set_xlim(-1, 5) plt.show()
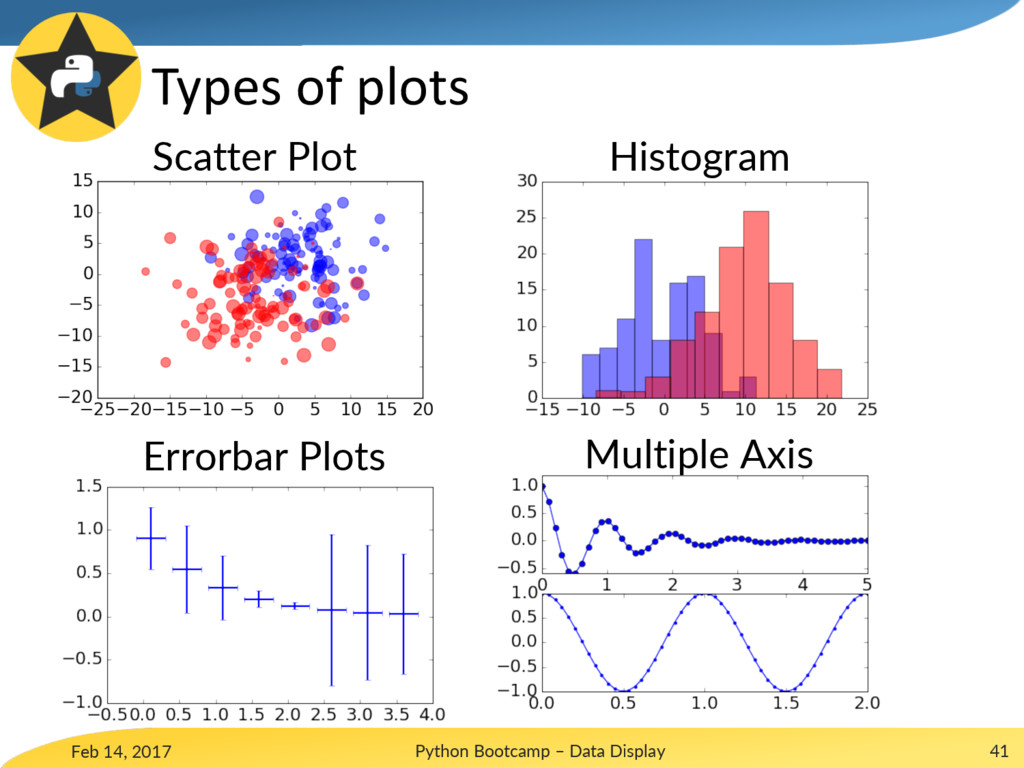
Feb 14, 2017 Python Bootcamp – Data Display 41 Types
of plots Scatter Plot Histogram Errorbar Plots Multiple Axis
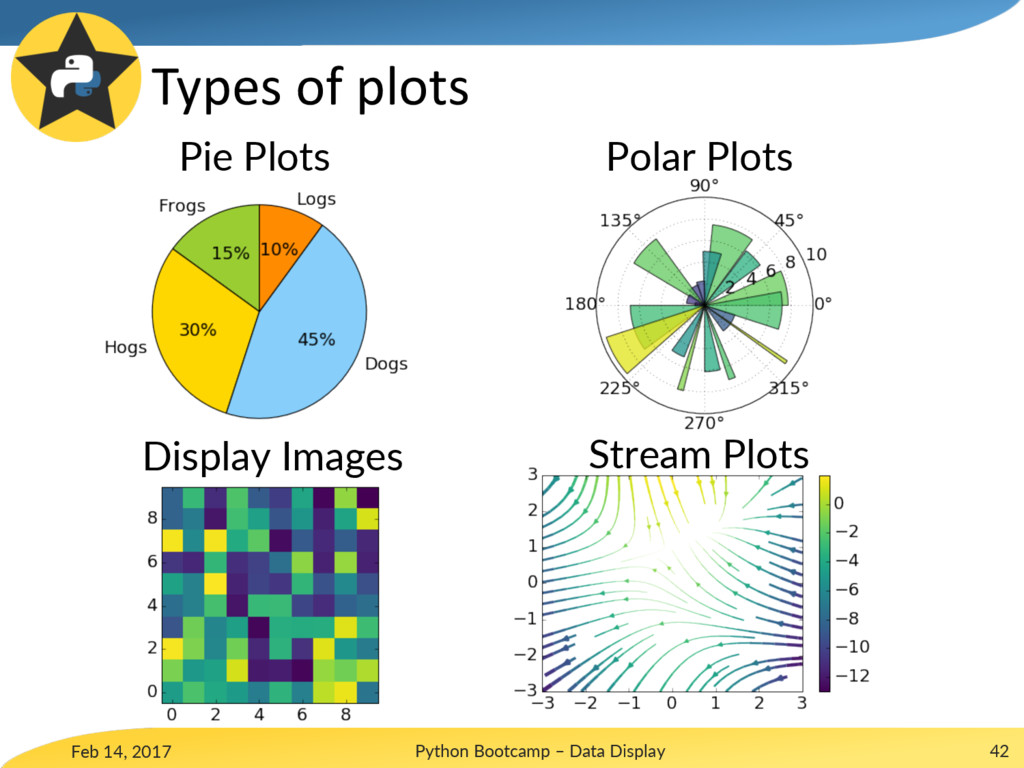
Feb 14, 2017 Python Bootcamp – Data Display 42 Types
of plots Pie Plots Polar Plots Display Images Stream Plots
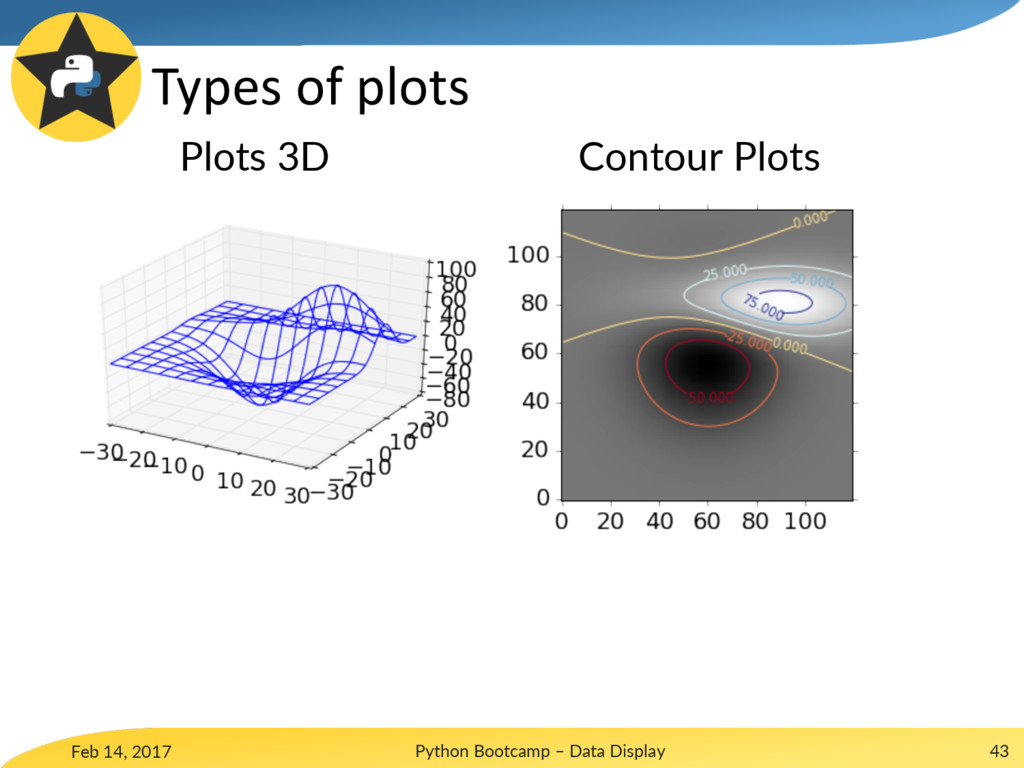
Feb 14, 2017 Python Bootcamp – Data Display 43 Types
of plots Plots 3D Contour Plots
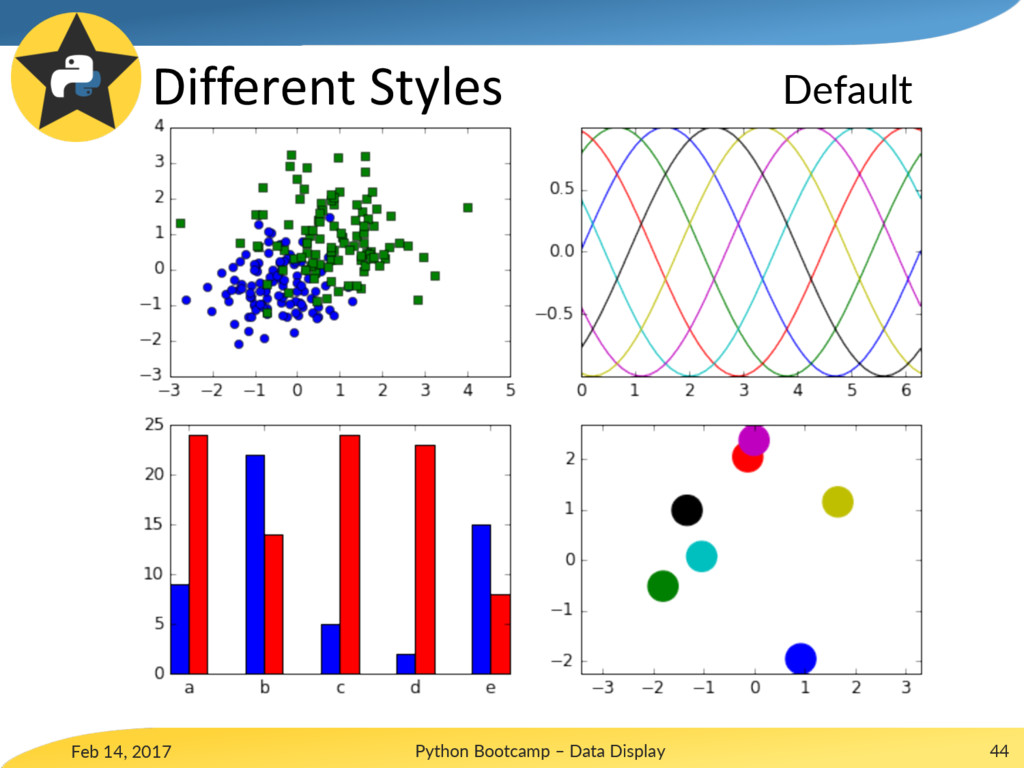
Feb 14, 2017 Python Bootcamp – Data Display 44 Different
Styles Default
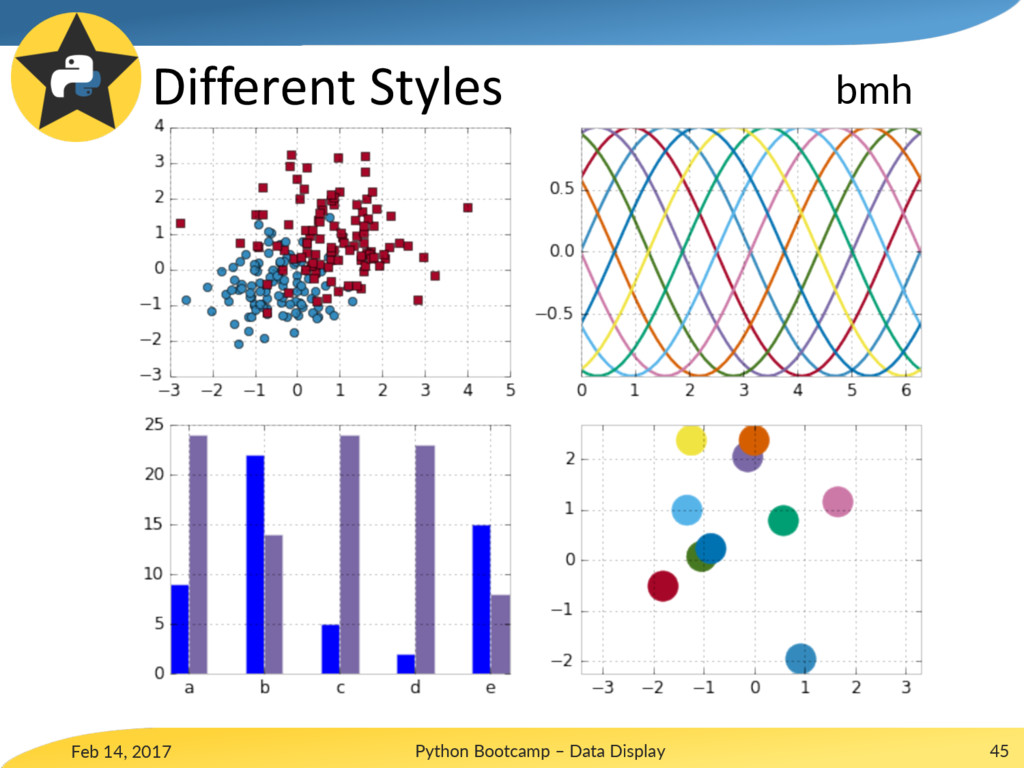
Feb 14, 2017 Python Bootcamp – Data Display 45 Different
Styles bmh
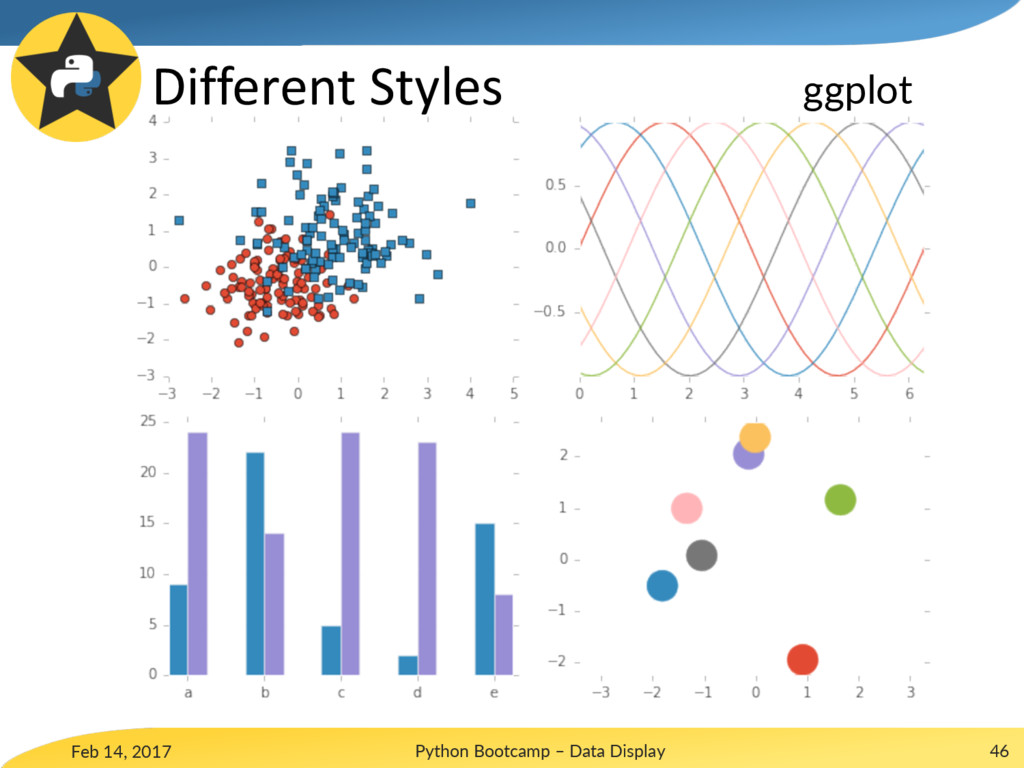
Feb 14, 2017 Python Bootcamp – Data Display 46 Different
Styles ggplot
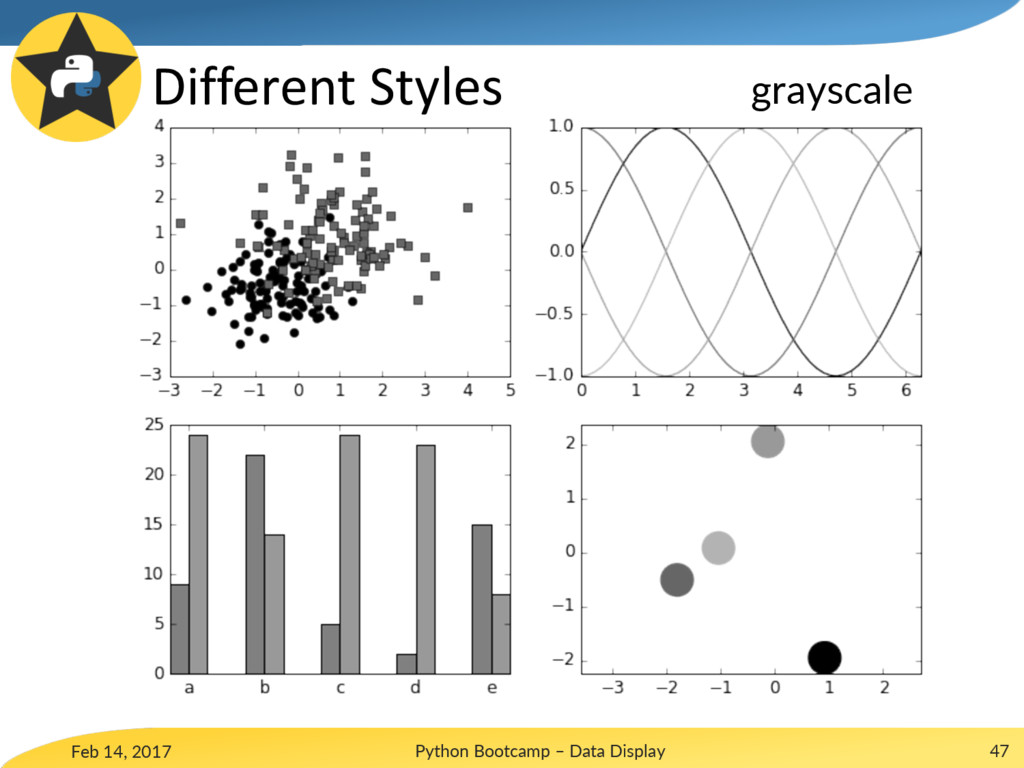
Feb 14, 2017 Python Bootcamp – Data Display 47 Different
Styles grayscale
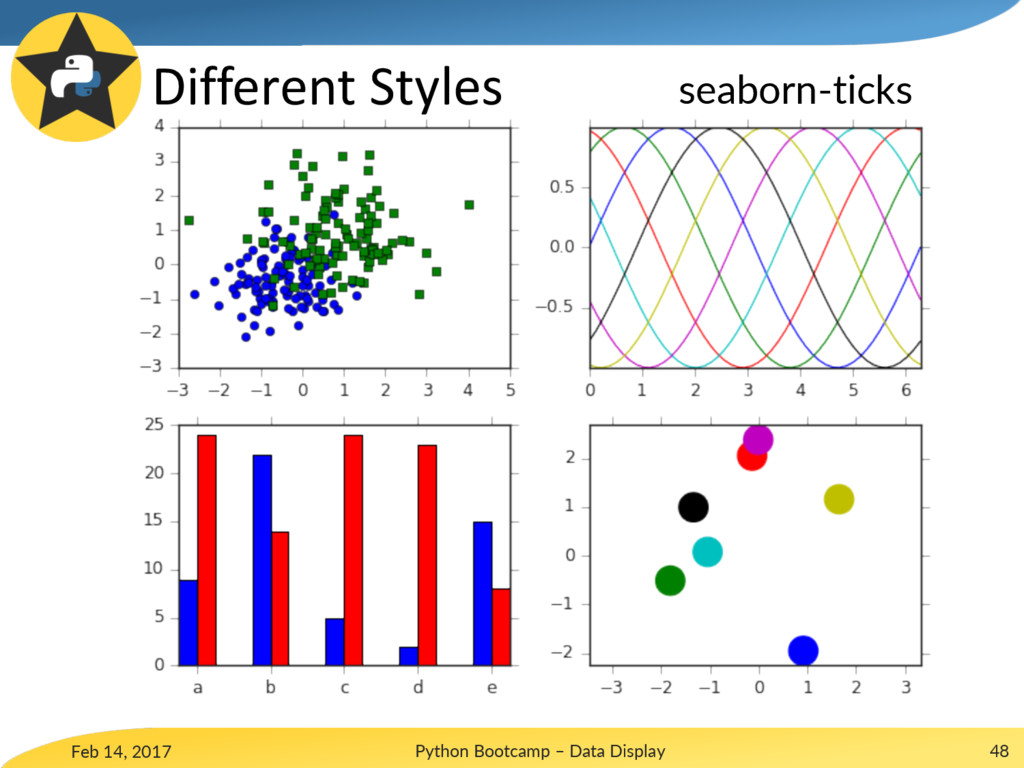
Feb 14, 2017 Python Bootcamp – Data Display 48 Different
Styles seaborn-ticks
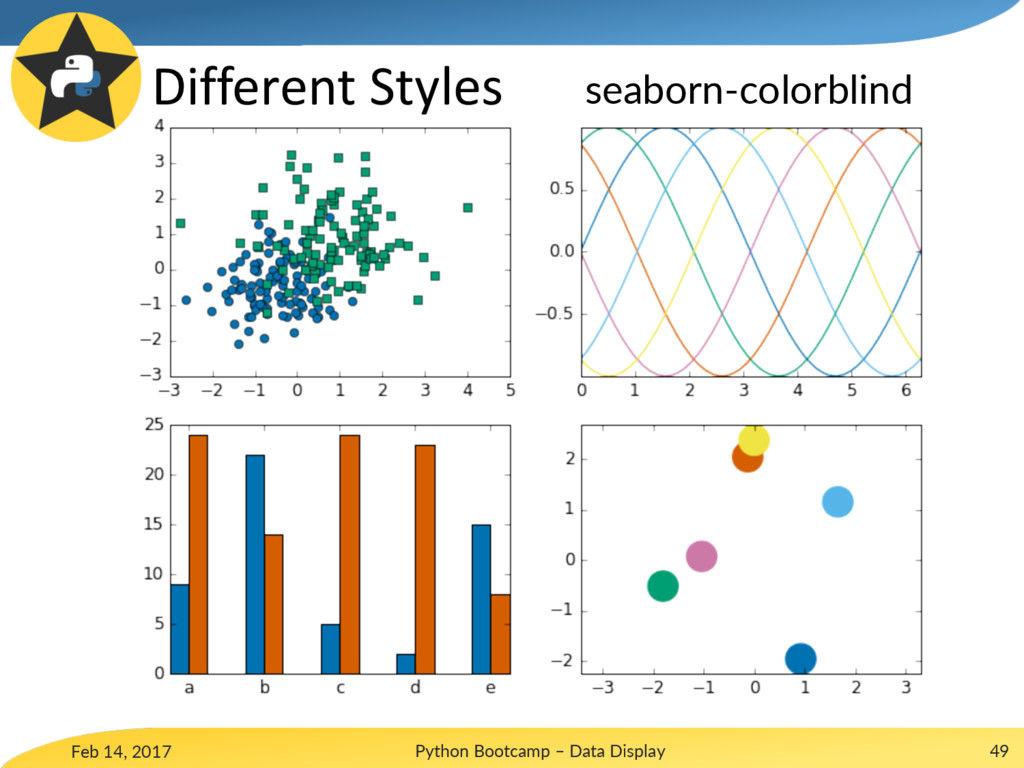
Feb 14, 2017 Python Bootcamp – Data Display 49 Different
Styles seaborn-colorblind
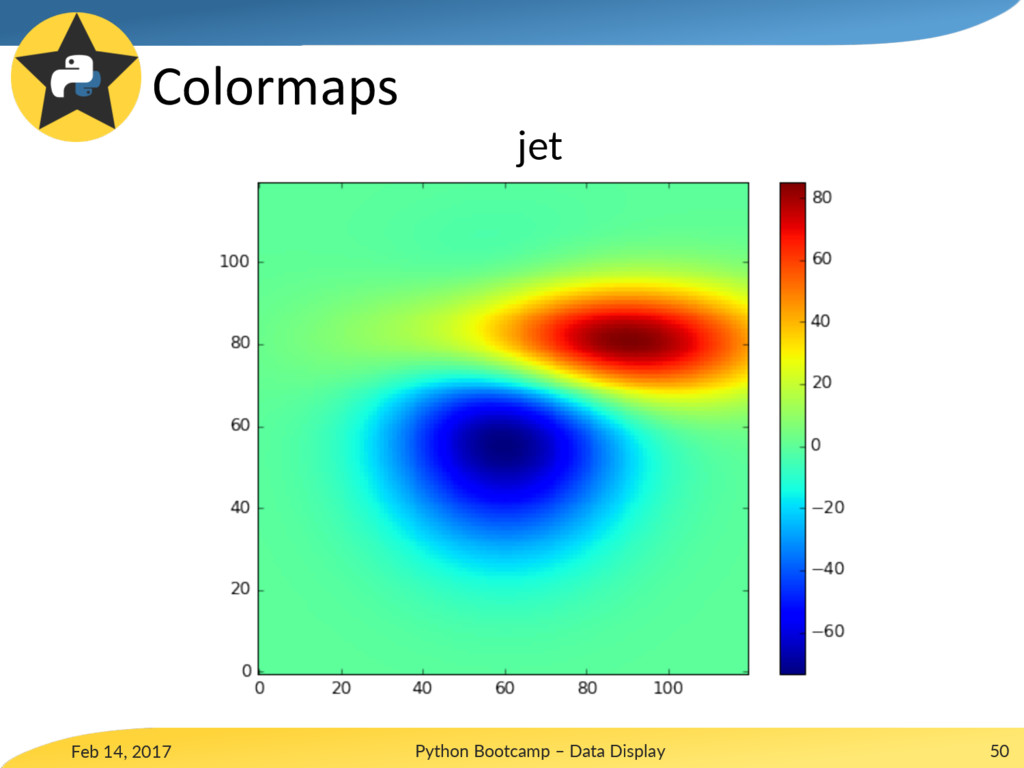
Feb 14, 2017 Python Bootcamp – Data Display 50 Colormaps
jet
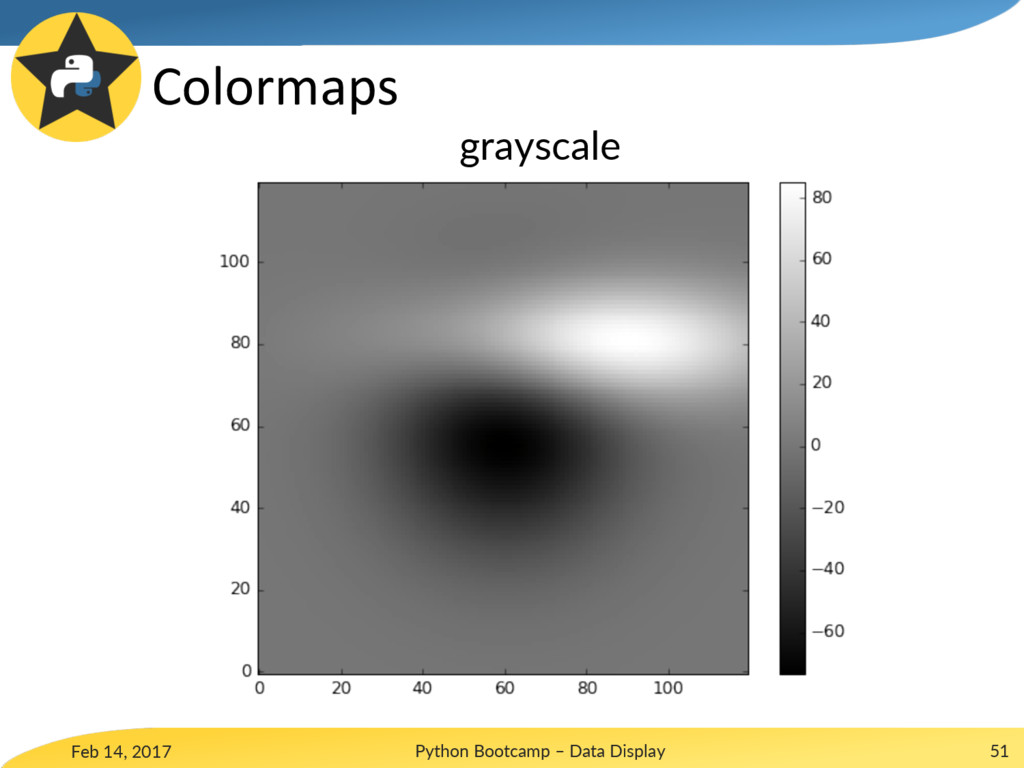
Feb 14, 2017 Python Bootcamp – Data Display 51 Colormaps
grayscale
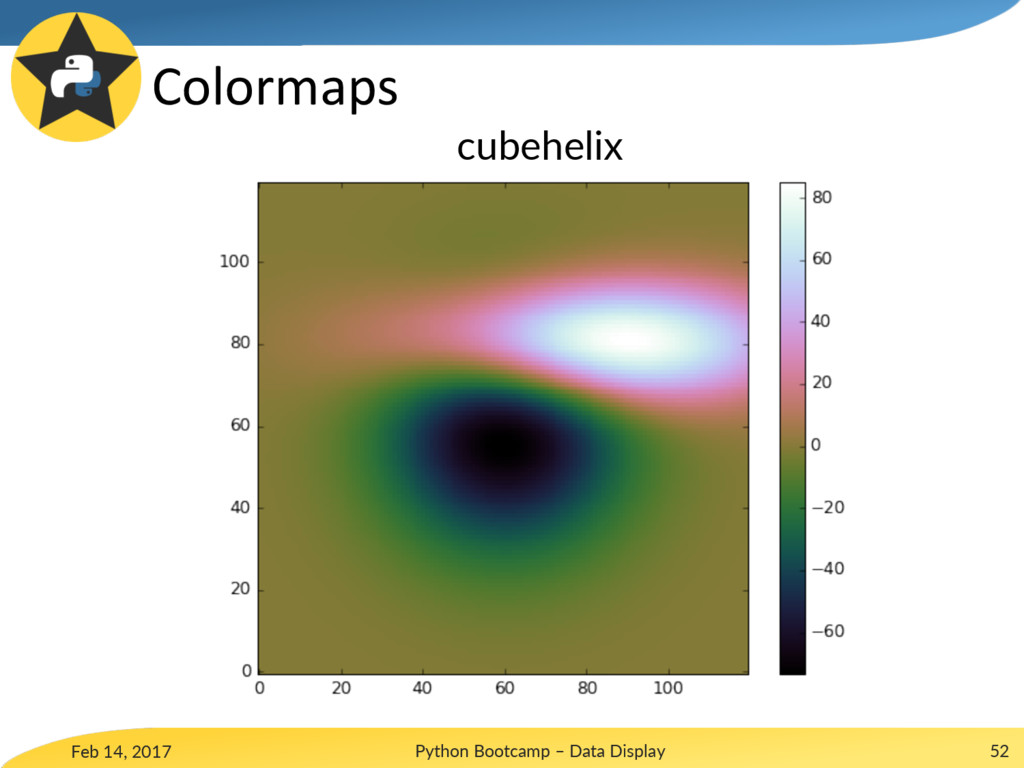
Feb 14, 2017 Python Bootcamp – Data Display 52 Colormaps
cubehelix
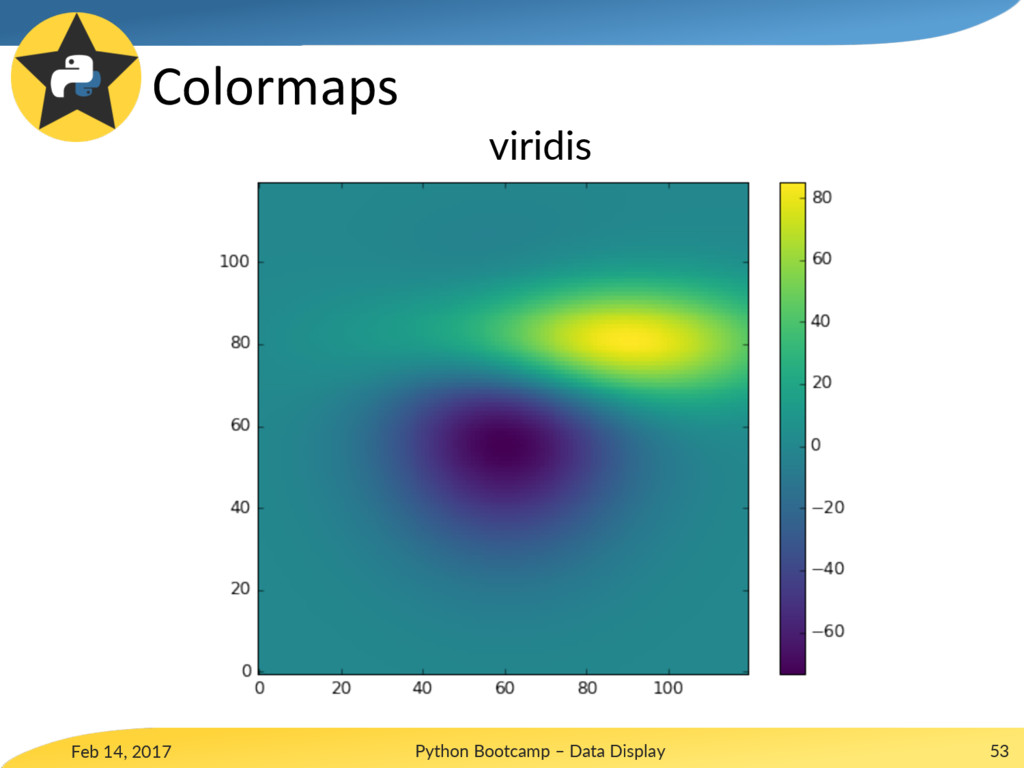
Feb 14, 2017 Python Bootcamp – Data Display 53 Colormaps
viridis
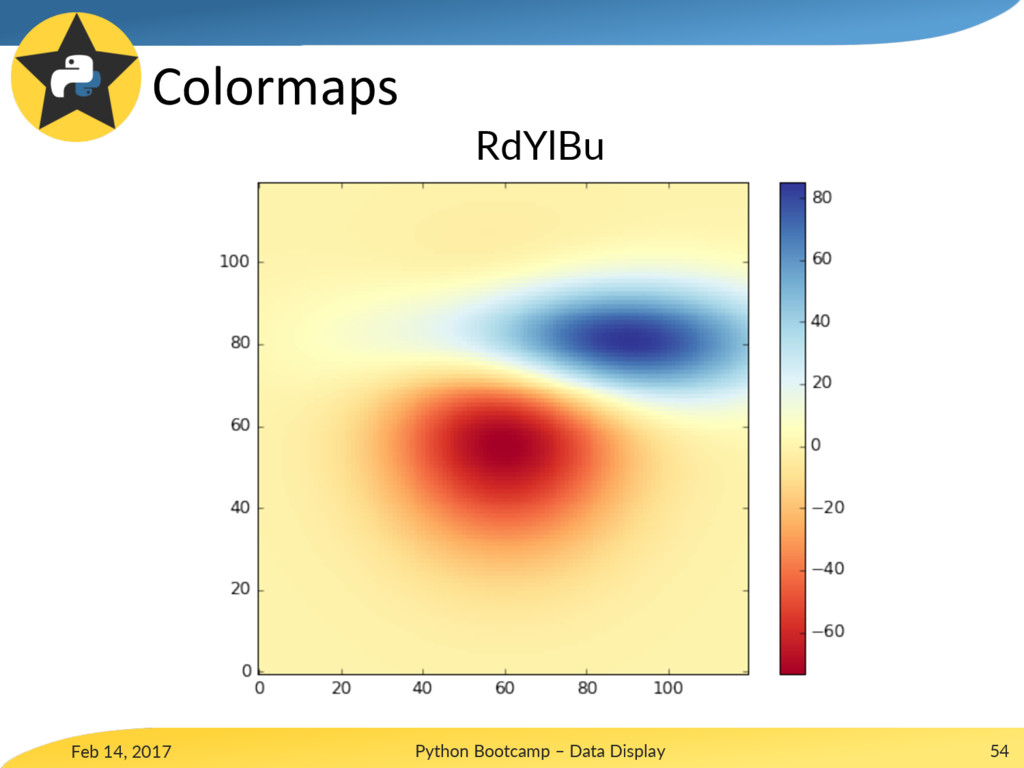
Feb 14, 2017 Python Bootcamp – Data Display 54 Colormaps
RdYlBu
Questions?
![plt.xlabel(“t [s]”) Feb 14, 2017 Python Bootcamp – Data Display](https://files.speakerdeck.com/presentations/5a6bbd7844894542aeb3342a60fc5c96/slide_19.jpg)
![plt.xlabel(“t [s]”) Feb 14, 2017 Python Bootcamp – Data Display](https://files.speakerdeck.com/presentations/5a6bbd7844894542aeb3342a60fc5c96/slide_20.jpg)
![plt.xlabel(“t [s]”) Feb 14, 2017 Python Bootcamp – Data Display](https://files.speakerdeck.com/presentations/5a6bbd7844894542aeb3342a60fc5c96/slide_21.jpg)
![plt.xlabel(“t [s]”, fontsize=24) Feb 14, 2017 Python Bootcamp – Data](https://files.speakerdeck.com/presentations/5a6bbd7844894542aeb3342a60fc5c96/slide_22.jpg)
![plt.xlabel(“t [s]”, fontsize=24) Feb 14, 2017 Python Bootcamp – Data](https://files.speakerdeck.com/presentations/5a6bbd7844894542aeb3342a60fc5c96/slide_23.jpg)
![plt.xlabel(“t [s]”, fontsize=24) Feb 14, 2017 Python Bootcamp – Data](https://files.speakerdeck.com/presentations/5a6bbd7844894542aeb3342a60fc5c96/slide_24.jpg)
![plt.xlabel(“t [s]”, fontsize=24) Feb 14, 2017 Python Bootcamp – Data](https://files.speakerdeck.com/presentations/5a6bbd7844894542aeb3342a60fc5c96/slide_25.jpg)