Upgrade to Pro
— share decks privately, control downloads, hide ads and more …
Speaker Deck
Features
Speaker Deck
PRO
Sign in
Sign up for free
Search
Search
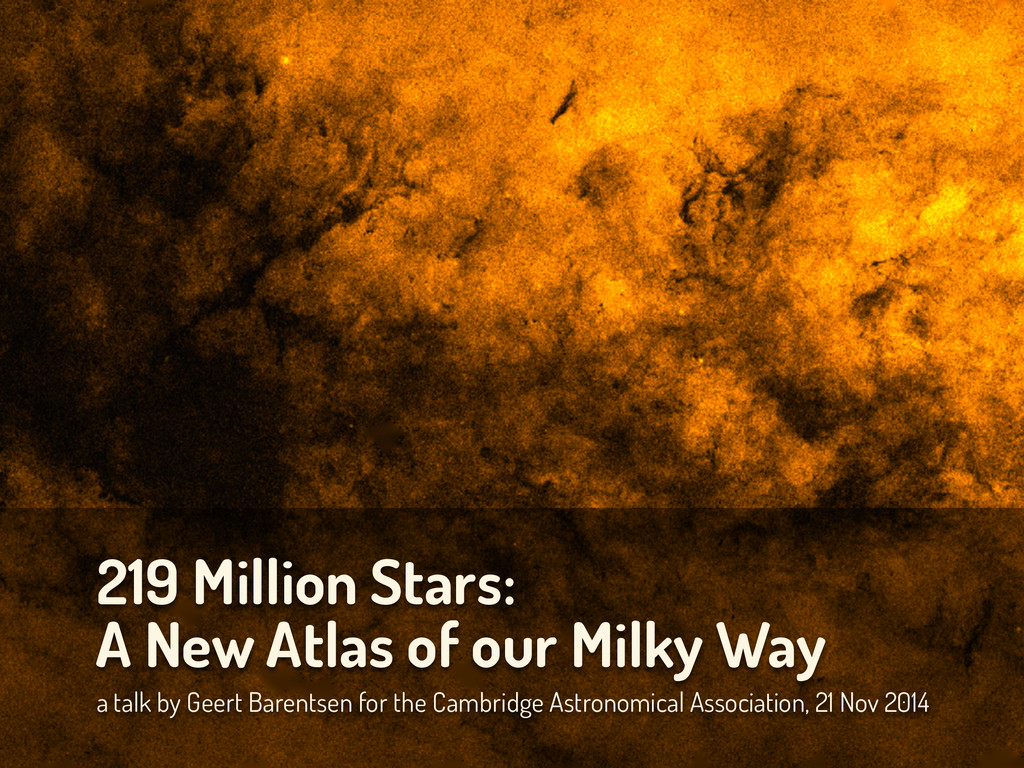
219 Million Stars: A New Atlas of our Milky Way
Search
Geert Barentsen
November 21, 2014
Science
140
0
Share
Embed
Copy iframe code
Copy JS code
Copy link
Start on current slide
219 Million Stars: A New Atlas of our Milky Way
Outreach talk for the Cambridge Astronomical Association, presented on 21 November 2014.
Geert Barentsen
November 21, 2014
More Decks by Geert Barentsen
See All by Geert Barentsen
A story about open science
barentsen
0
100
Kepler's Discoveries will Continue
barentsen
0
210
Kepler/K2 Status Update & New Software Tools
barentsen
0
300
Three reasons why Kepler's discoveries will continue for a decade
barentsen
2
260
The Kepler/K2 Supernova Cosmology Experiment
barentsen
1
130
How Sagan Fellows are shaping the success of NASA’s K2 Mission
barentsen
0
230
La misión Kepler de NASA
barentsen
0
100
How to find a planet?
barentsen
0
130
K2: Status and Future
barentsen
0
230
Other Decks in Science
See All in Science
次代のデータサイエンティストへ~スキルチェックリスト、タスクリスト更新~
datascientistsociety
PRO
3
46k
ダメな自分の育て方―性格タイプの「劣等機能」から理解するニガテ克服術
ppillc
0
220
チュートリアル:世界モデル
hf149
0
1.9k
HajimetenoLT vol.17
hashimoto_kei
1
240
大黒市で発生した大規模インシデント の ポストモーテムから読み解く、 記憶媒体消去の大切さ
shucho0103
0
210
機械学習 - pandas入門
trycycle
PRO
0
660
因果推論と機械学習
sshimizu2006
1
1.2k
プロジェクト「Azayaka」のSARの数式とジオメトリ
syuchimu
0
380
データベース08: 実体関連モデルとは?
trycycle
PRO
0
1.4k
データベース03: 関係データモデル
trycycle
PRO
1
610
Snowflake HCLS Meet Upヘルスケアユーザー会紹介
ktatsuya
0
100
J-STAGE全文XML登載必須化について
xspa2012
0
1.2k
Featured
See All Featured
The Curious Case for Waylosing
cassininazir
1
430
SERP Conf. Vienna - Web Accessibility: Optimizing for Inclusivity and SEO
sarafernandez
2
1.5k
Producing Creativity
orderedlist
PRO
348
40k
CSS Pre-Processors: Stylus, Less & Sass
bermonpainter
360
30k
個人開発の失敗を避けるイケてる考え方 / tips for indie hackers
panda_program
123
22k
エンジニアに許された特別な時間の終わり
watany
108
250k
Discover your Explorer Soul
emna__ayadi
2
1.2k
Sam Torres - BigQuery for SEOs
techseoconnect
PRO
0
310
Visualization
eitanlees
152
17k
Connecting the Dots Between Site Speed, User Experience & Your Business [WebExpo 2025]
tammyeverts
11
970
The Language of Interfaces
destraynor
162
27k
What does AI have to do with Human Rights?
axbom
PRO
1
2.3k
Transcript
219 Million Stars: A New Atlas of our Milky Way
a talk by Geert Barentsen for the Cambridge Astronomical Association, 21 Nov 2014
None
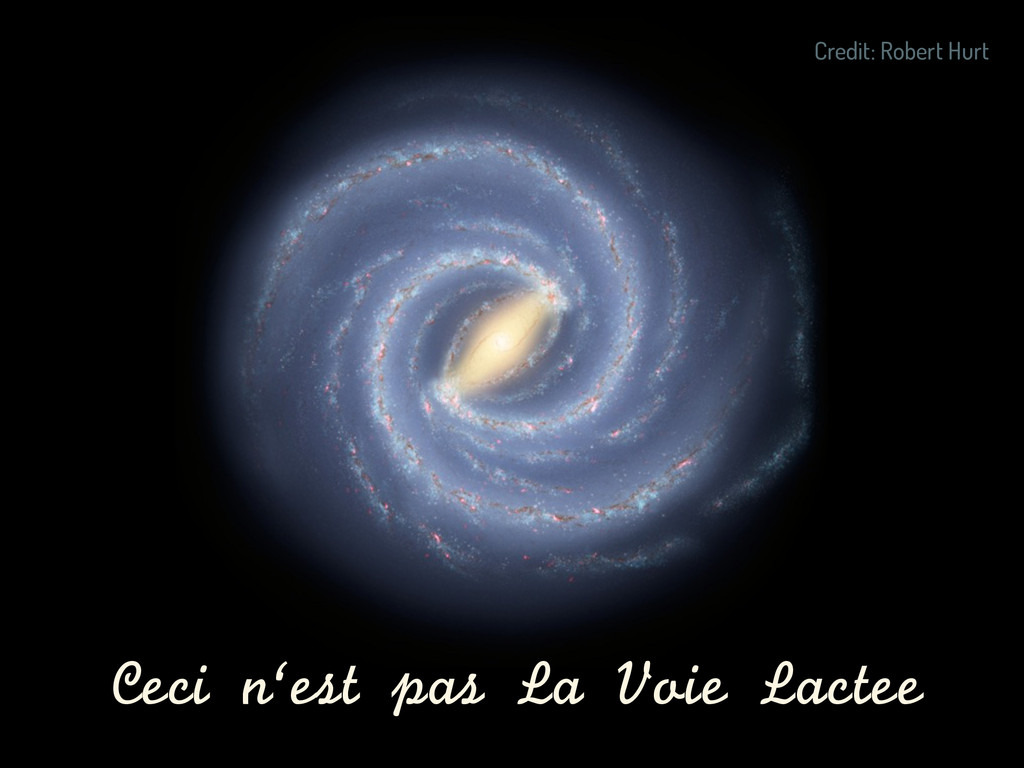
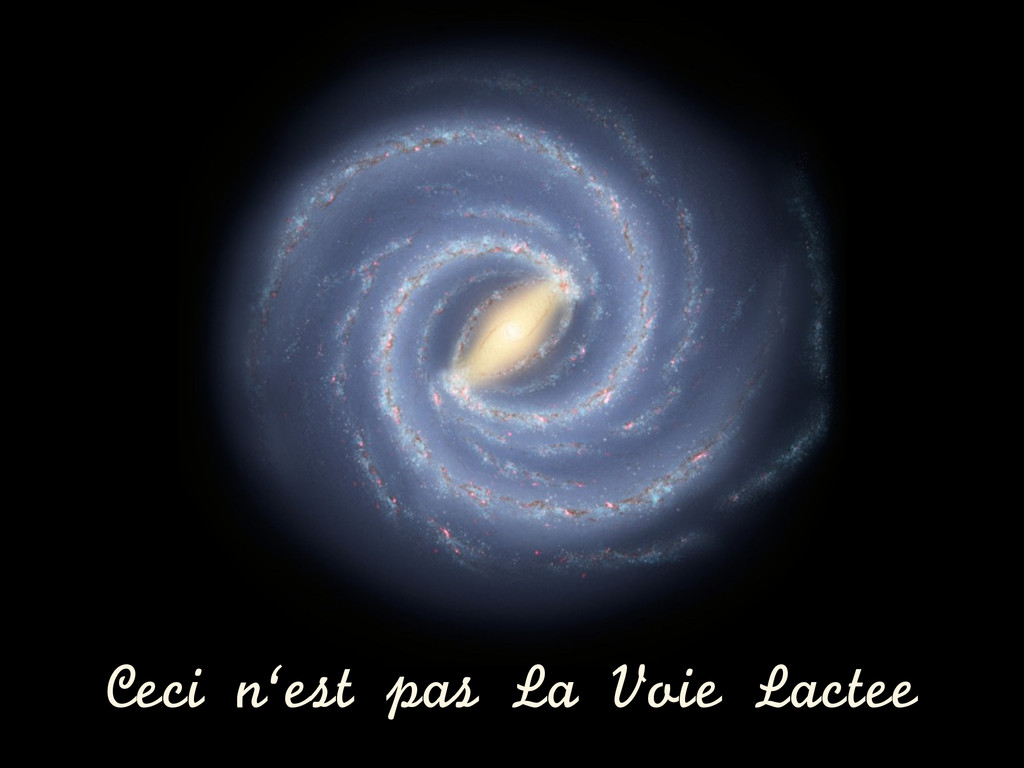
Ceci n`est pas La Voie Lactee Credit: Robert Hurt
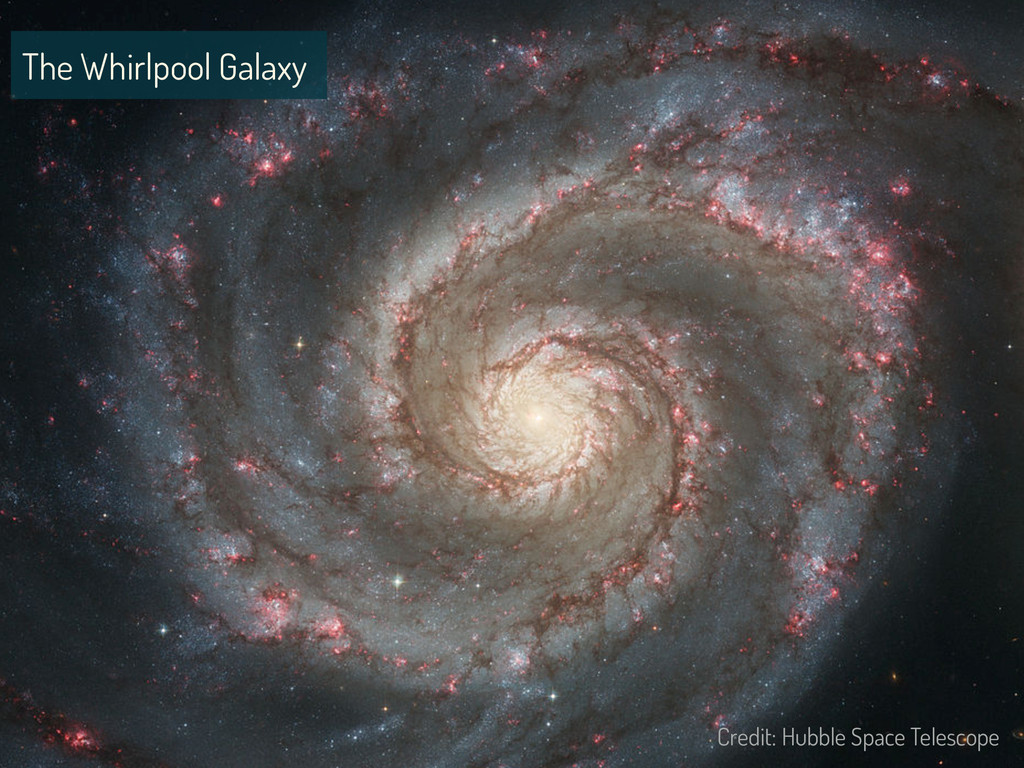
The Whirlpool Galaxy Credit: Hubble Space Telescope
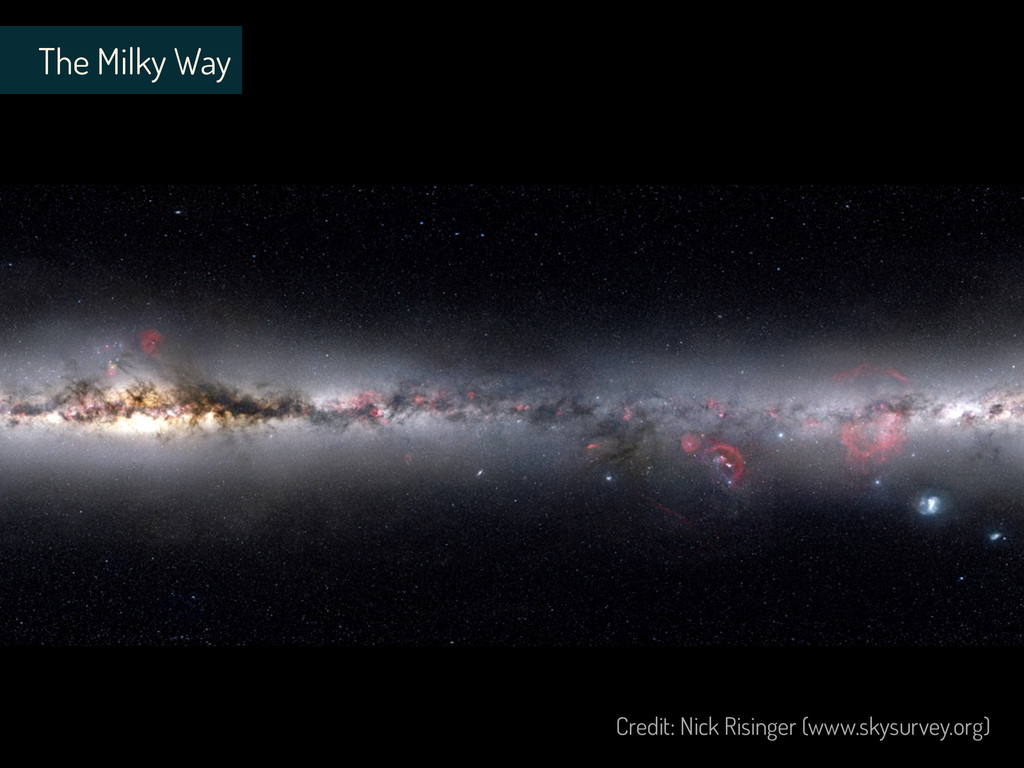
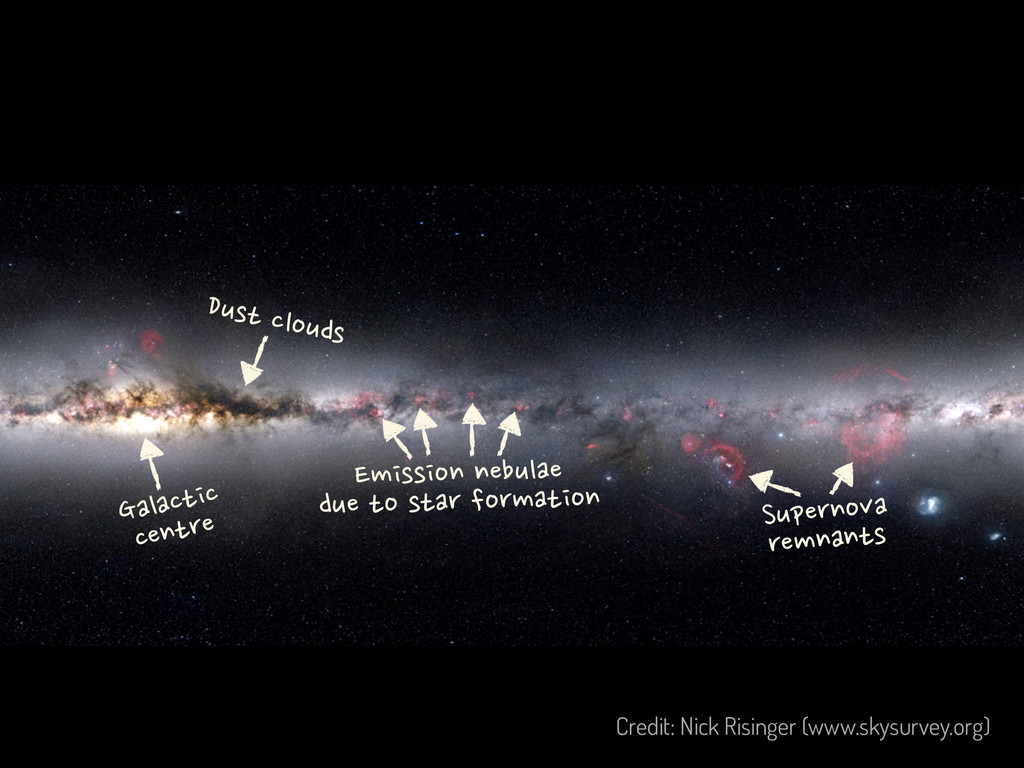
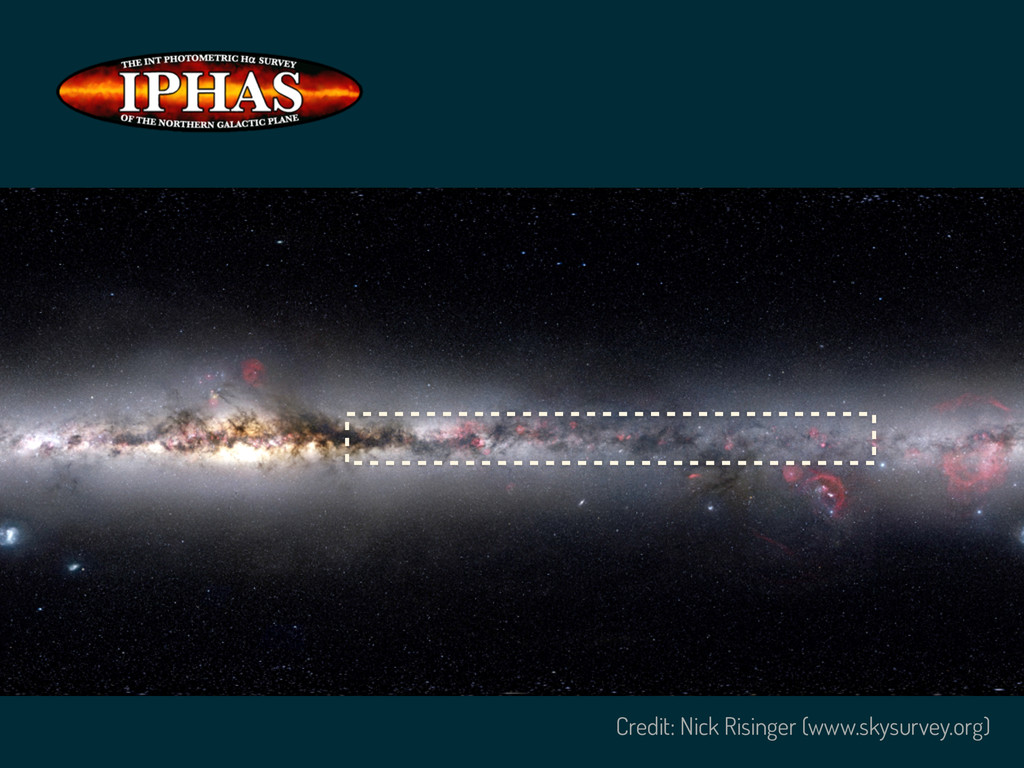
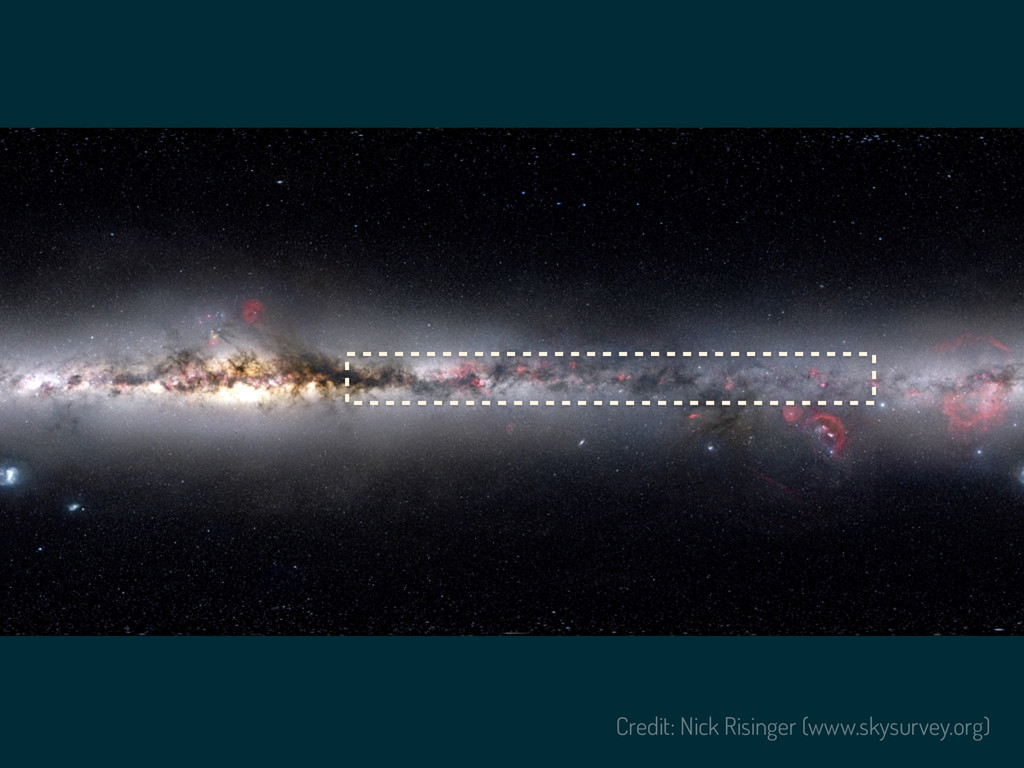
The Milky Way Credit: Nick Risinger (www.skysurvey.org)
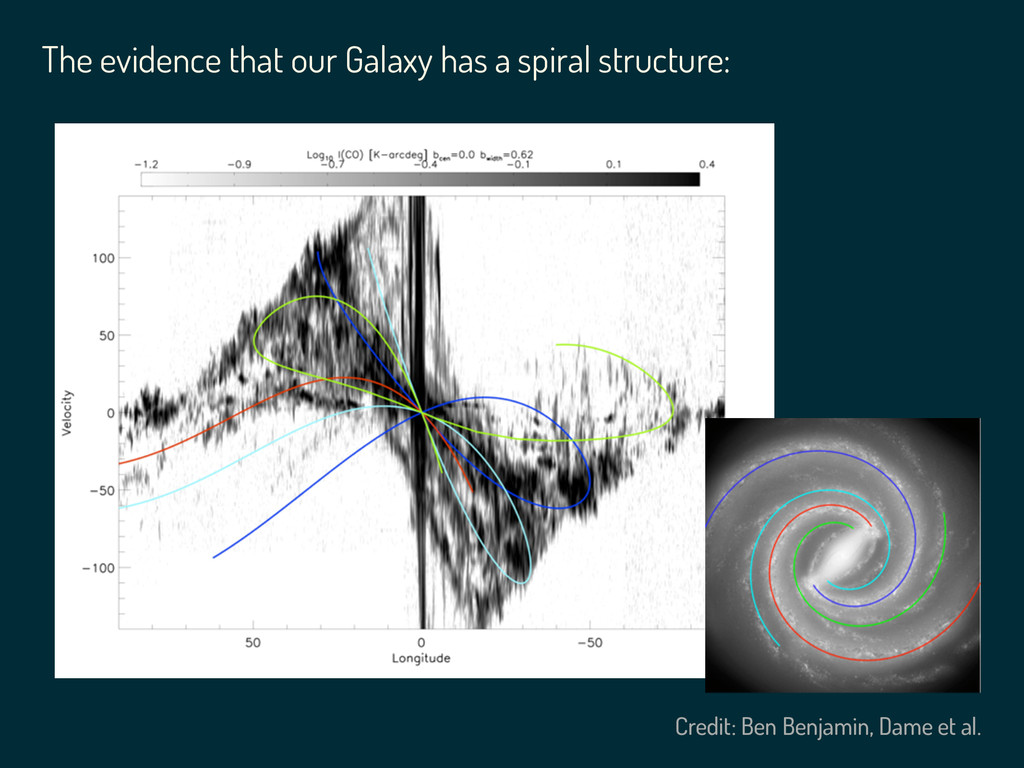
Credit: Ben Benjamin, Dame et al. The evidence that our
Galaxy has a spiral structure:
Emission
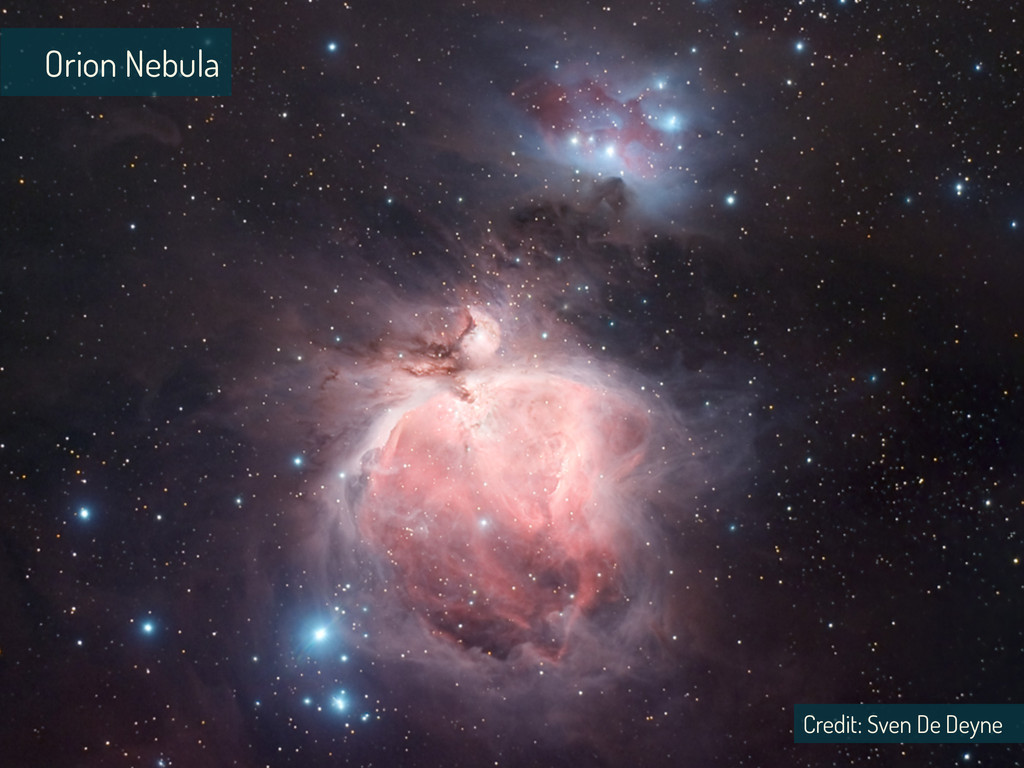
Credit: Sven De Deyne Orion Nebula
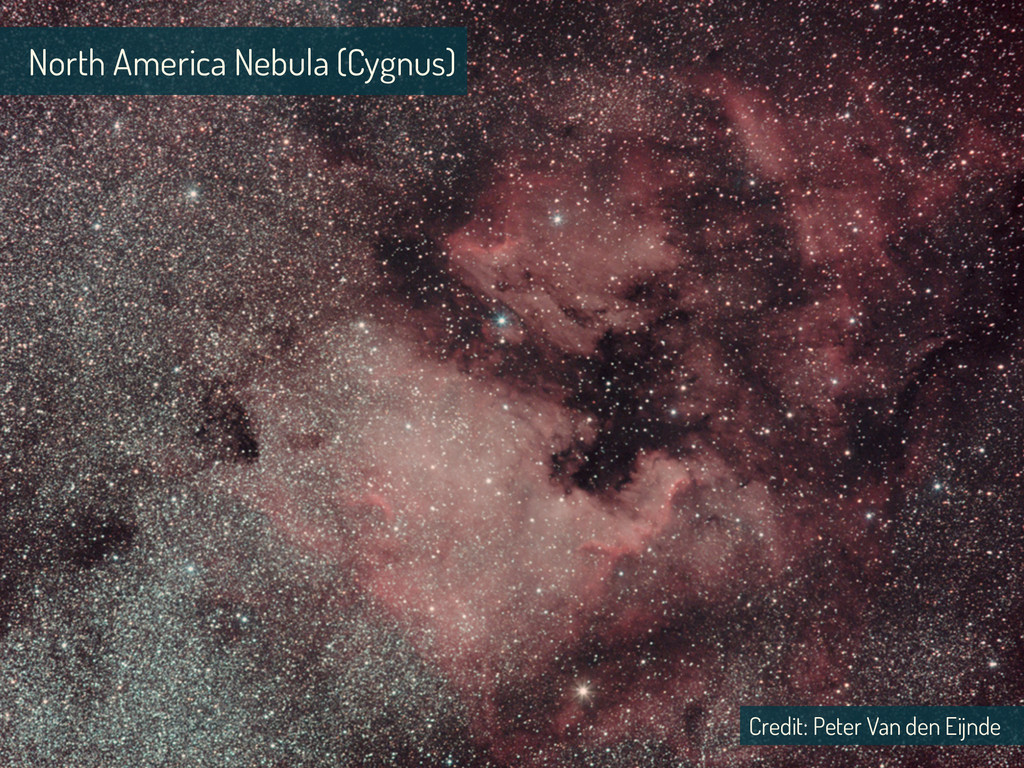
Credit: Peter Van den Eijnde North America Nebula (Cygnus)
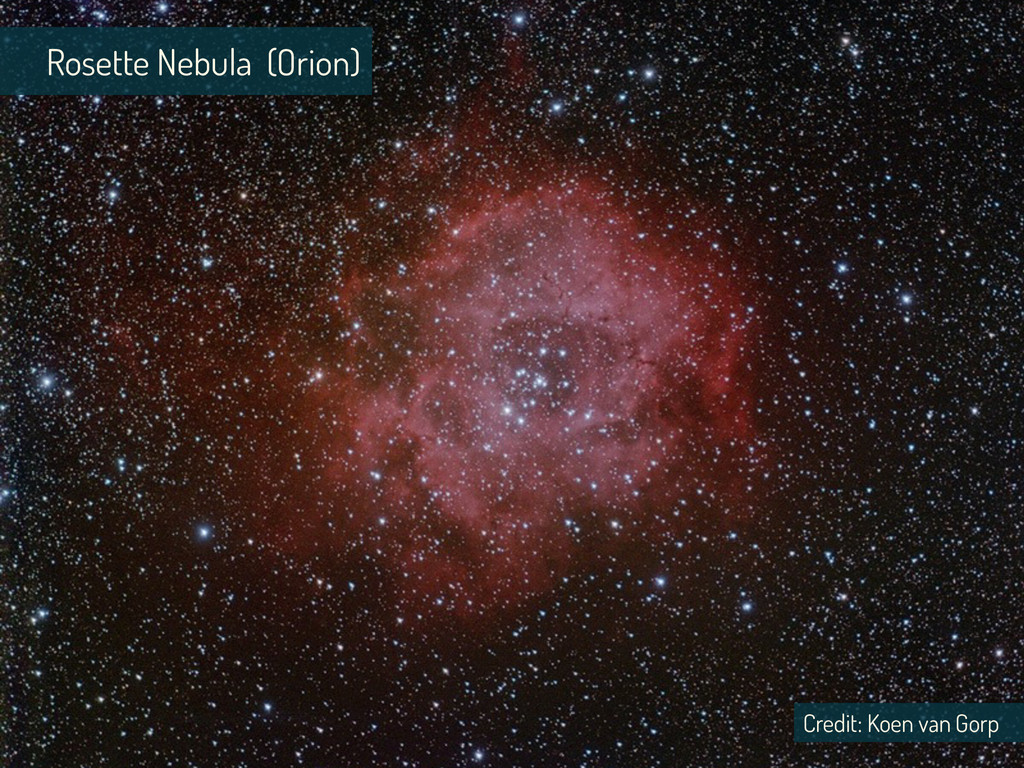
Credit: Koen van Gorp Rosette Nebula (Orion)
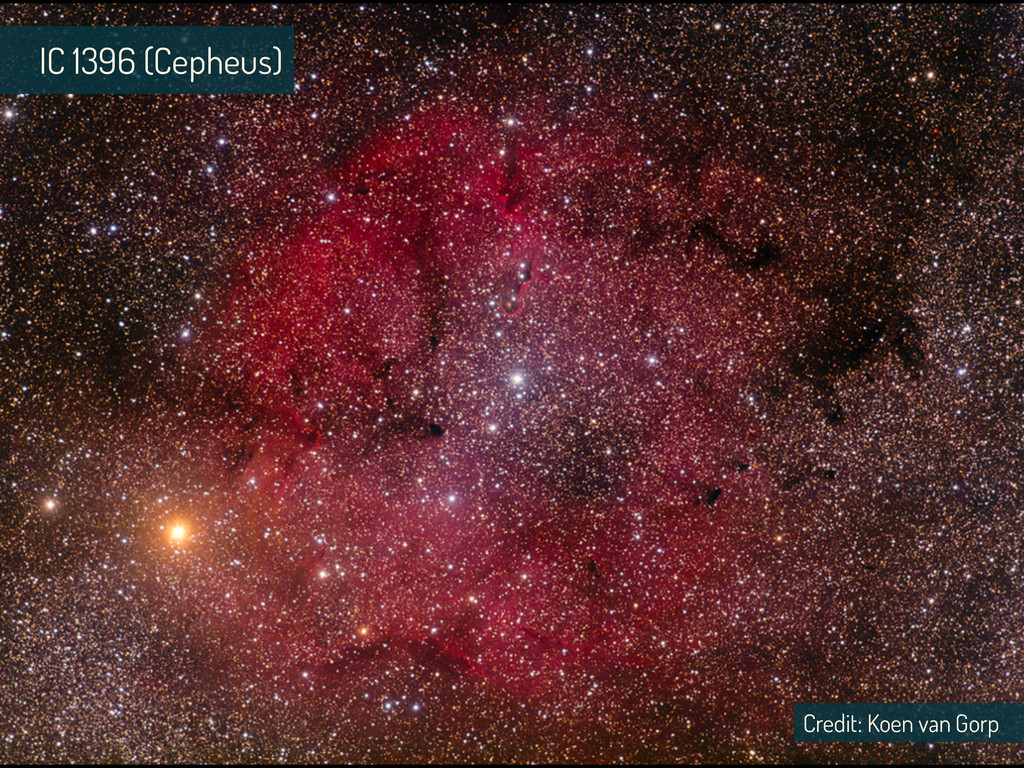
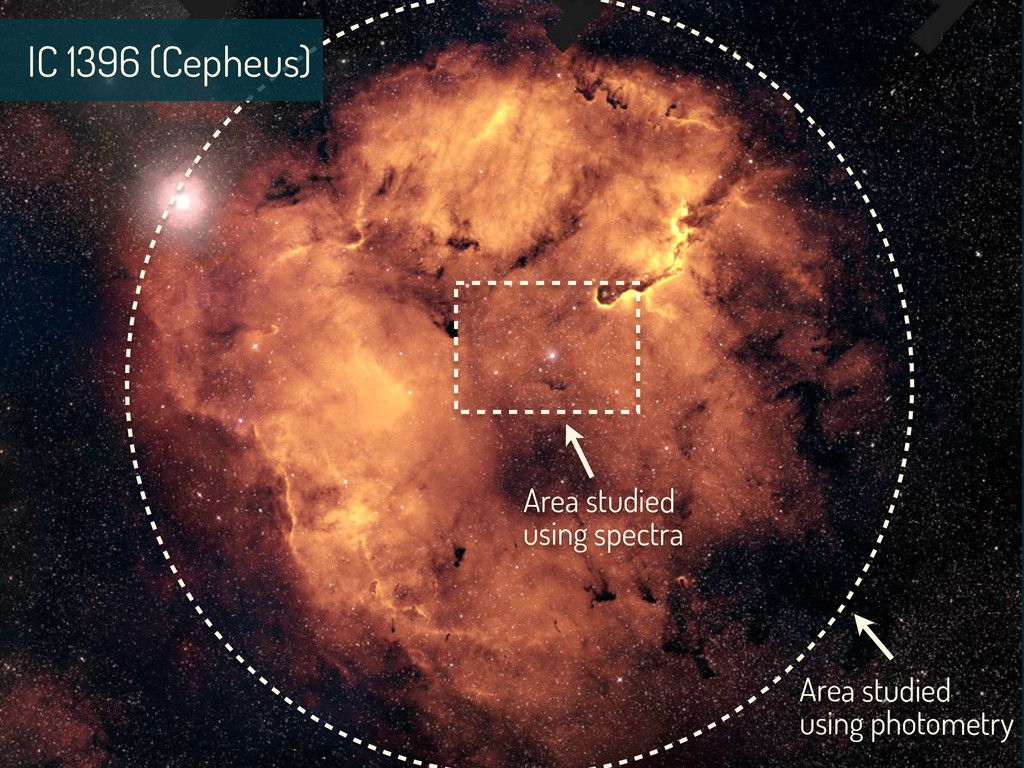
Credit: Koen van Gorp IC 1396 (Cepheus)
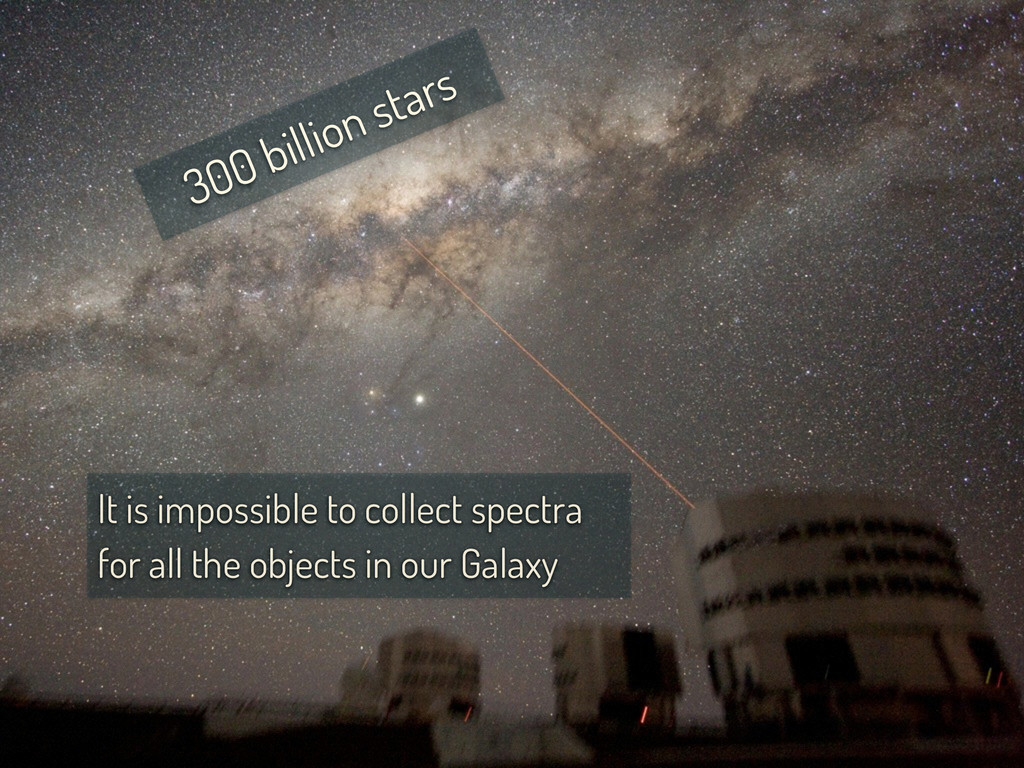
How do astronomers go about studying their own Galaxy?
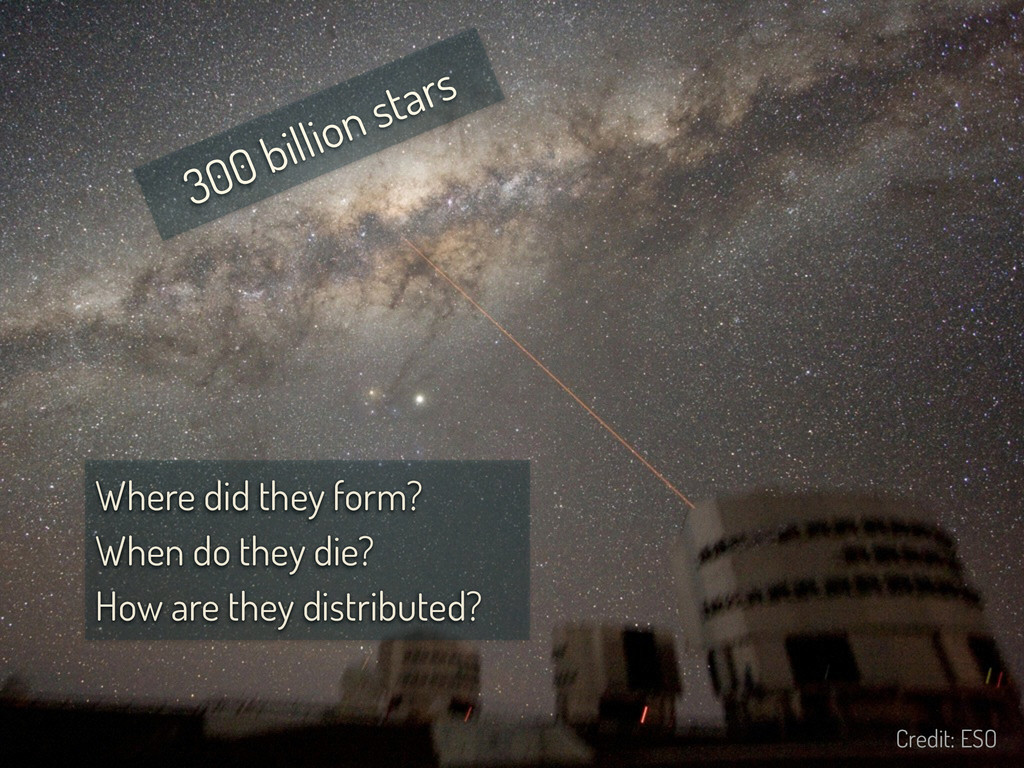
300 billion stars Where did they form? When do they
die? How are they distributed? Credit: ESO
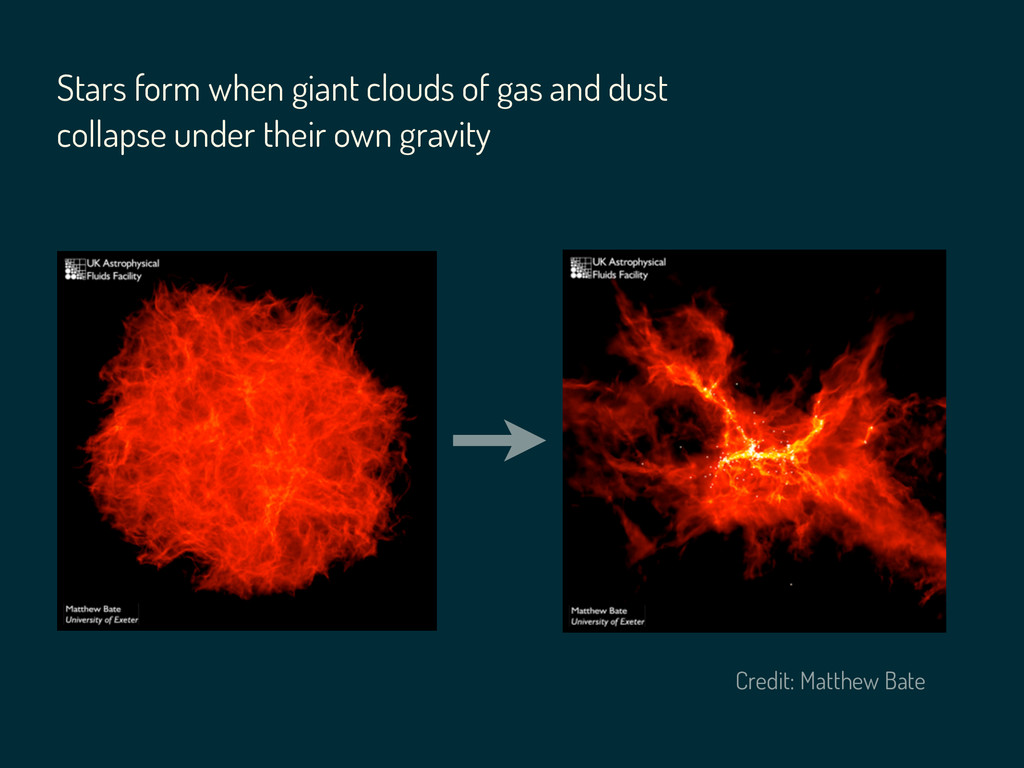
Stars form when giant clouds of gas and dust collapse
under their own gravity Credit: Matthew Bate
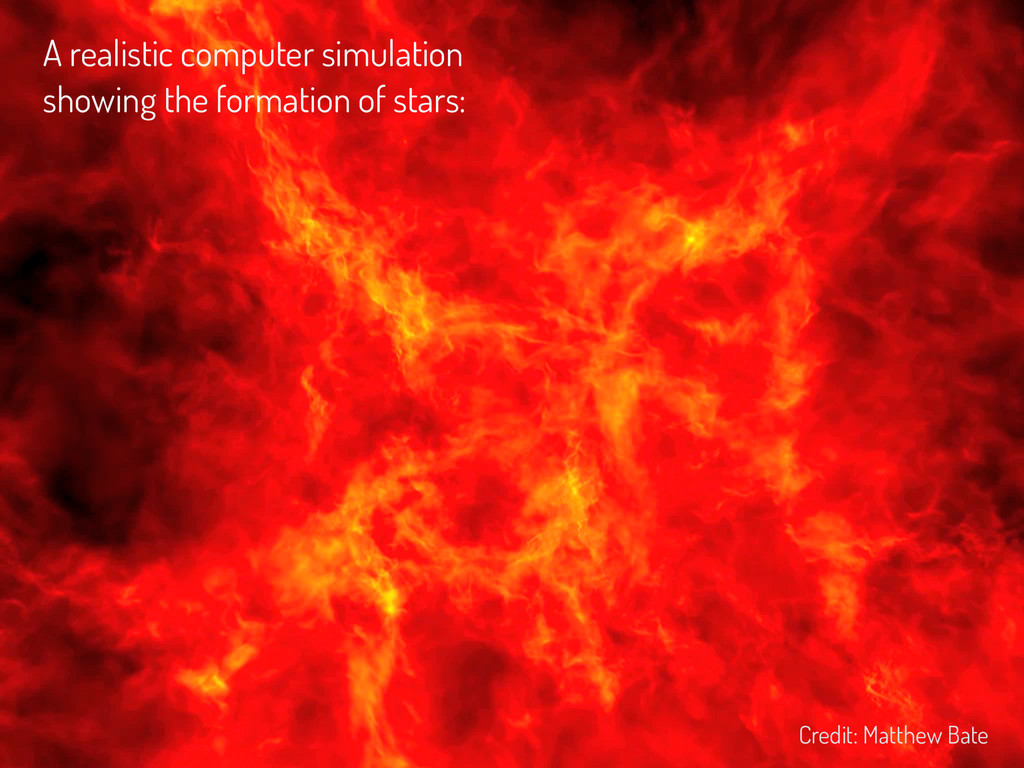
A realistic computer simulation showing the formation of stars: Credit:
Matthew Bate
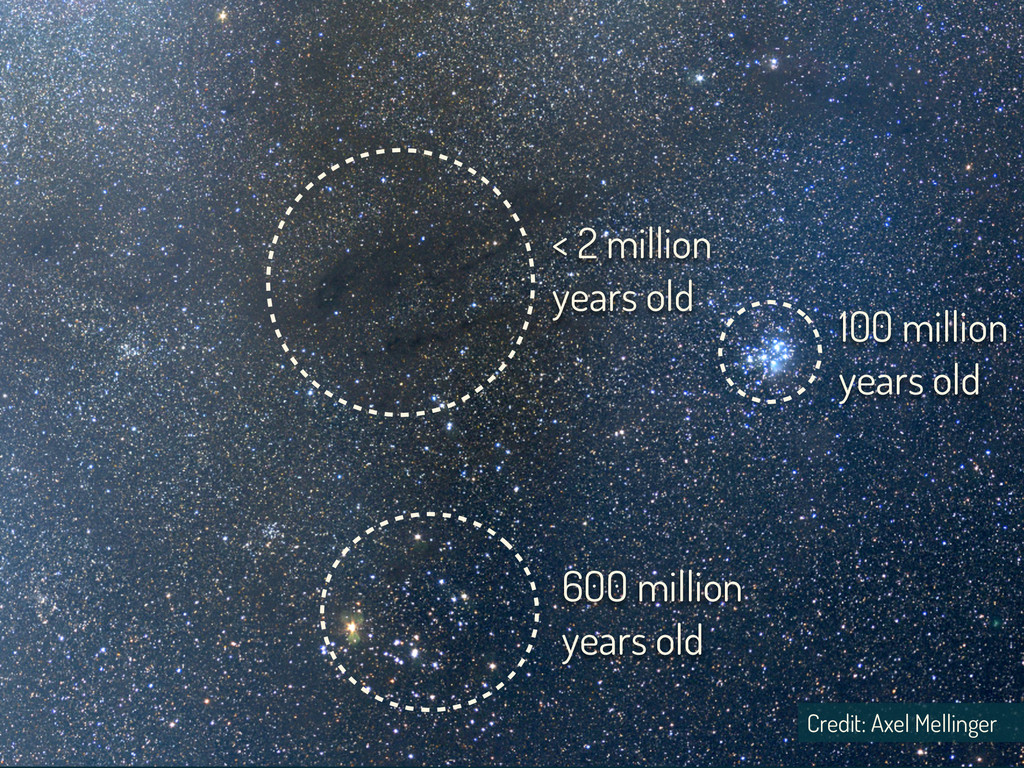
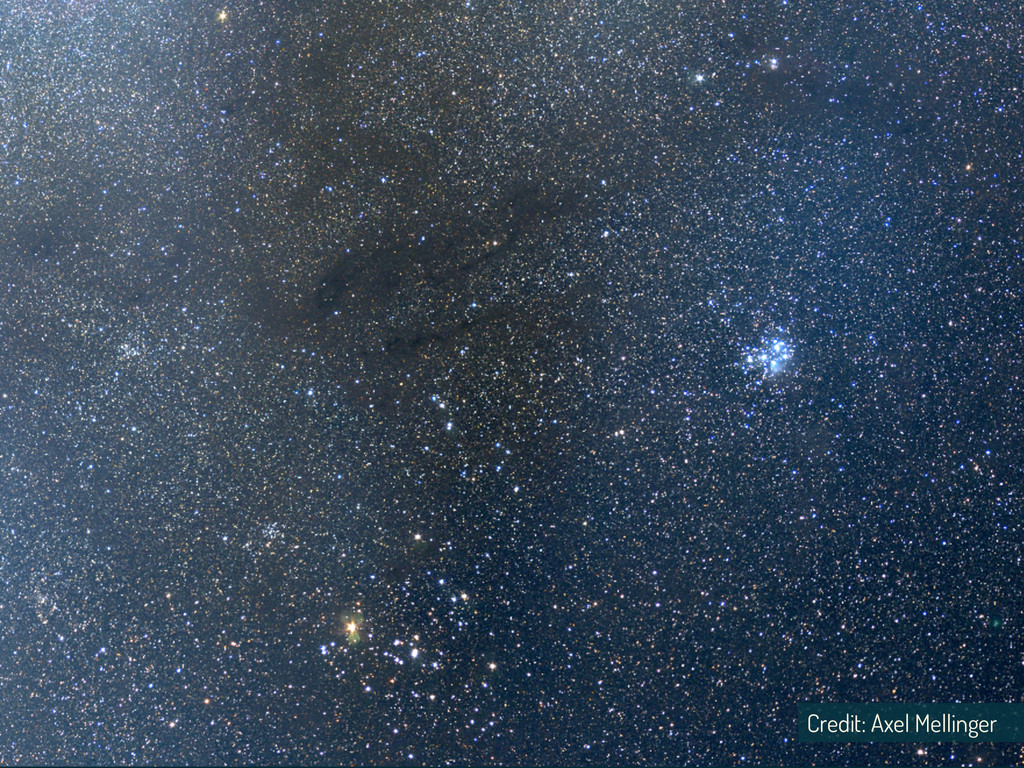
Credit: Axel Mellinger 100 million years old 600 million years
old < 2 million years old
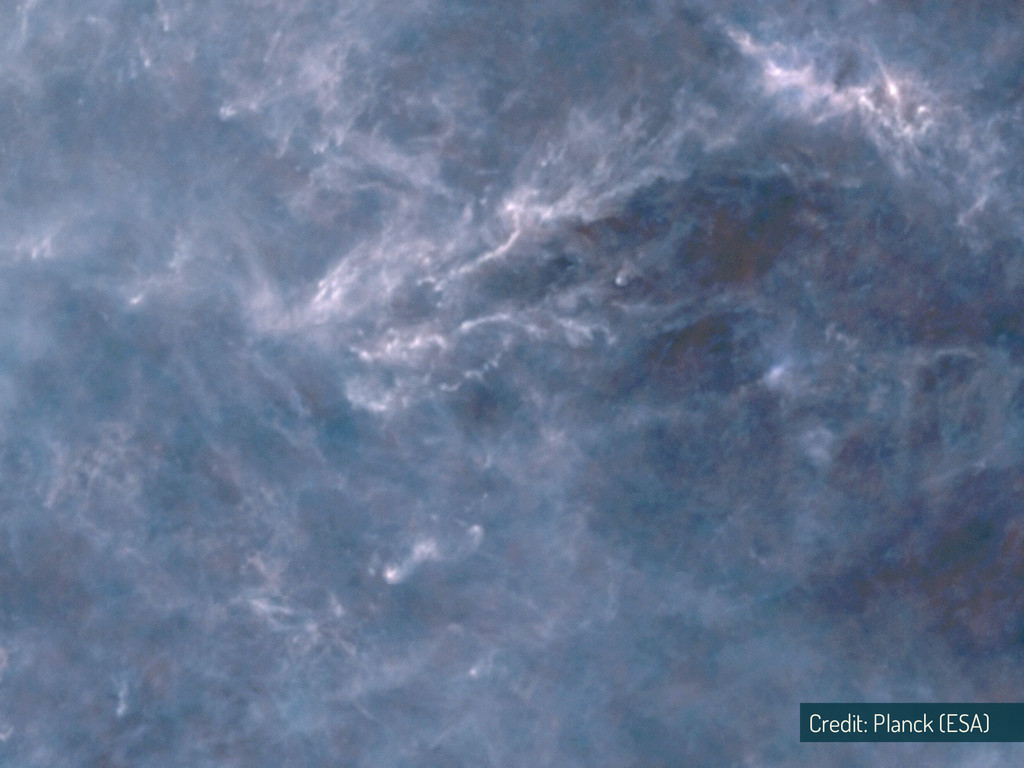
Credit: Planck (ESA)
Credit: Axel Mellinger
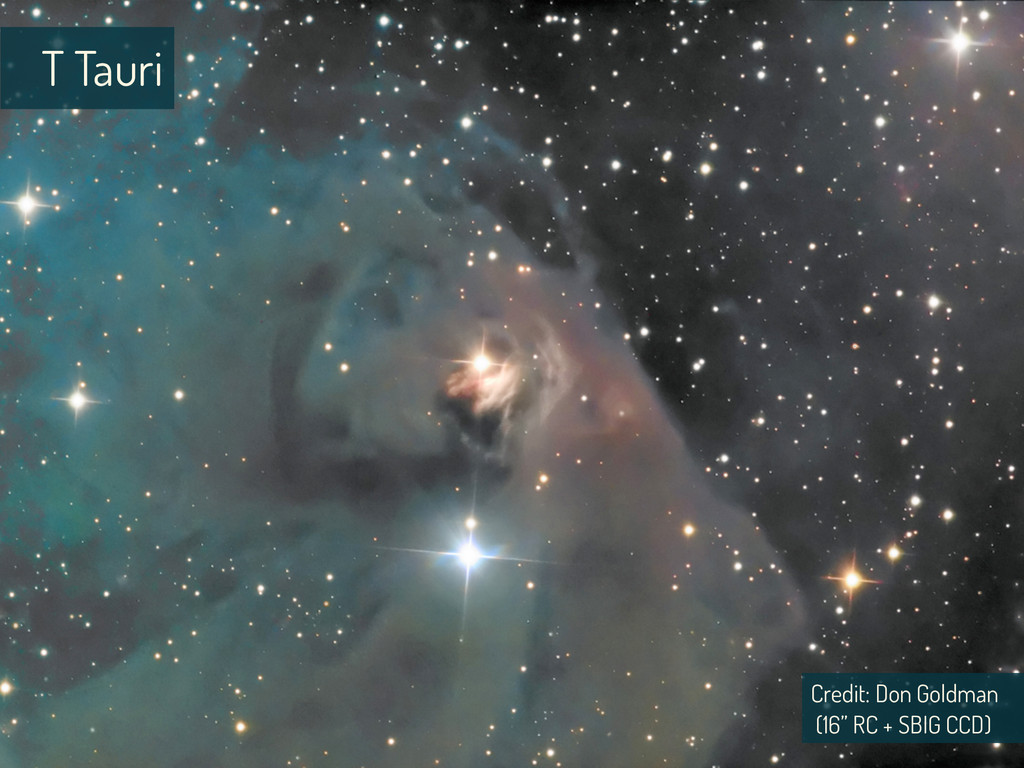
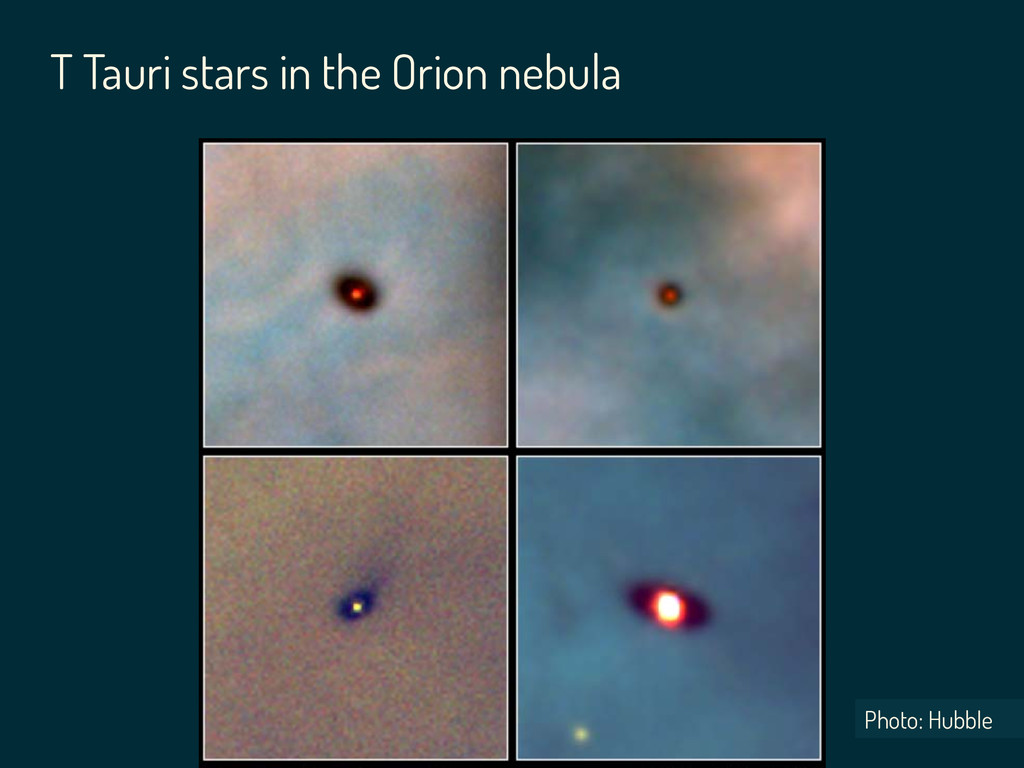
T Tauri Credit: Don Goldman (16” RC + SBIG CCD)
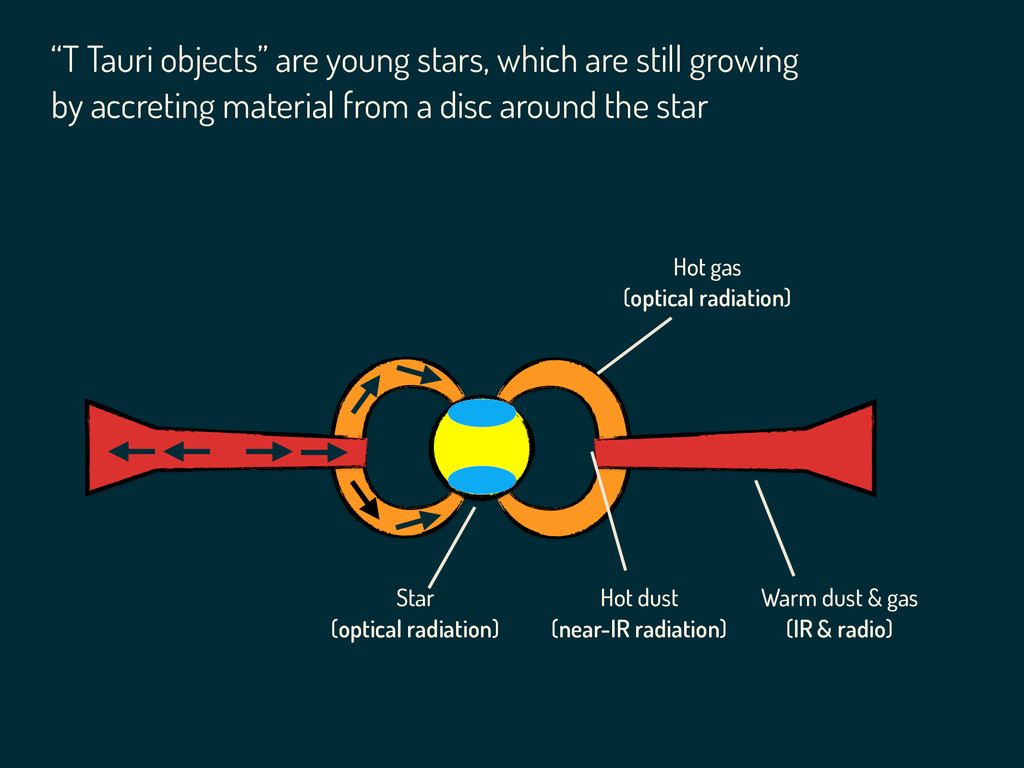
Star (optical radiation) Hot dust (near-IR radiation) Warm dust &
gas (IR & radio) Hot gas (optical radiation) “T Tauri objects” are young stars, which are still growing by accreting material from a disc around the star
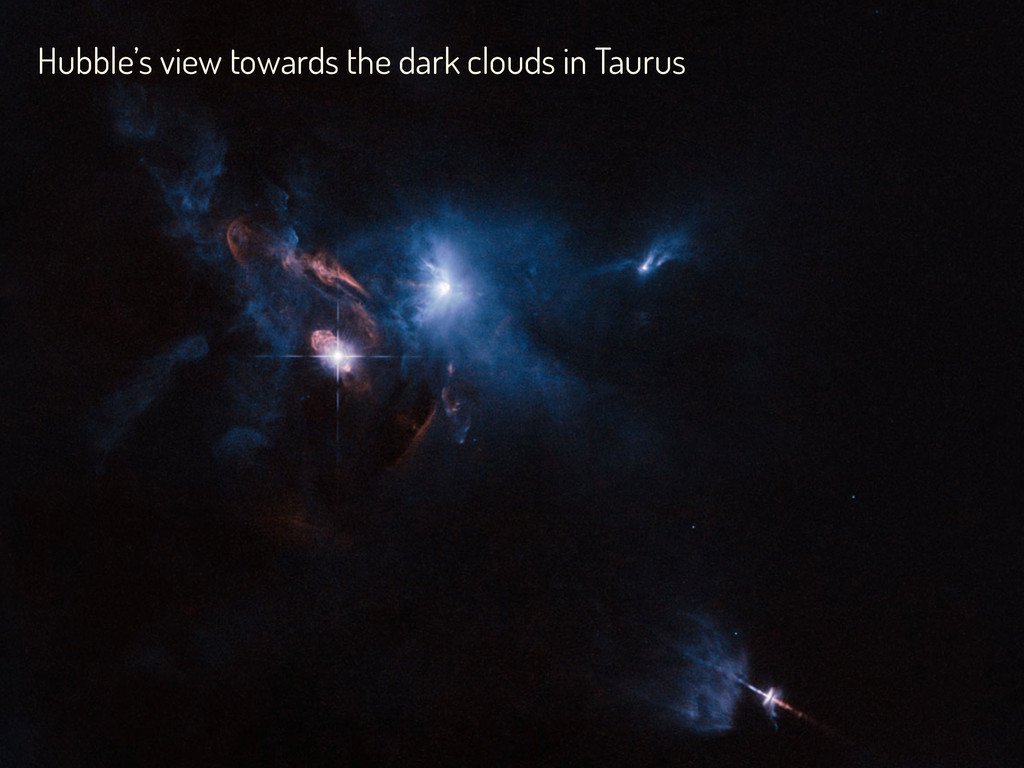
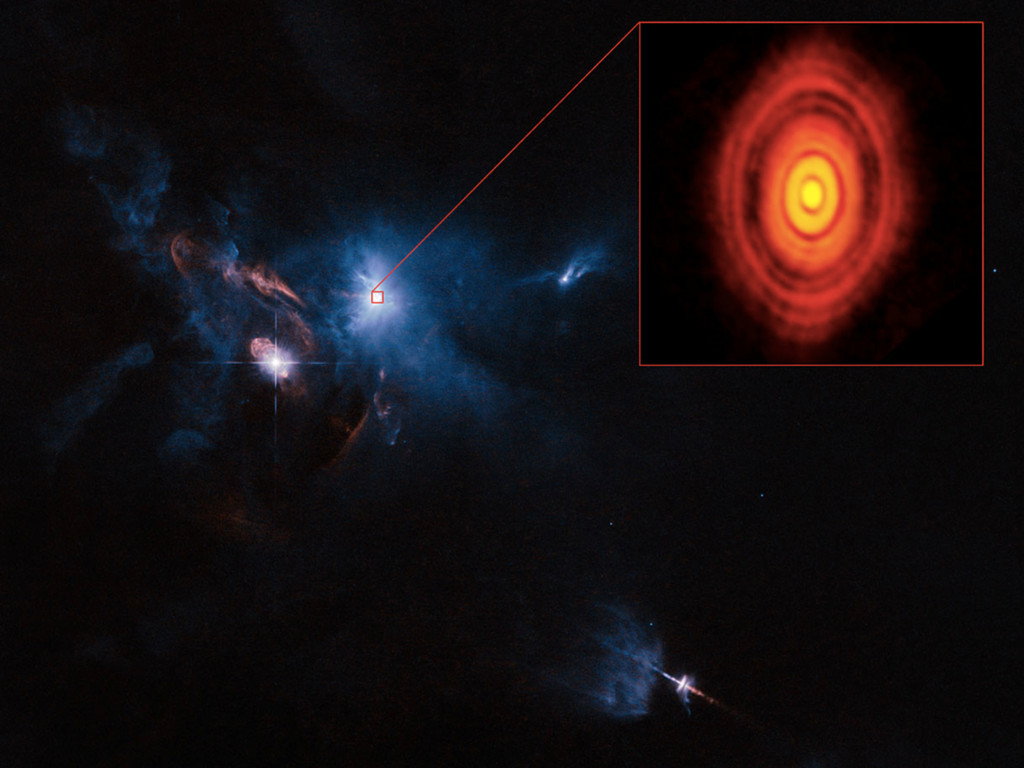
Hubble’s view towards the dark clouds in Taurus
None
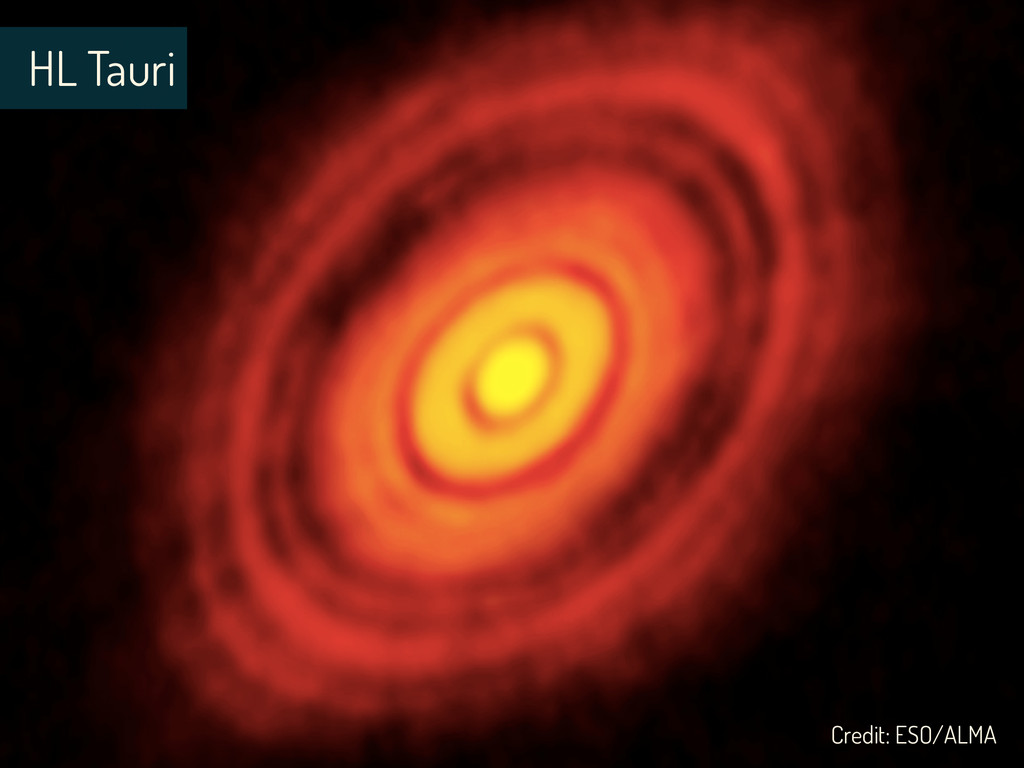
Credit: ESO/ALMA HL Tauri
T Tauri stars in the Orion nebula Photo: Hubble
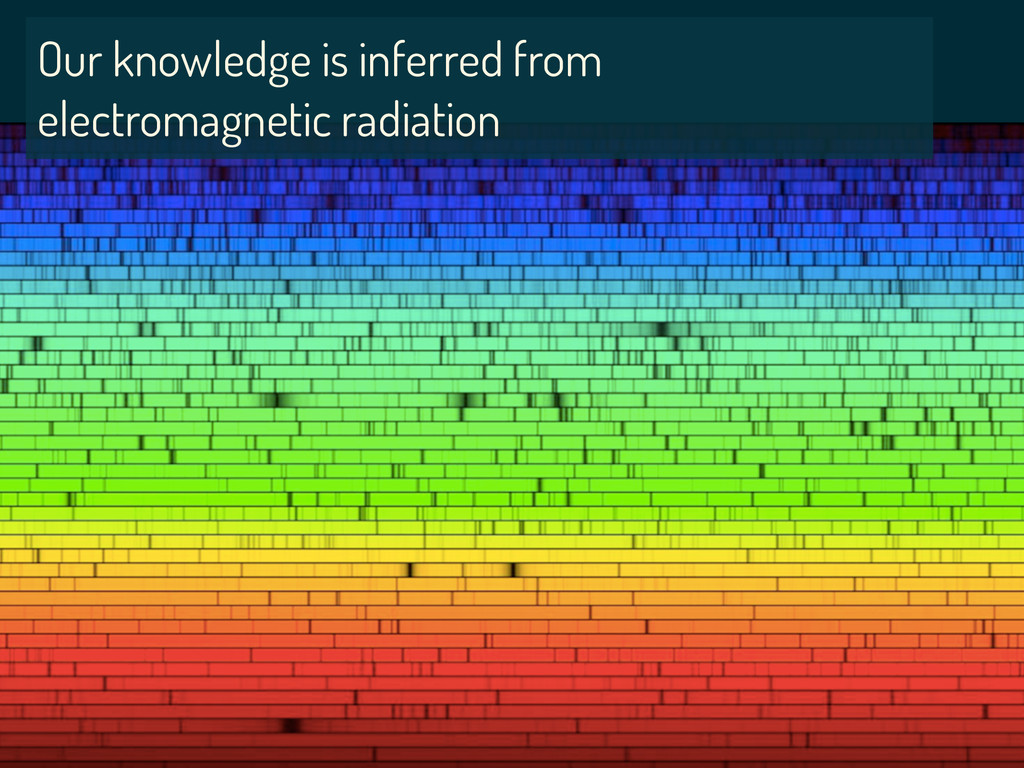
Our knowledge is inferred from electromagnetic radiation
wavelength intensity
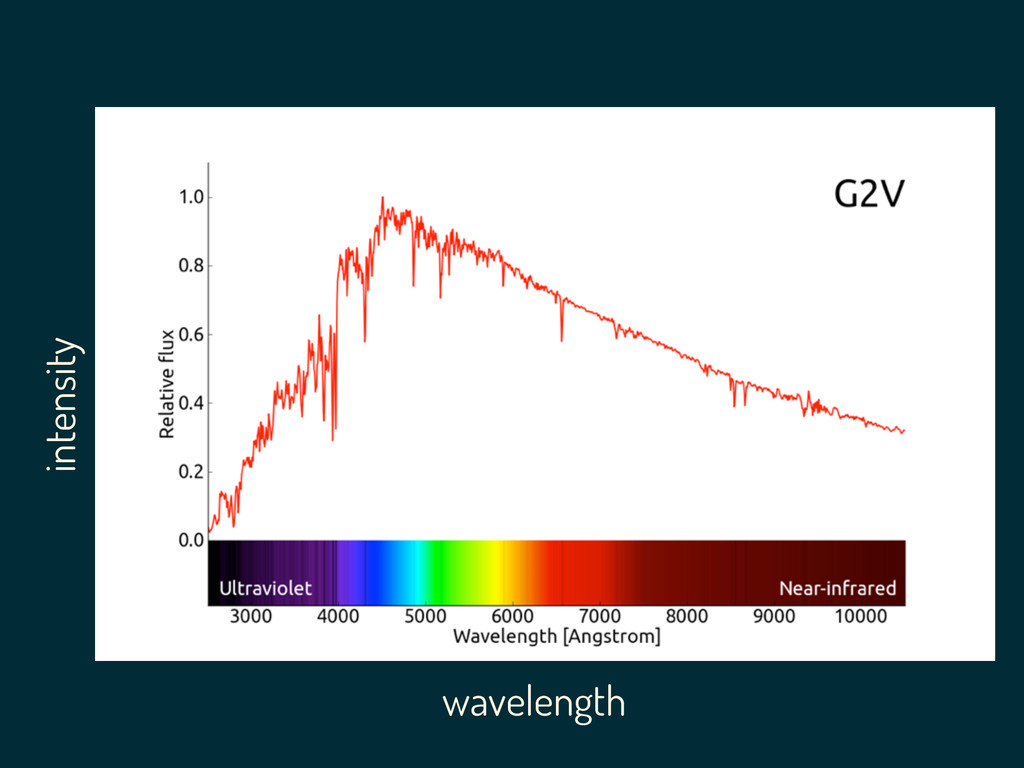
wavelength intensity
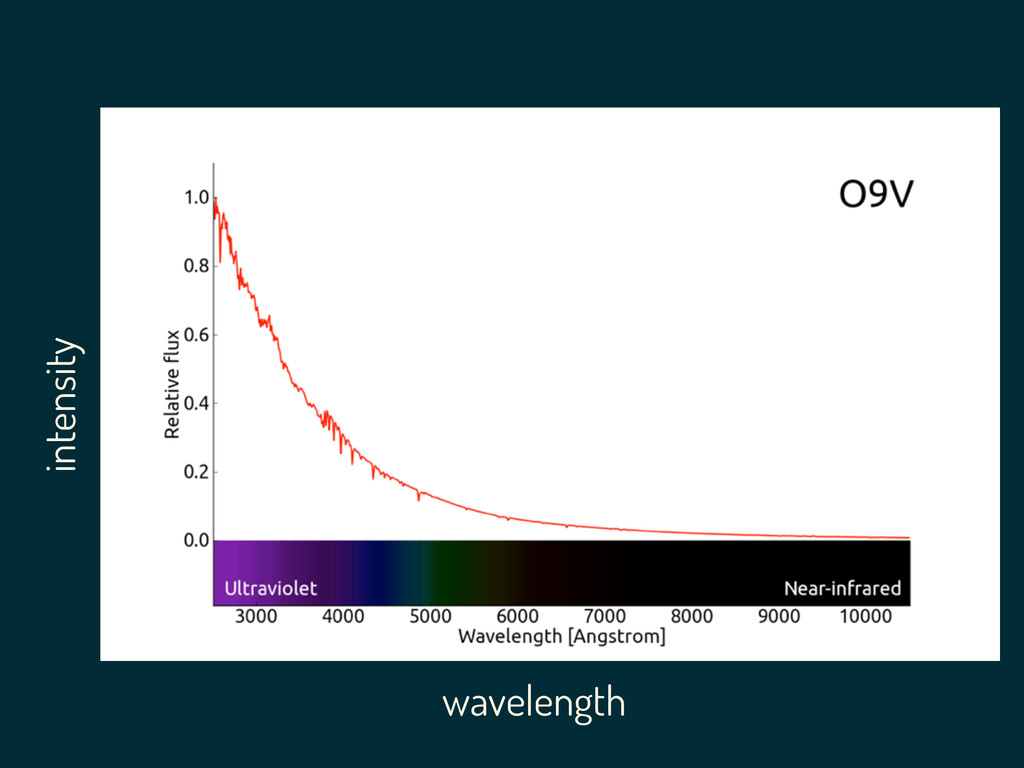
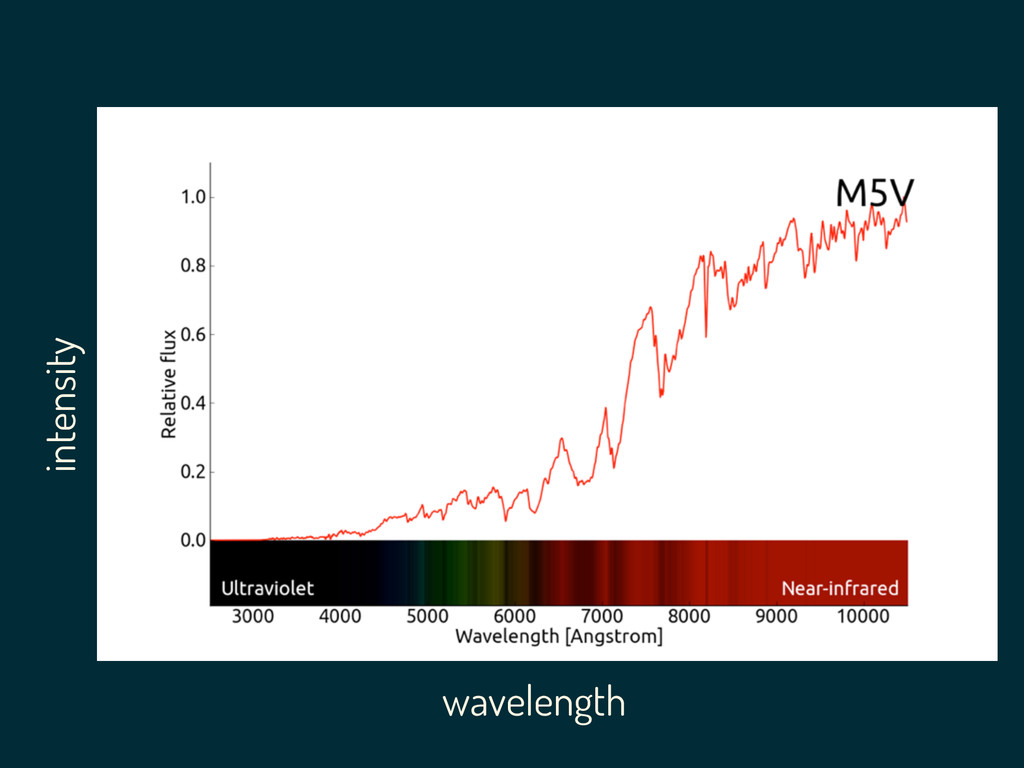
wavelength intensity
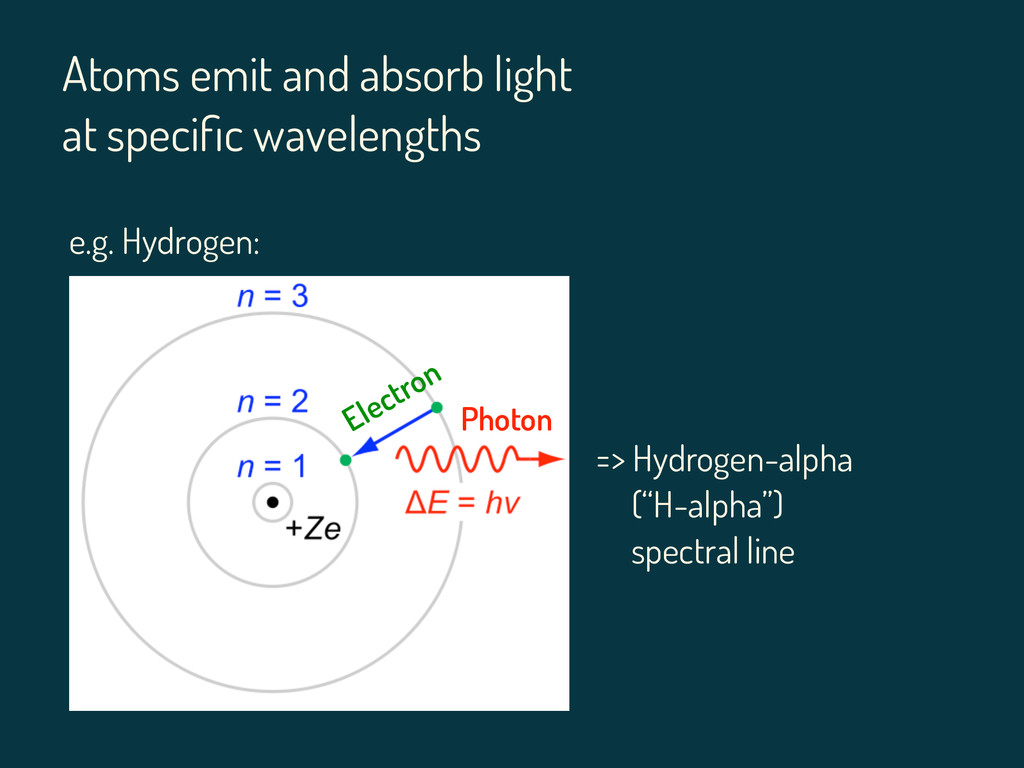
Electron Photon Atoms emit and absorb light at specific wavelengths
=> Hydrogen-alpha (“H-alpha”) spectral line e.g. Hydrogen:
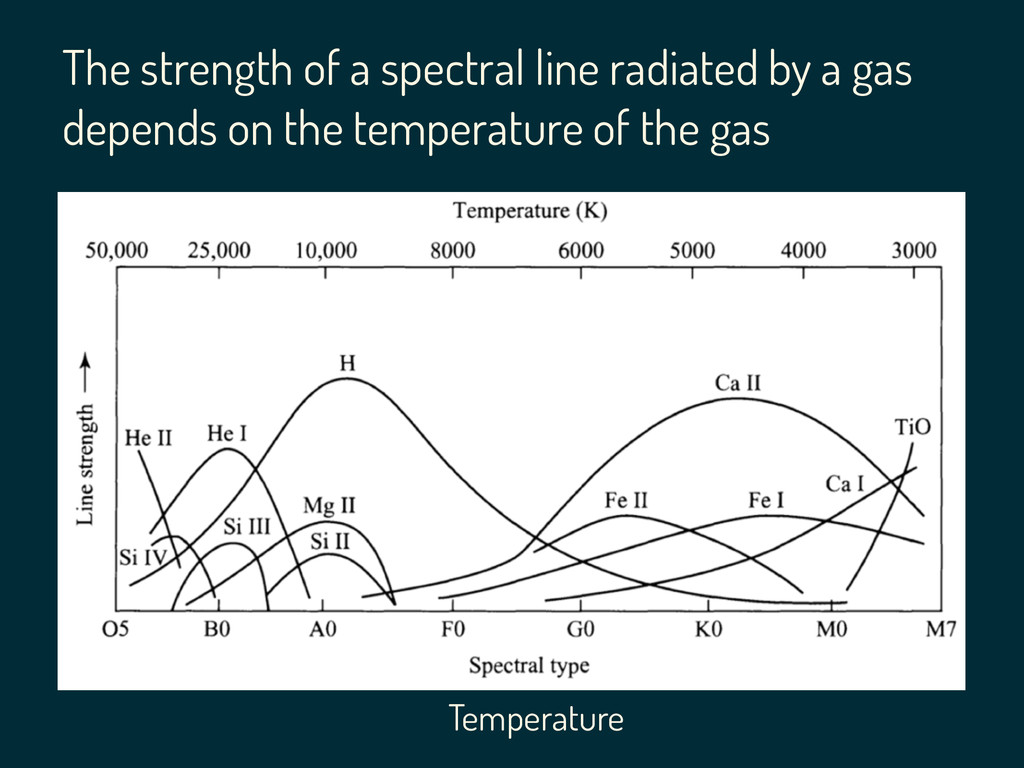
The strength of a spectral line radiated by a gas
depends on the temperature of the gas Temperature
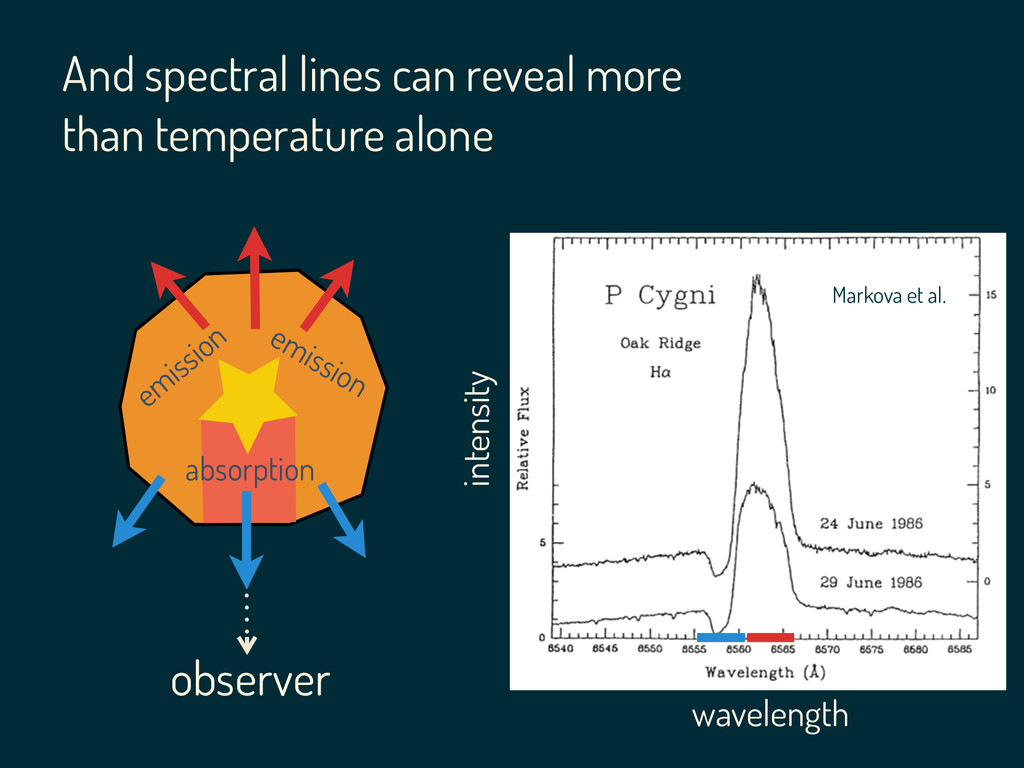
And spectral lines can reveal more than temperature alone observer
em ission emission absorption Markova et al. wavelength intensity
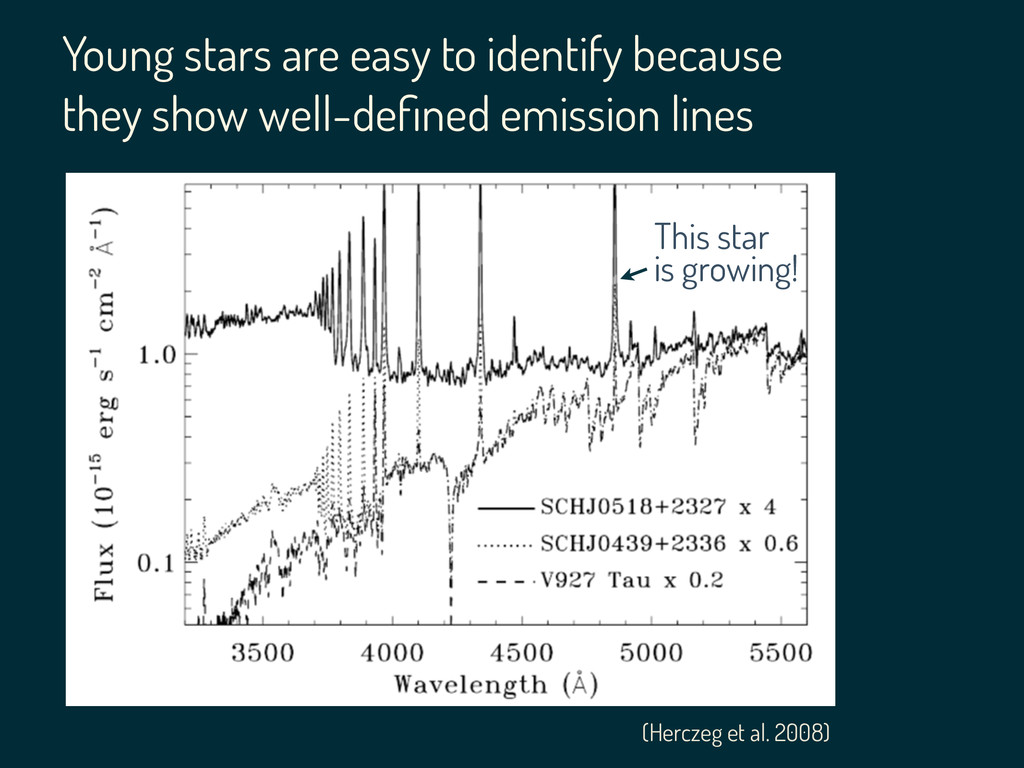
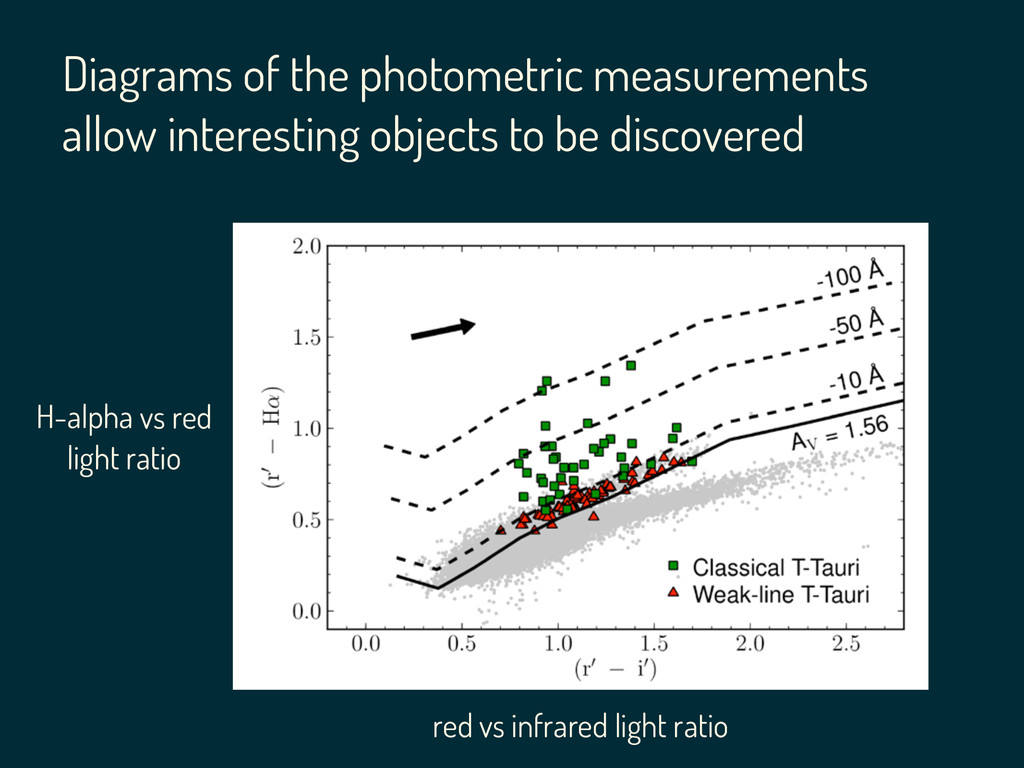
(Herczeg et al. 2008) Young stars are easy to identify
because they show well-defined emission lines This star is growing!
300 billion stars It is impossible to collect spectra for
all the objects in our Galaxy
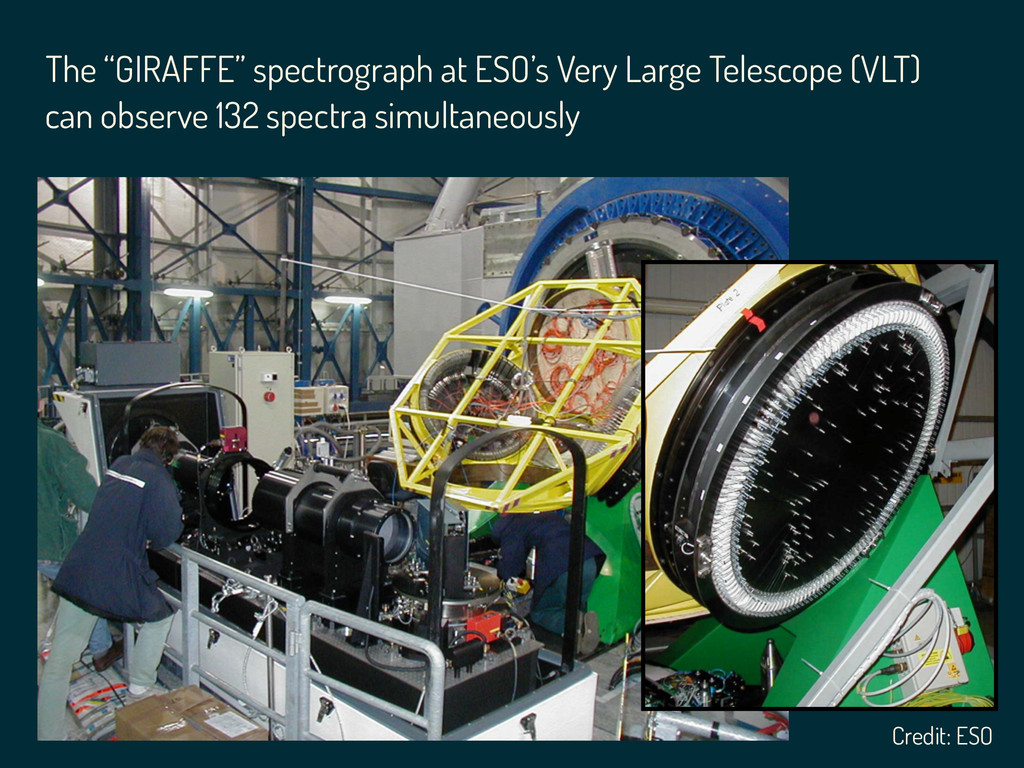
The “GIRAFFE” spectrograph at ESO’s Very Large Telescope (VLT) can
observe 132 spectra simultaneously Credit: ESO
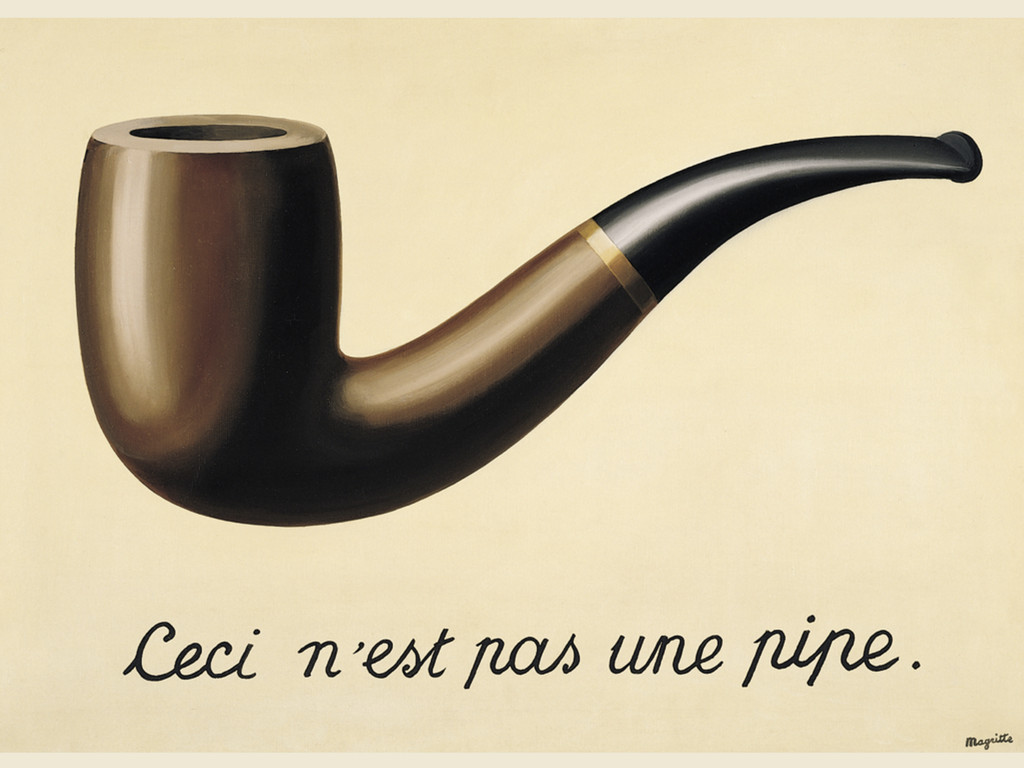
Ceci n`est pas La Voie Lactee
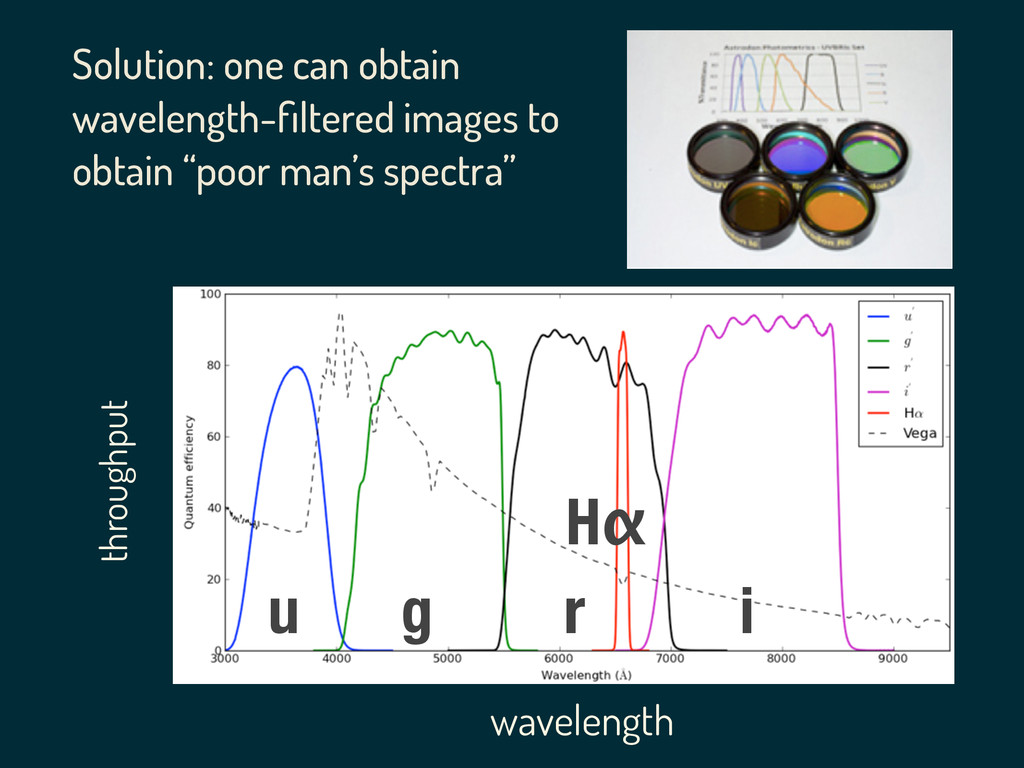
g r u i Hα Solution: one can obtain wavelength-filtered
images to obtain “poor man’s spectra” wavelength throughput
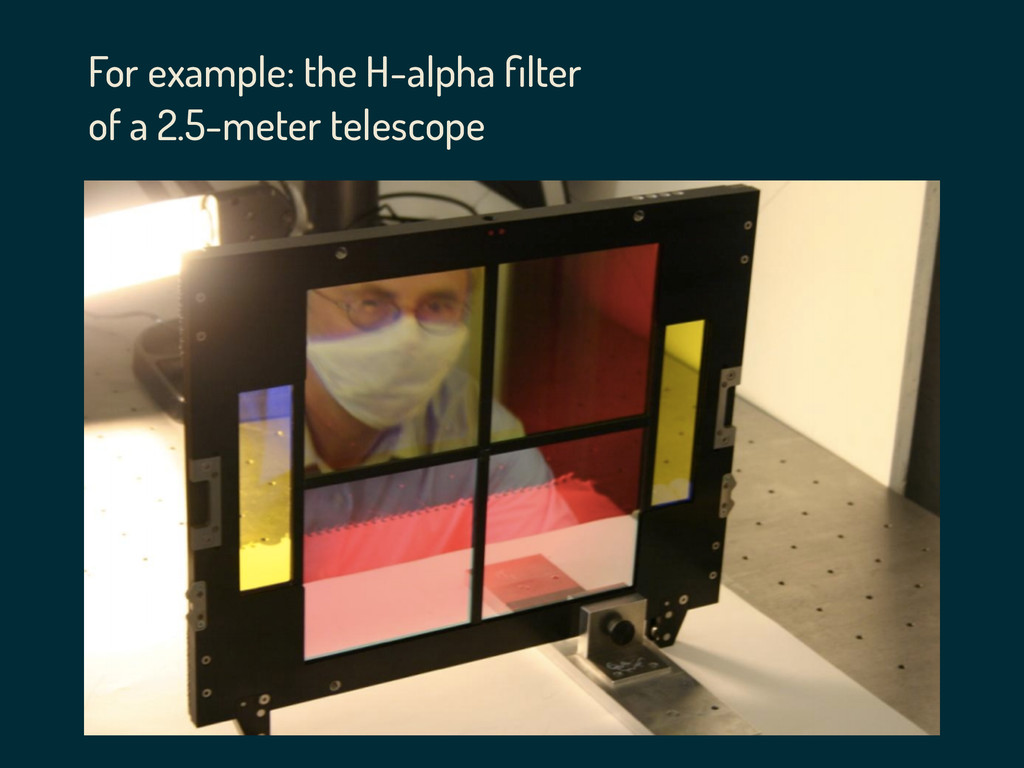
For example: the H-alpha filter of a 2.5-meter telescope
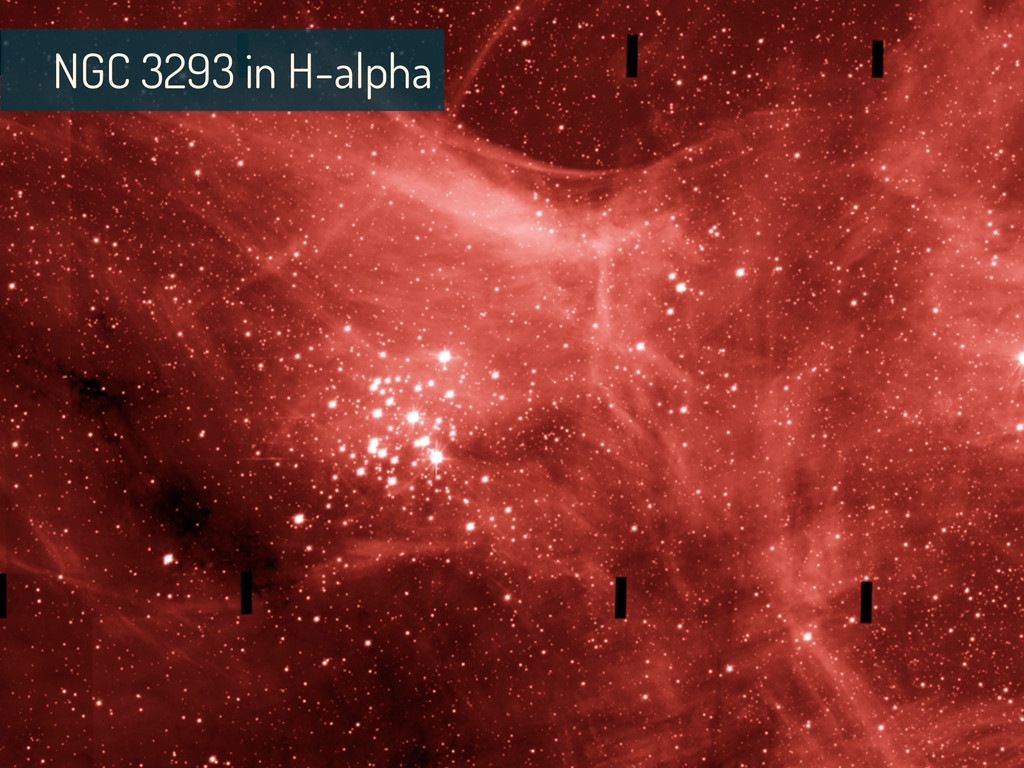
NGC 3293 in H-alpha
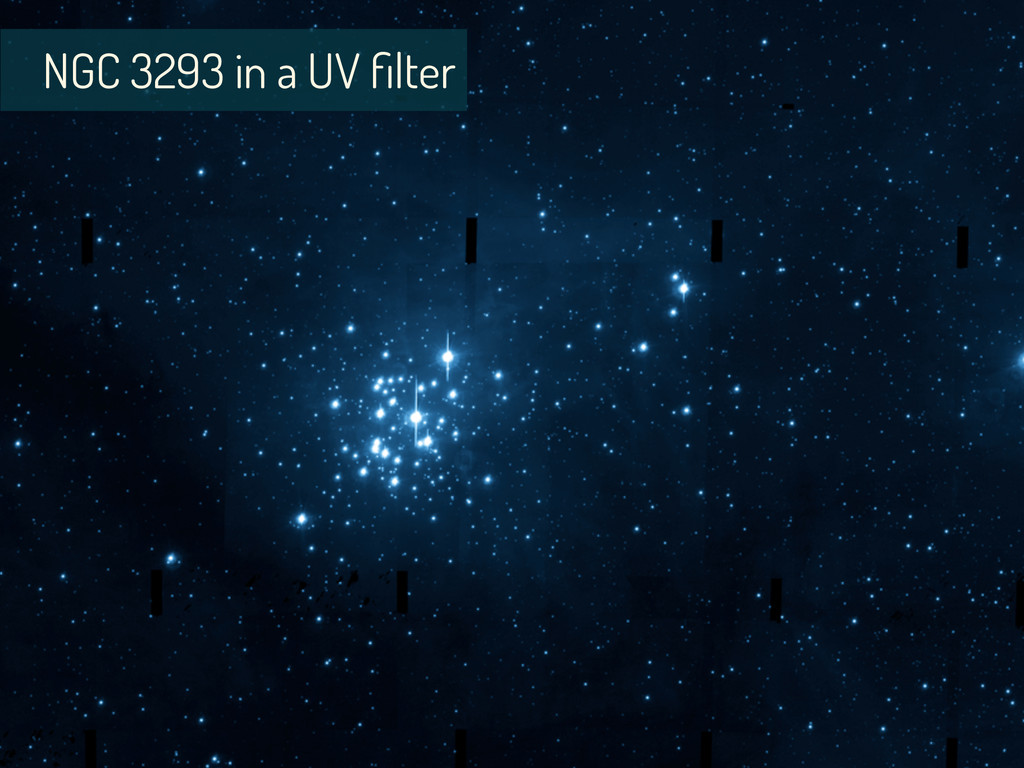
NGC 3293 in a UV filter
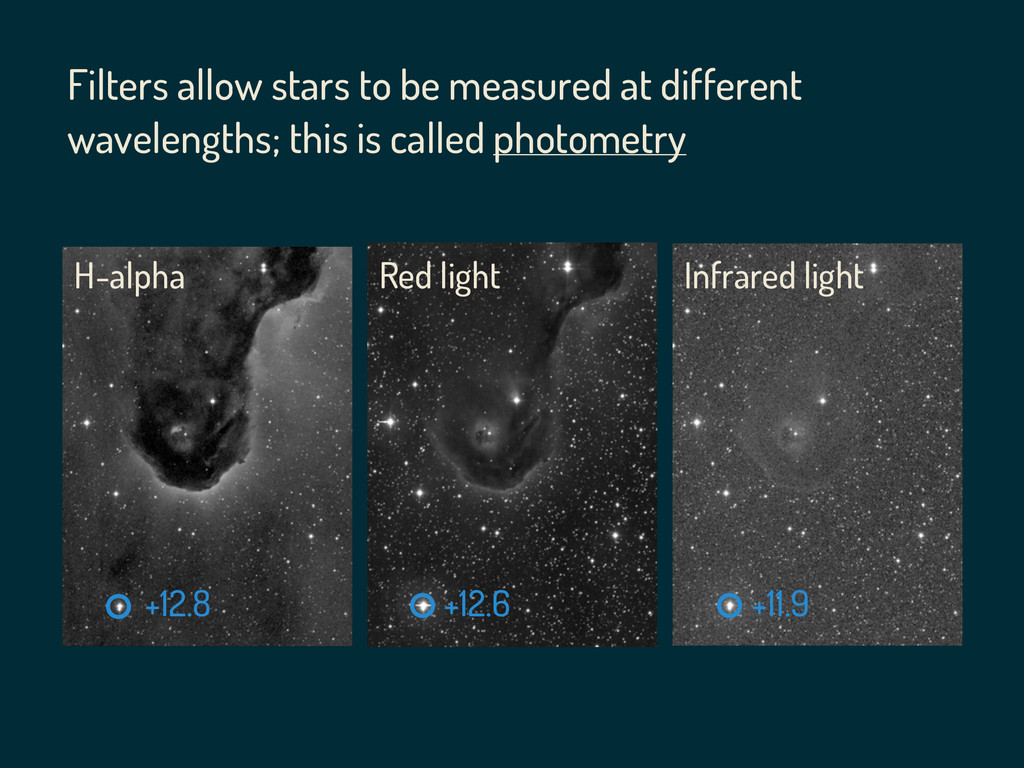
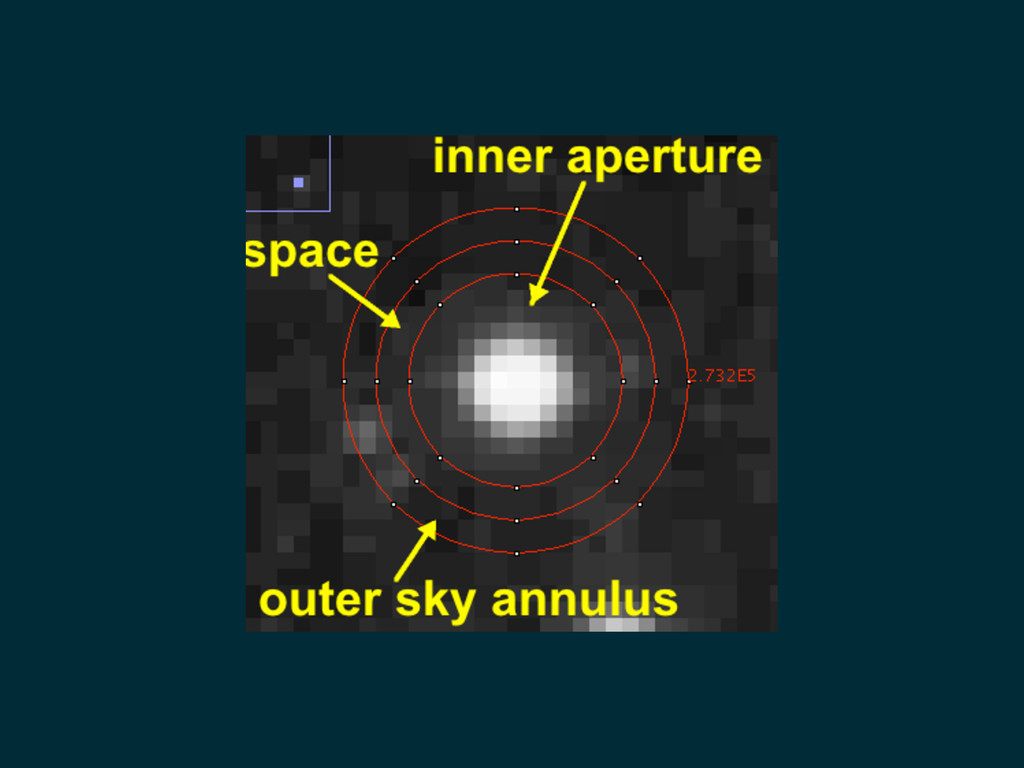
Filters allow stars to be measured at different wavelengths; this
is called photometry H-alpha Red light Infrared light +12.8 +12.6 +11.9
None
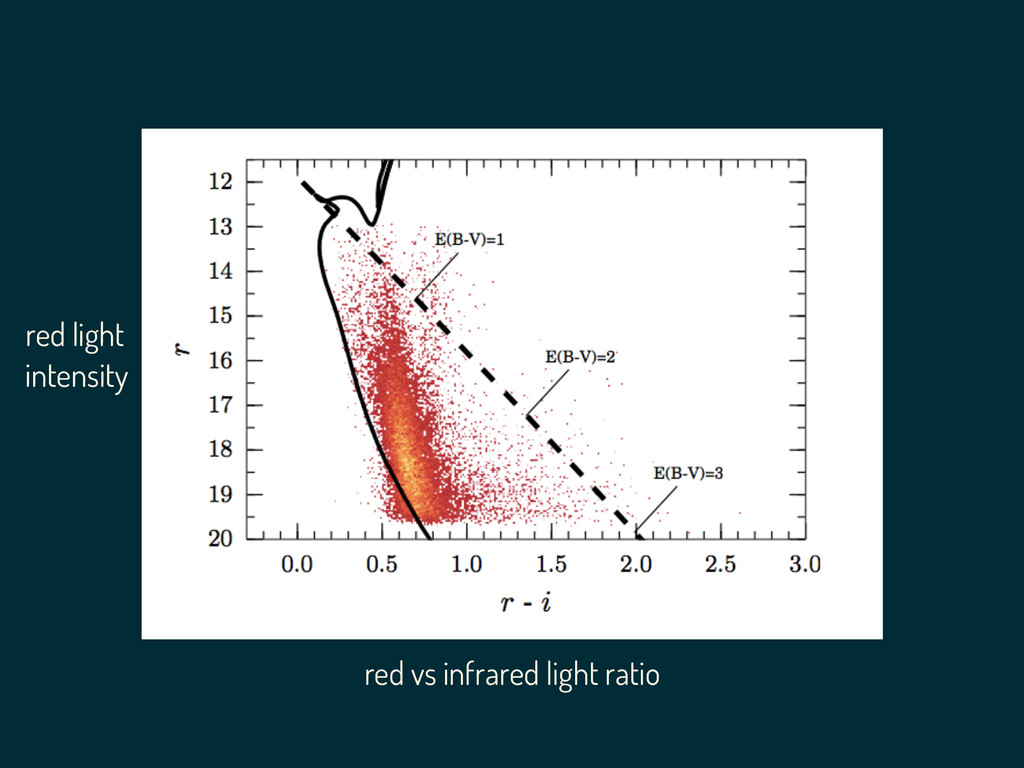
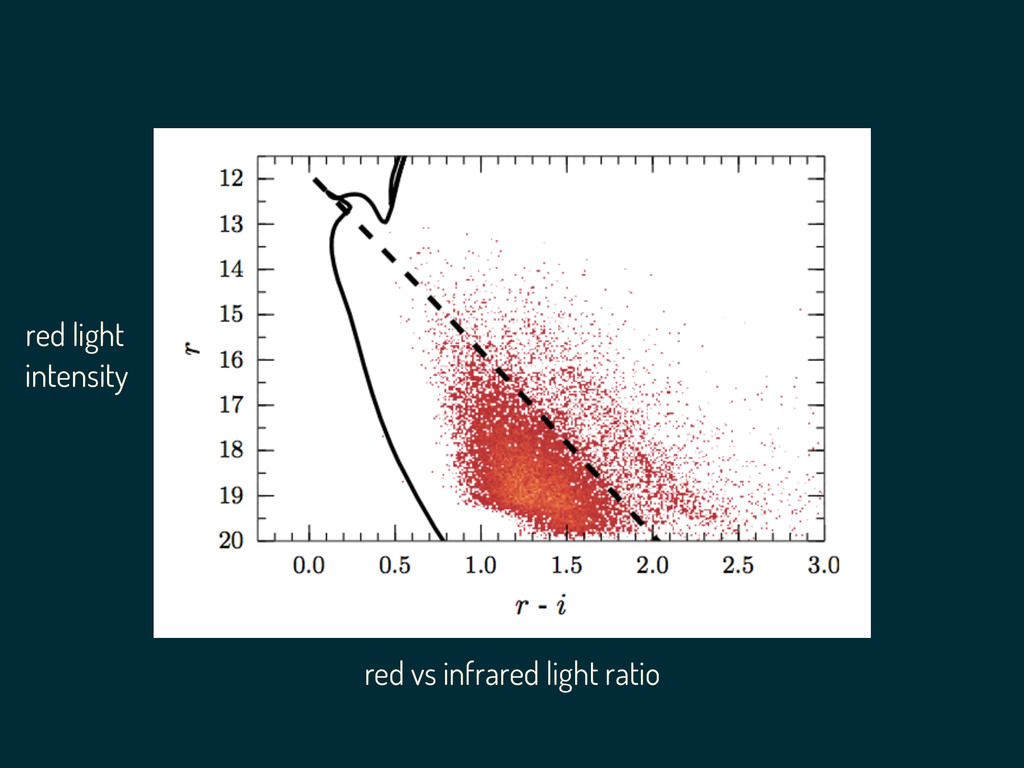
red vs infrared light ratio red light intensity
red light intensity red vs infrared light ratio
Diagrams of the photometric measurements allow interesting objects to be
discovered H-alpha vs red light ratio red vs infrared light ratio
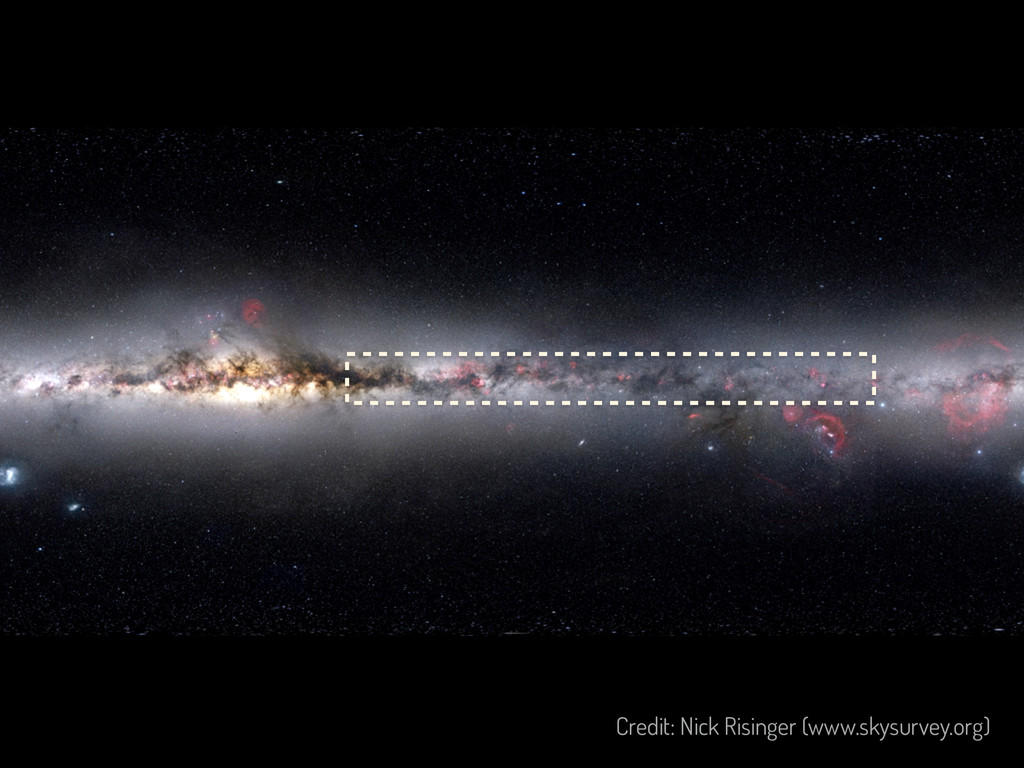
IC 1396 (Cepheus) Area studied using spectra Area studied using
photometry
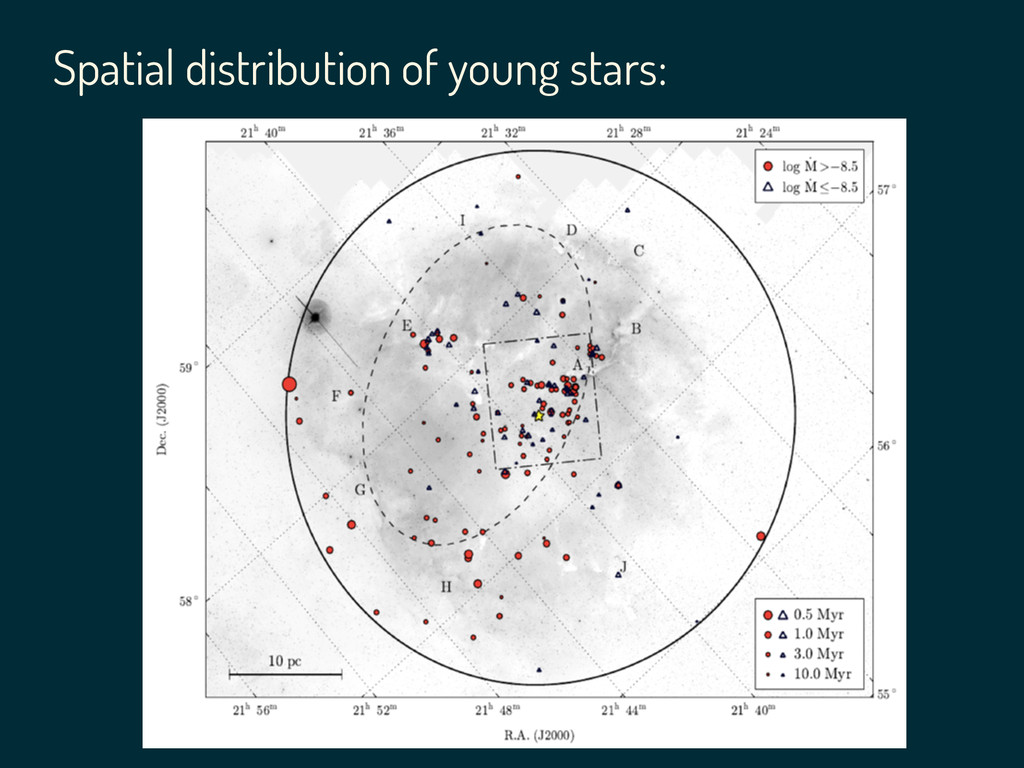
Spatial distribution of young stars:
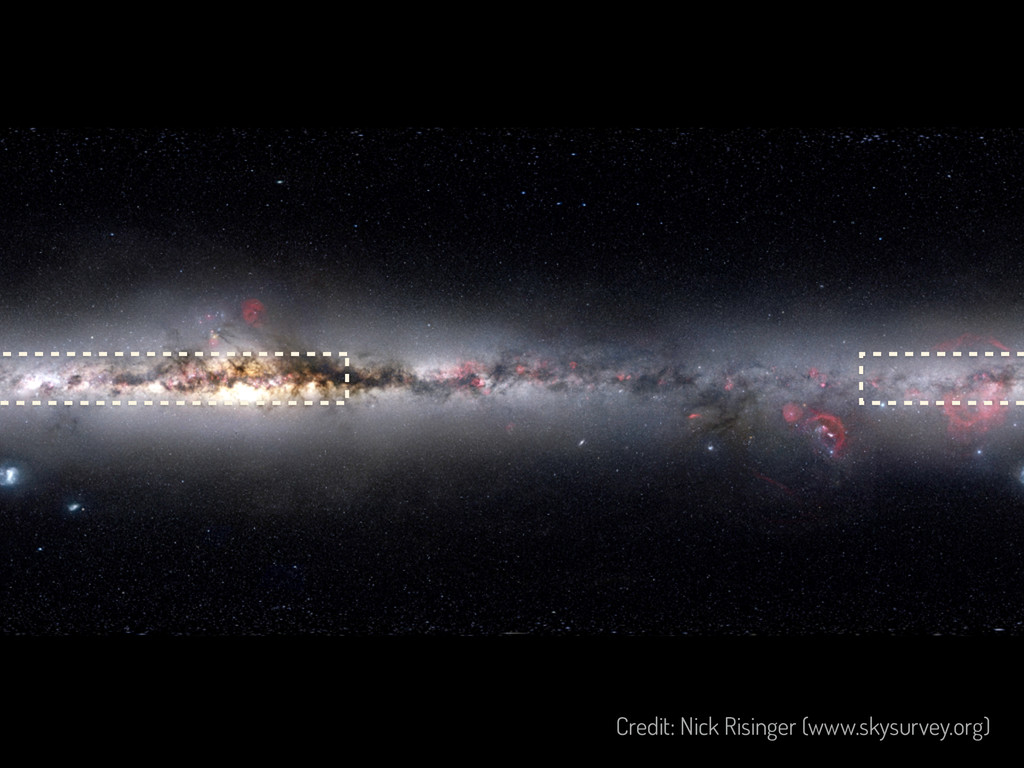
How to obtain photometry across the Galaxy?
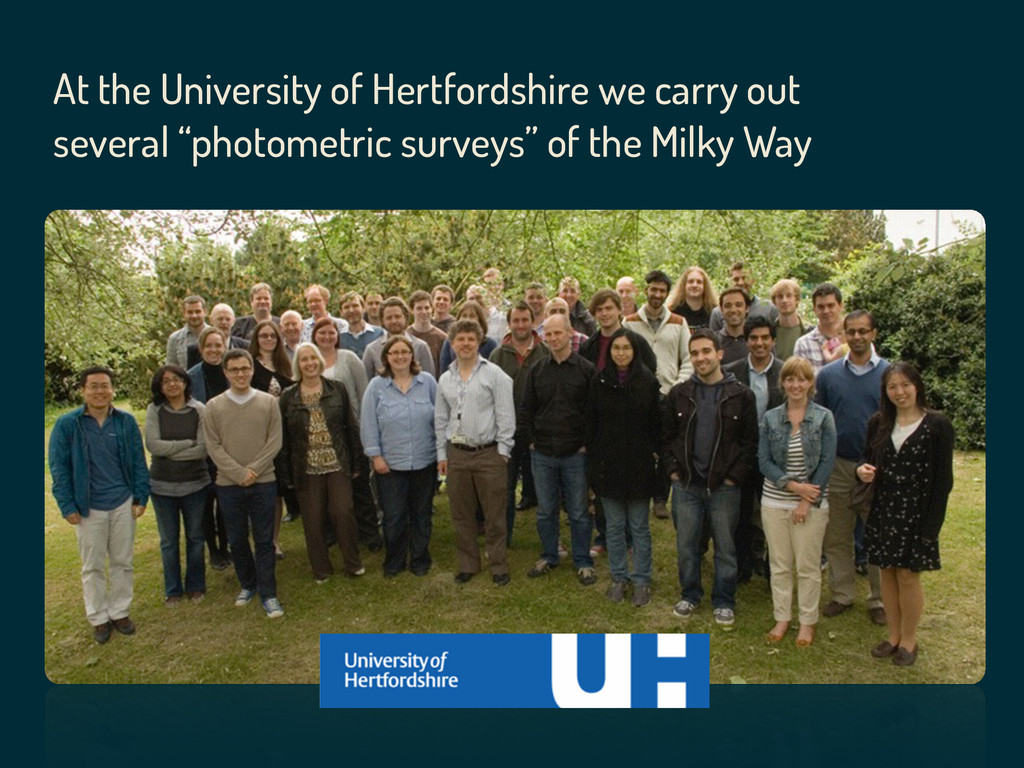
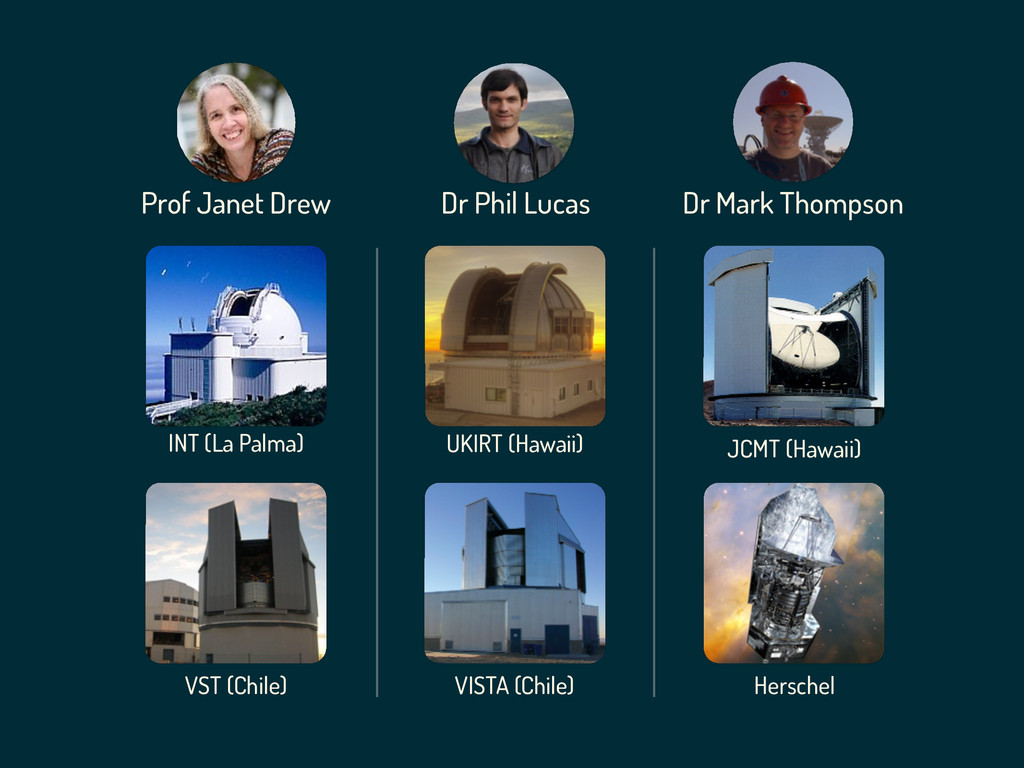
At the University of Hertfordshire we carry out several “photometric
surveys” of the Milky Way
INT (La Palma) VST (Chile) UKIRT (Hawaii) VISTA (Chile) JCMT
(Hawaii) Herschel Prof Janet Drew Dr Phil Lucas Dr Mark Thompson
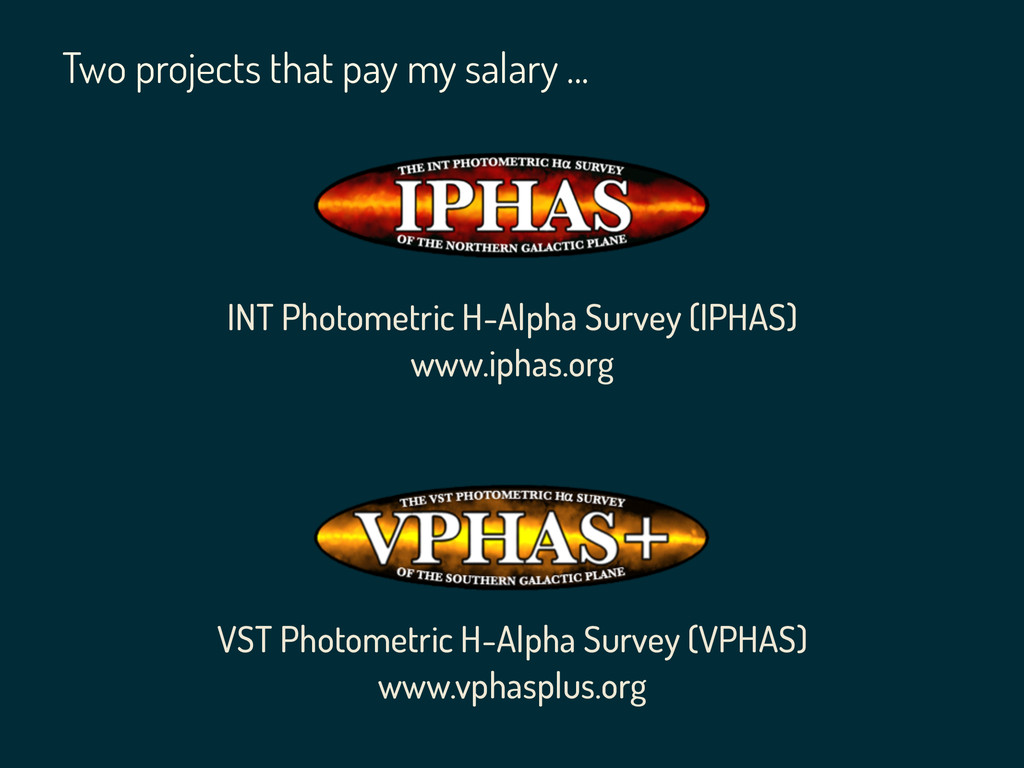
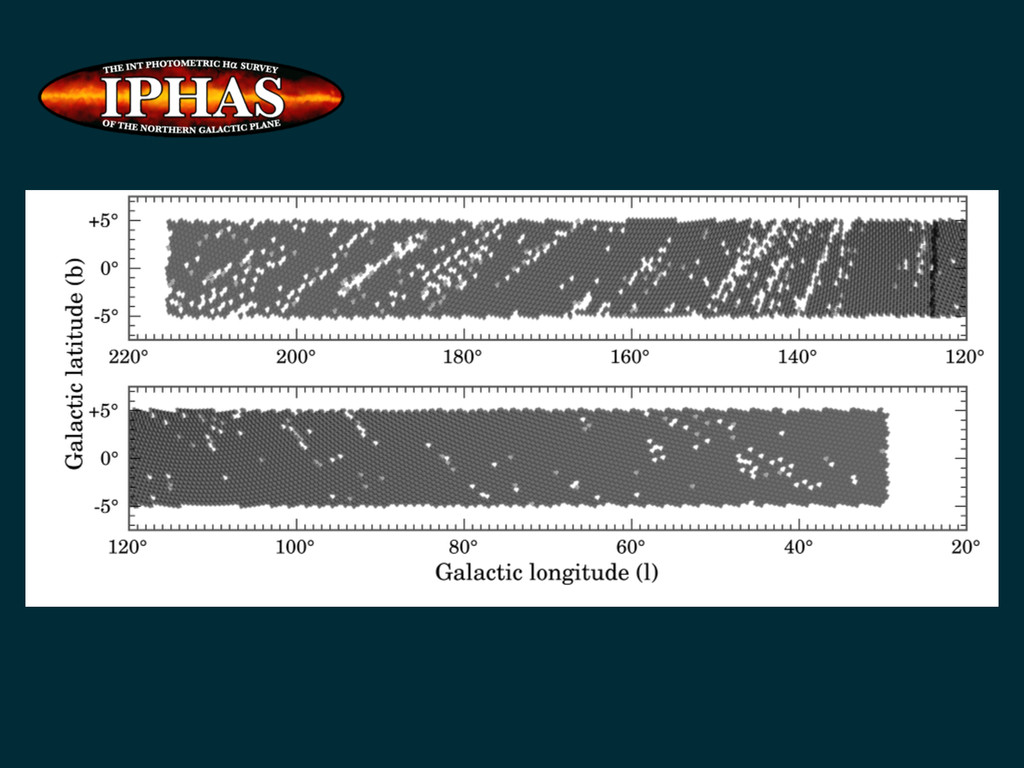
INT Photometric H-Alpha Survey (IPHAS) www.iphas.org ! ! !
VST Photometric H-Alpha Survey (VPHAS) www.vphasplus.org Two projects that pay my salary …
Credit: Nick Risinger (www.skysurvey.org)
None
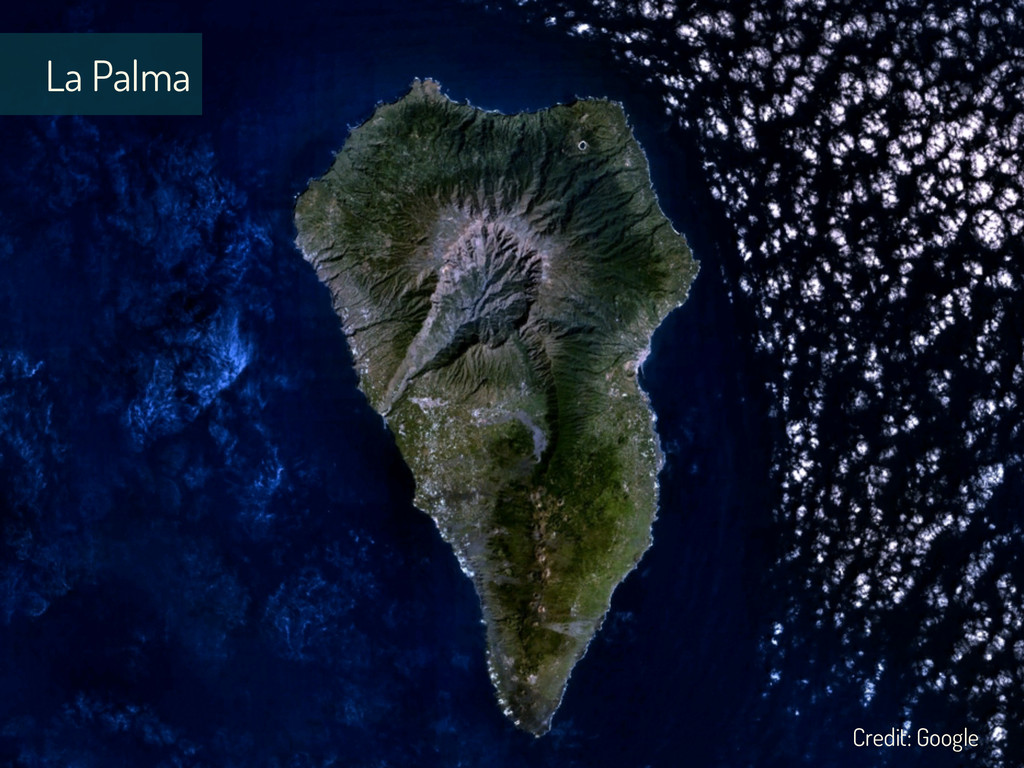
La Palma Credit: Google
None
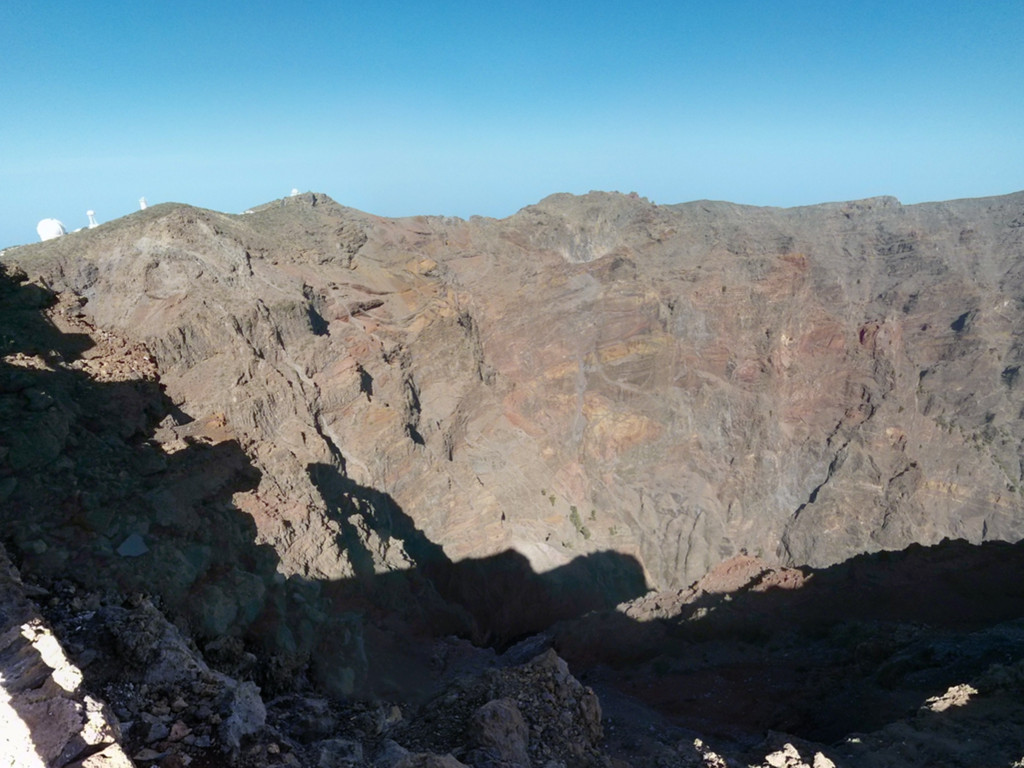
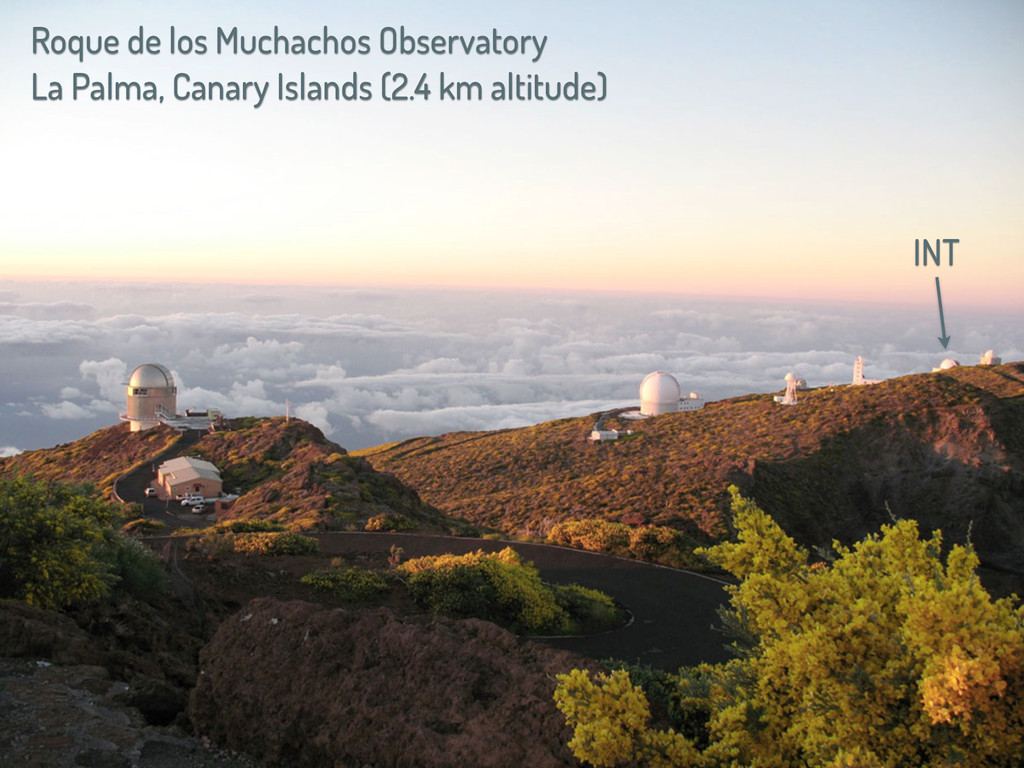
Roque de los Muchachos Observatory La Palma, Canary Islands (2.4
km altitude) INT
None
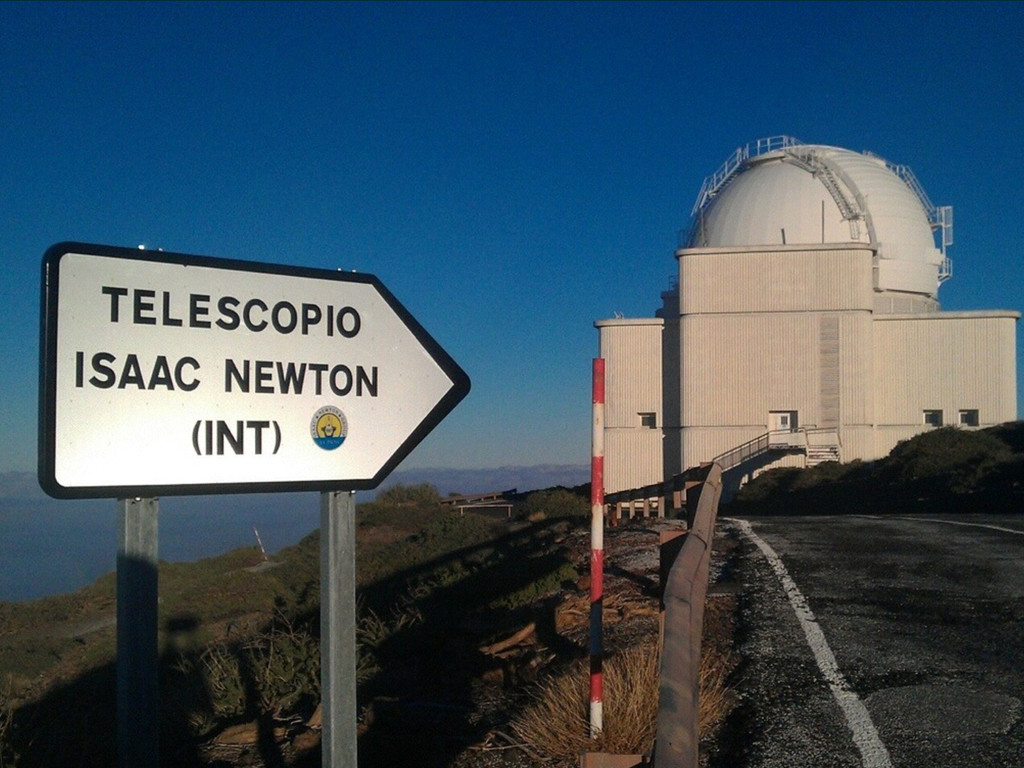
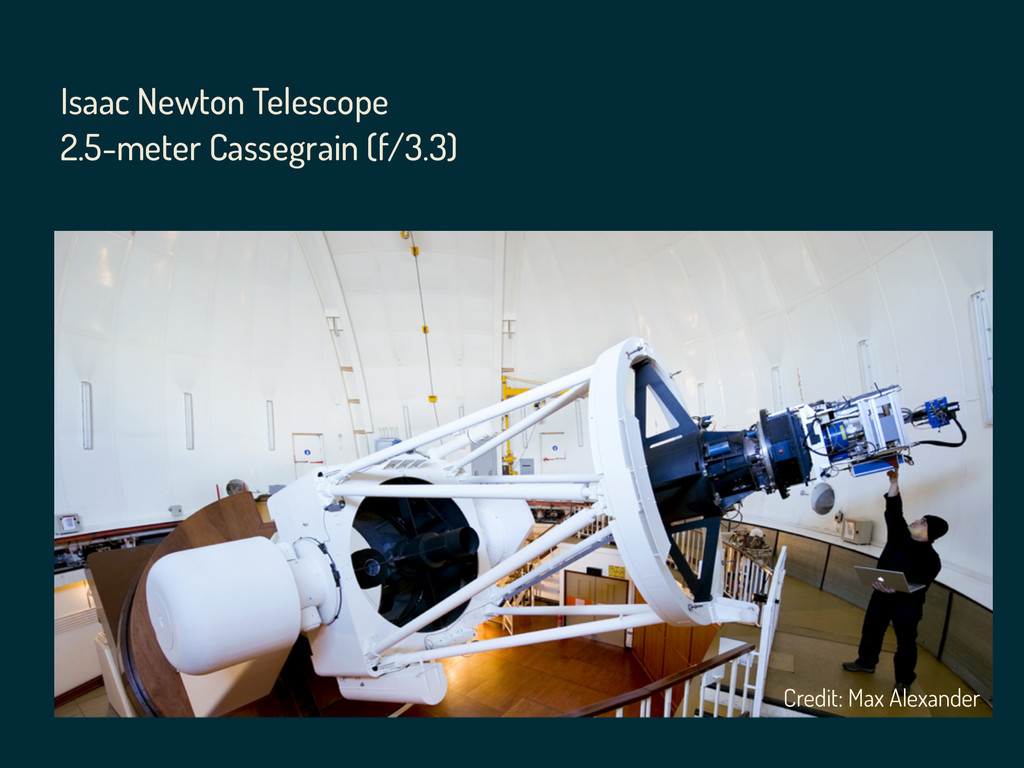
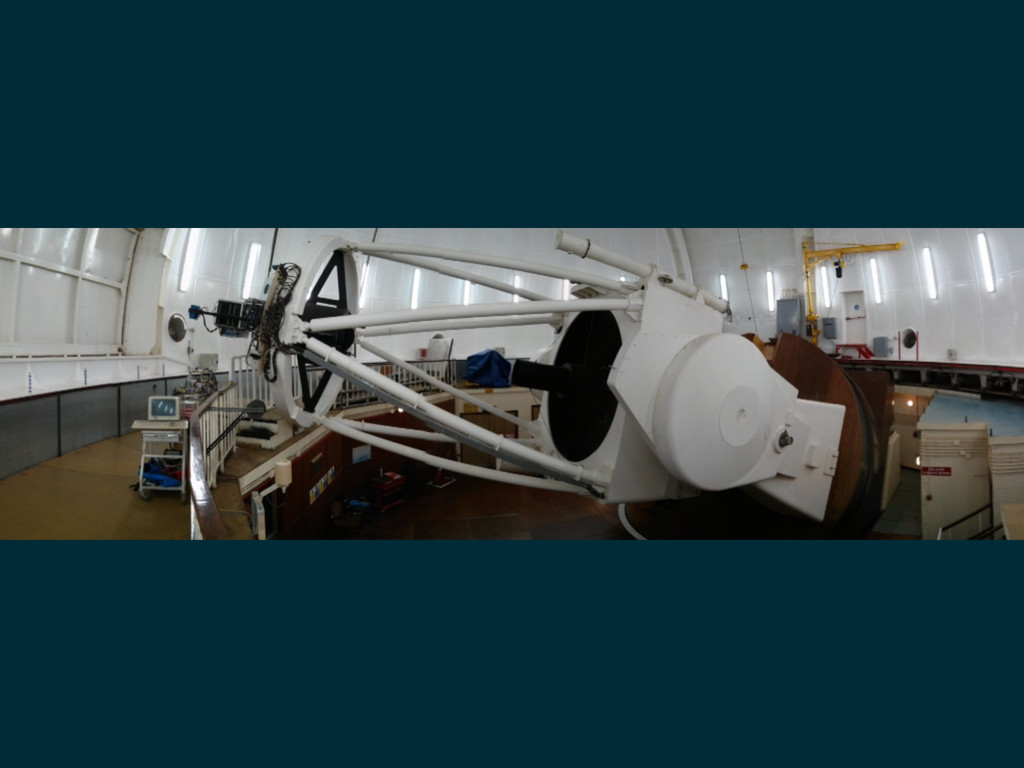
Isaac Newton Telescope 2.5-meter Cassegrain (f/3.3) Credit: Max Alexander
None
None
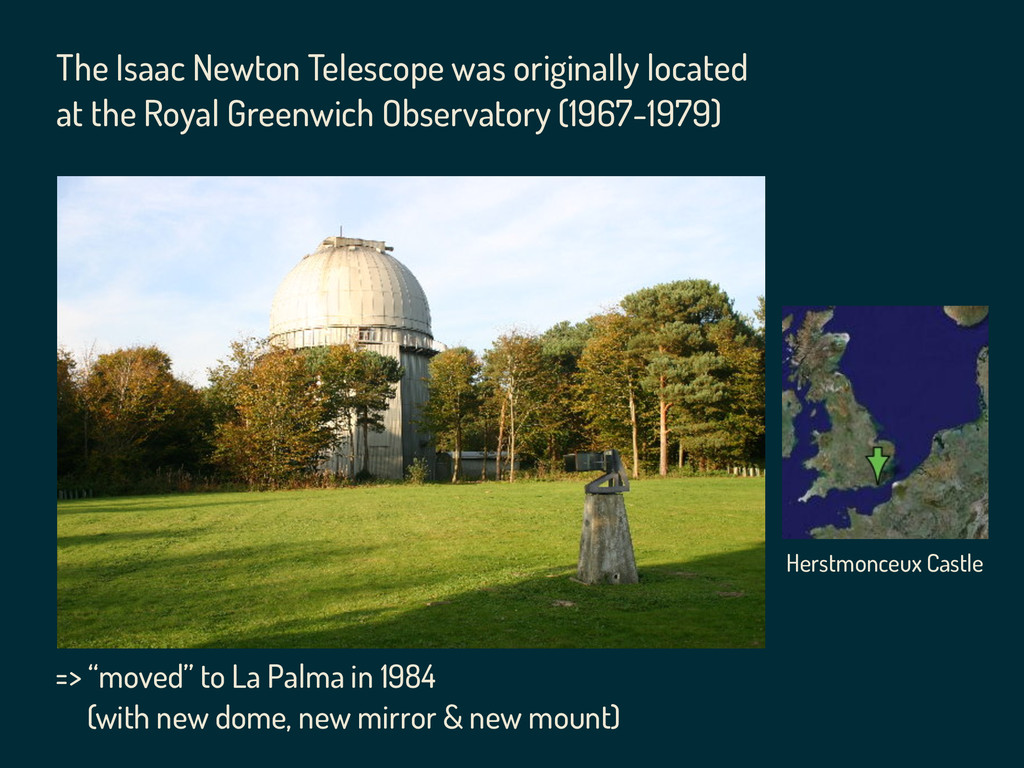
=> “moved” to La Palma in 1984 (with new dome,
new mirror & new mount) Herstmonceux Castle The Isaac Newton Telescope was originally located at the Royal Greenwich Observatory (1967-1979)
None
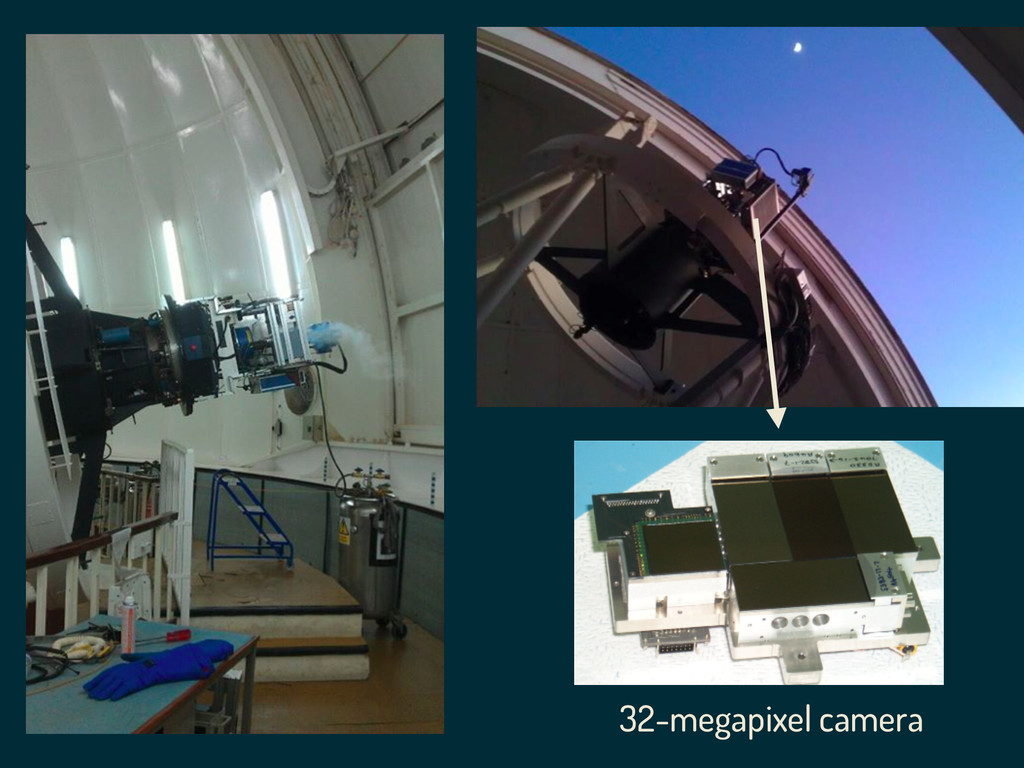
32-megapixel camera
None
None
Credit: Nick Risinger (www.skysurvey.org)
None
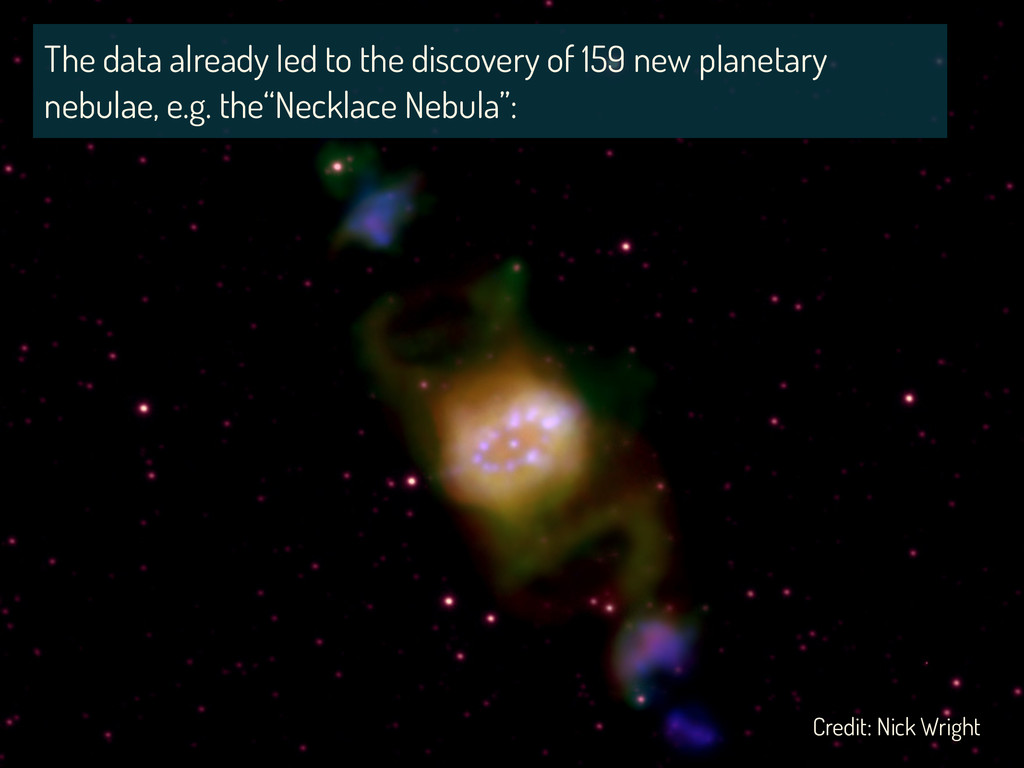
The data already led to the discovery of 159 new
planetary nebulae, e.g. the“Necklace Nebula”: Credit: Nick Wright
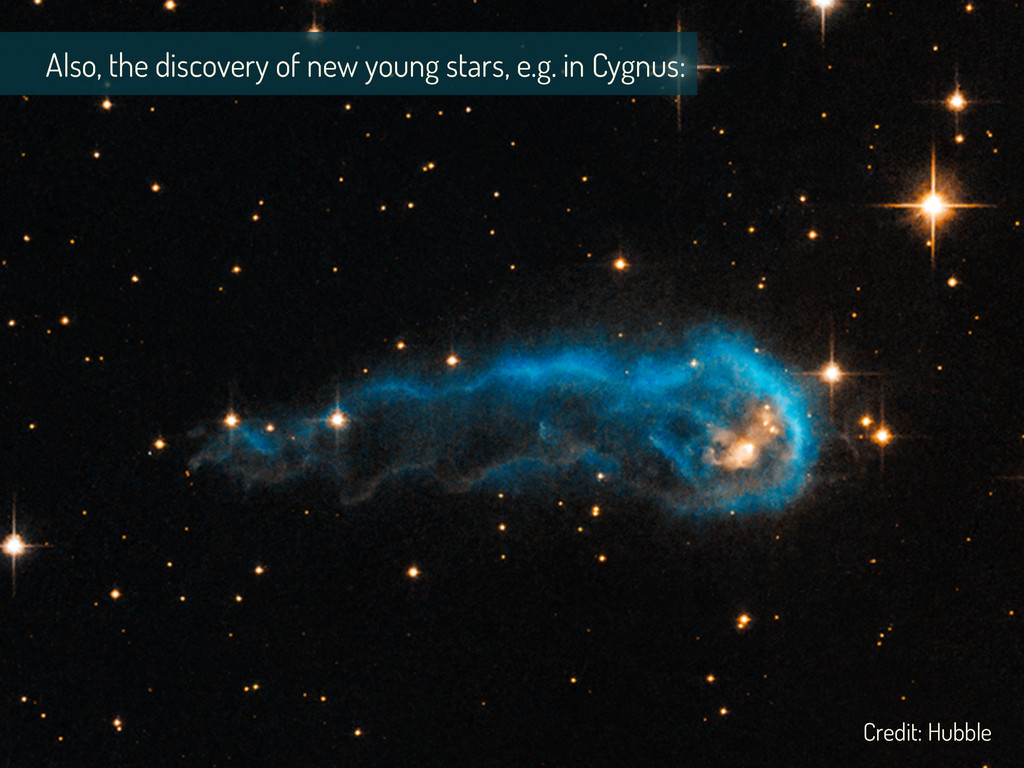
Also, the discovery of new young stars, e.g. in Cygnus:
Credit: Hubble
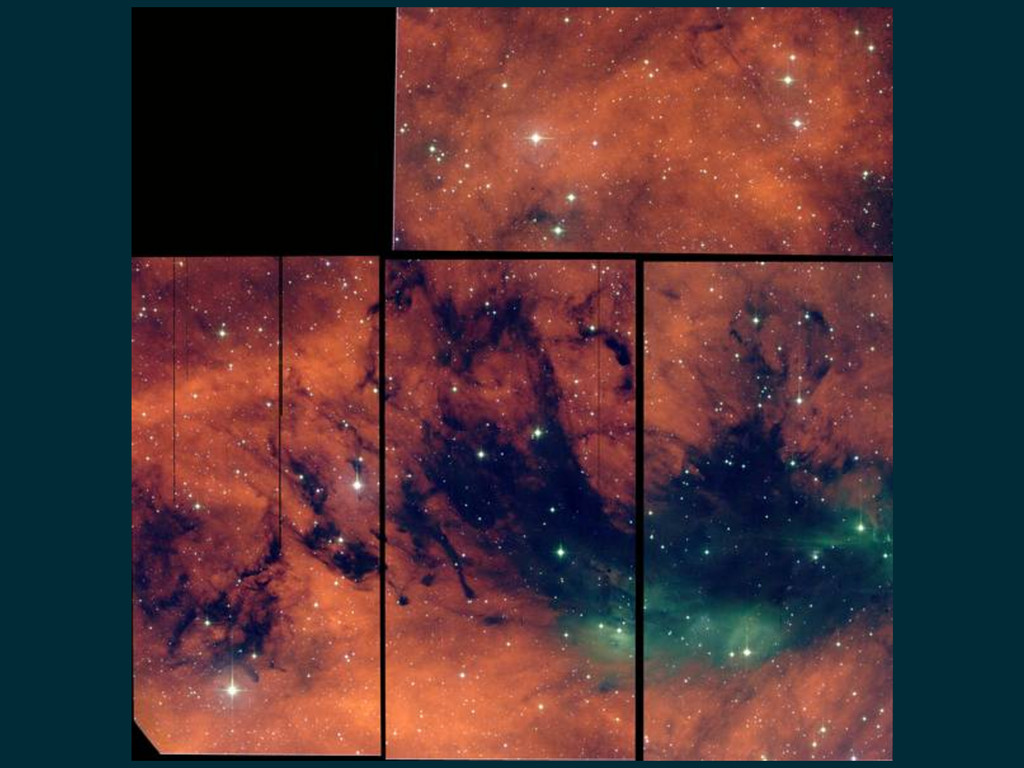
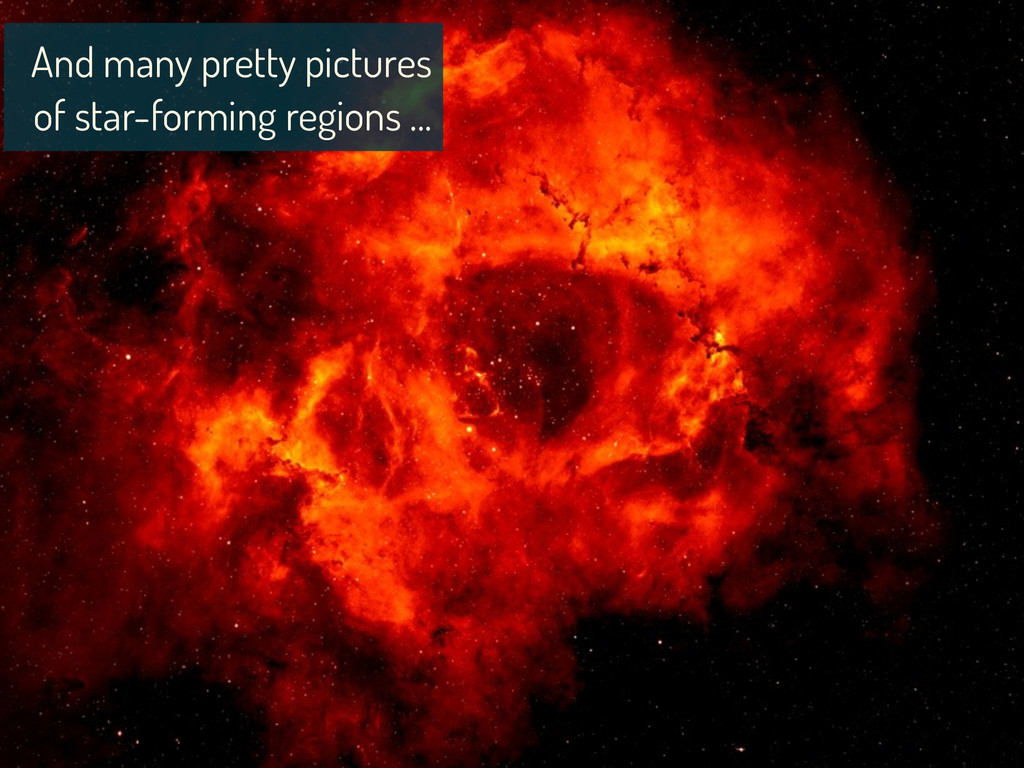
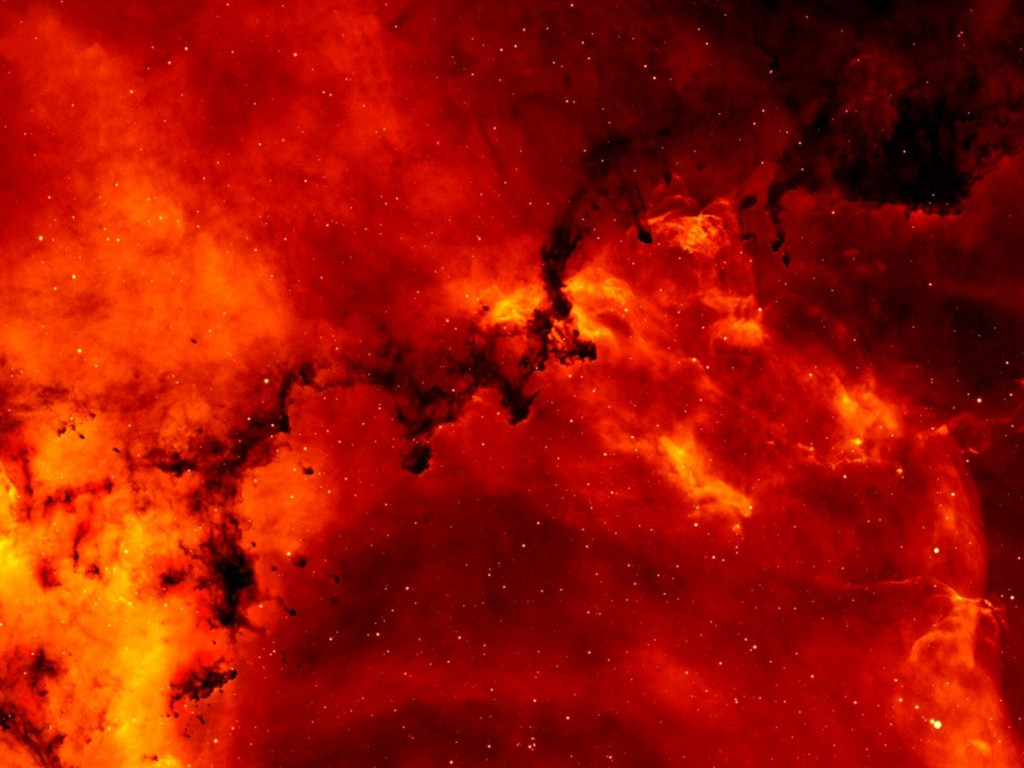
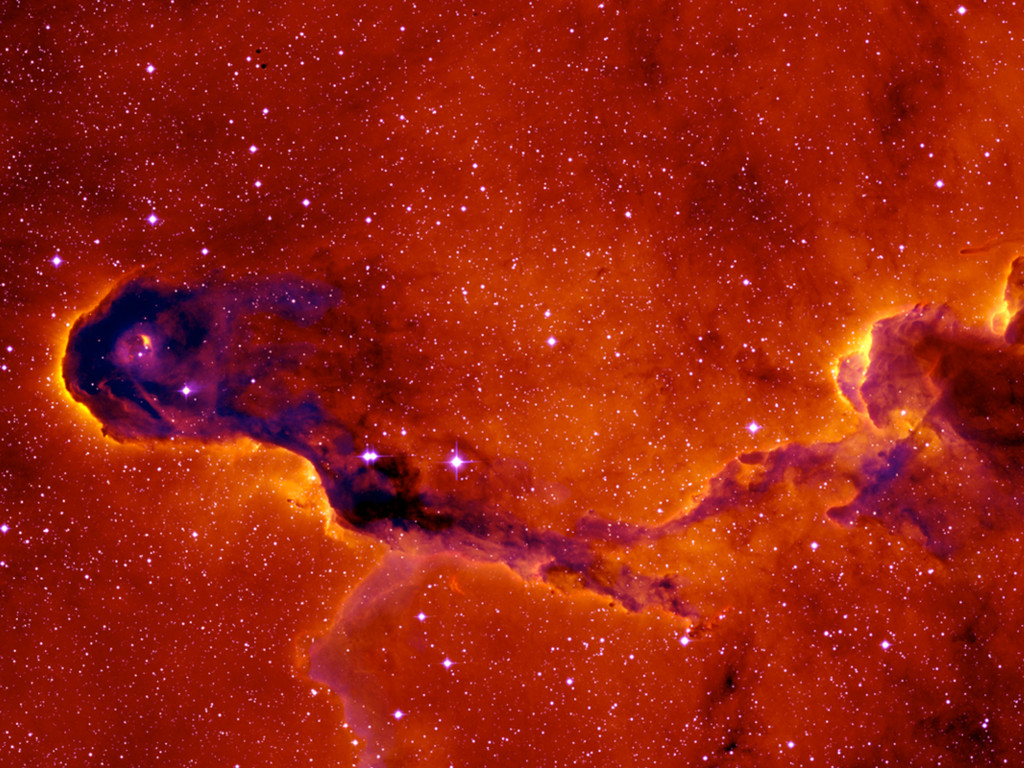
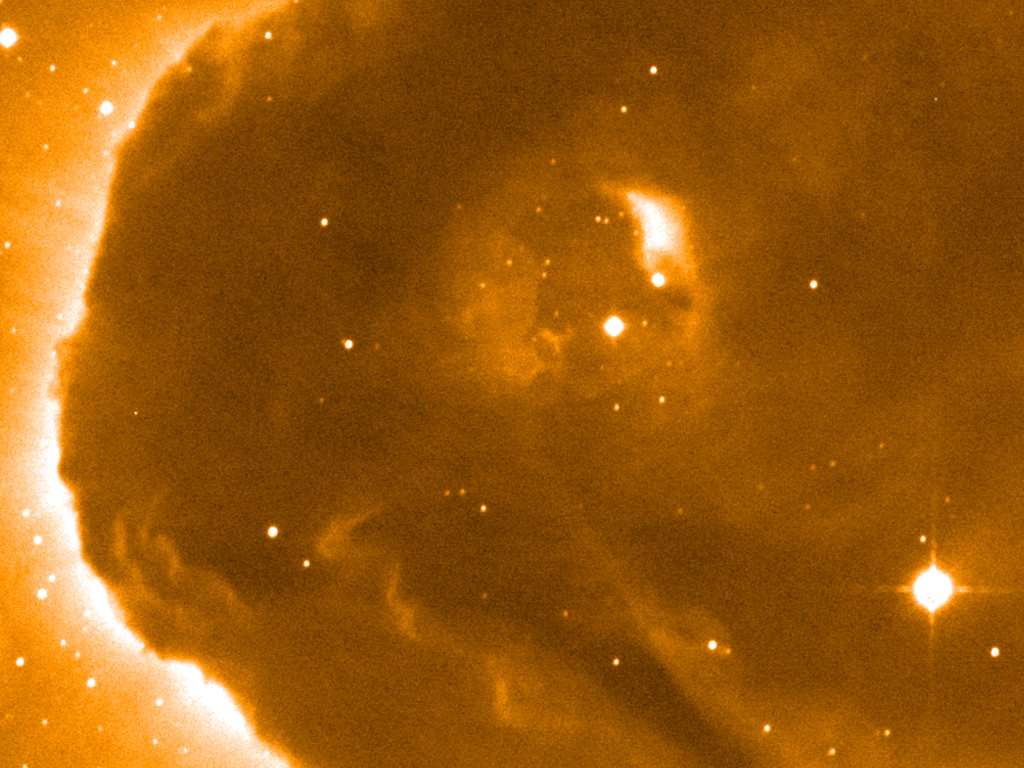
And many pretty pictures of star-forming regions …
None
None
None
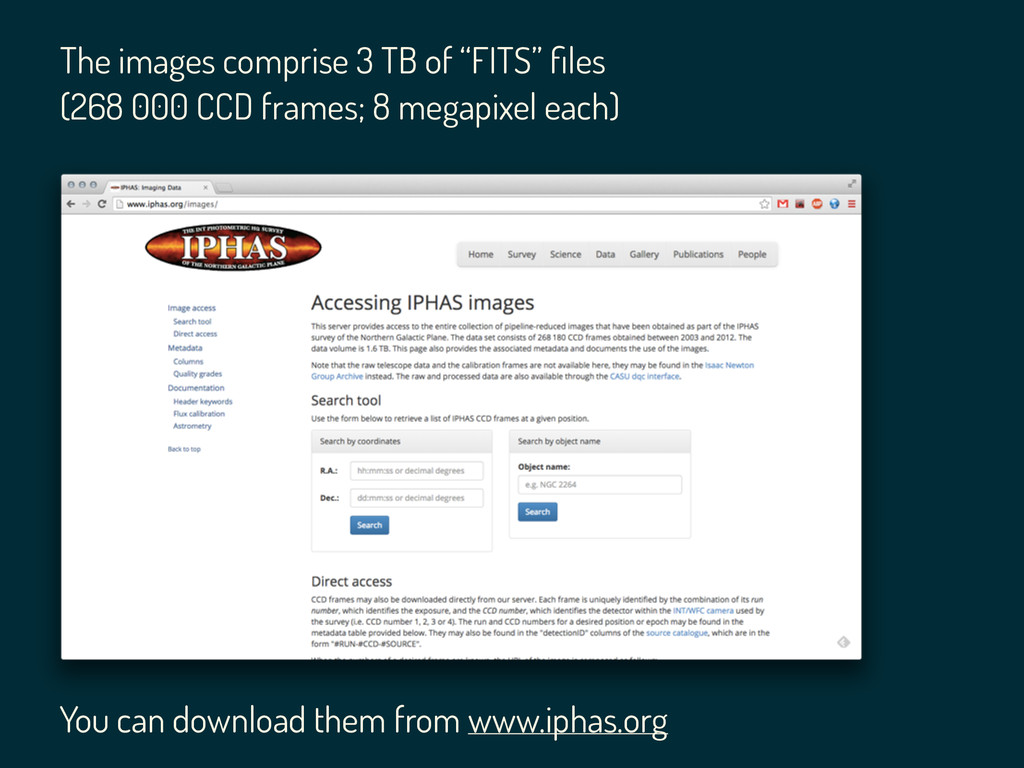
The images comprise 3 TB of “FITS” files (268 000
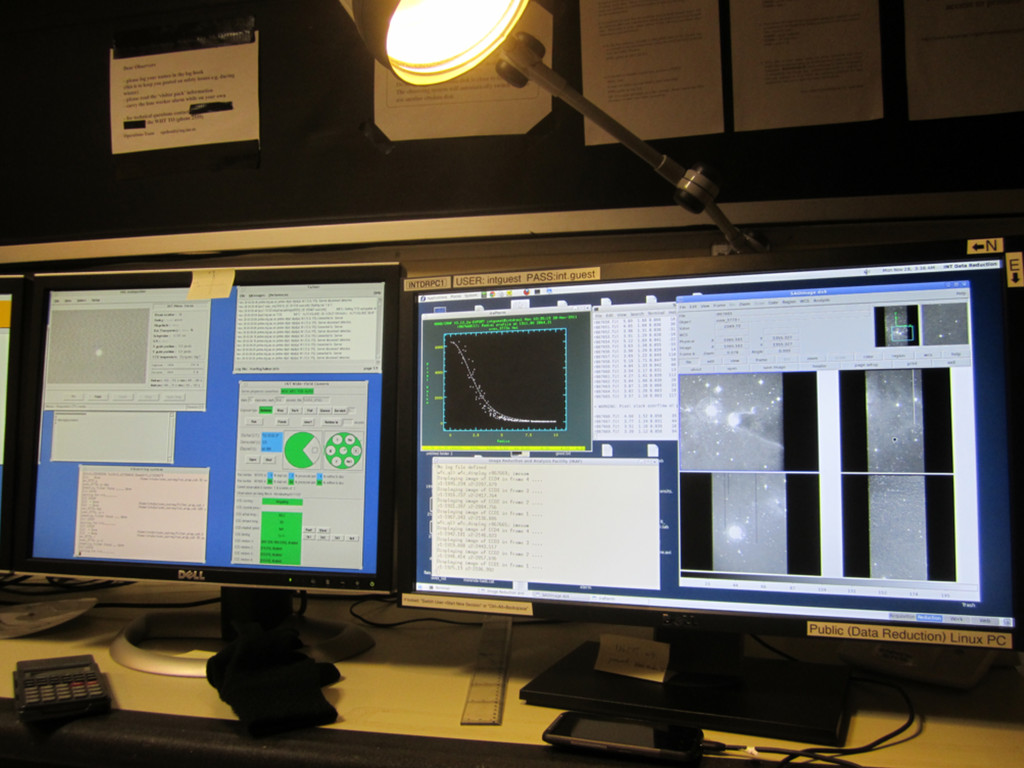
CCD frames; 8 megapixel each) You can download them from www.iphas.org
None
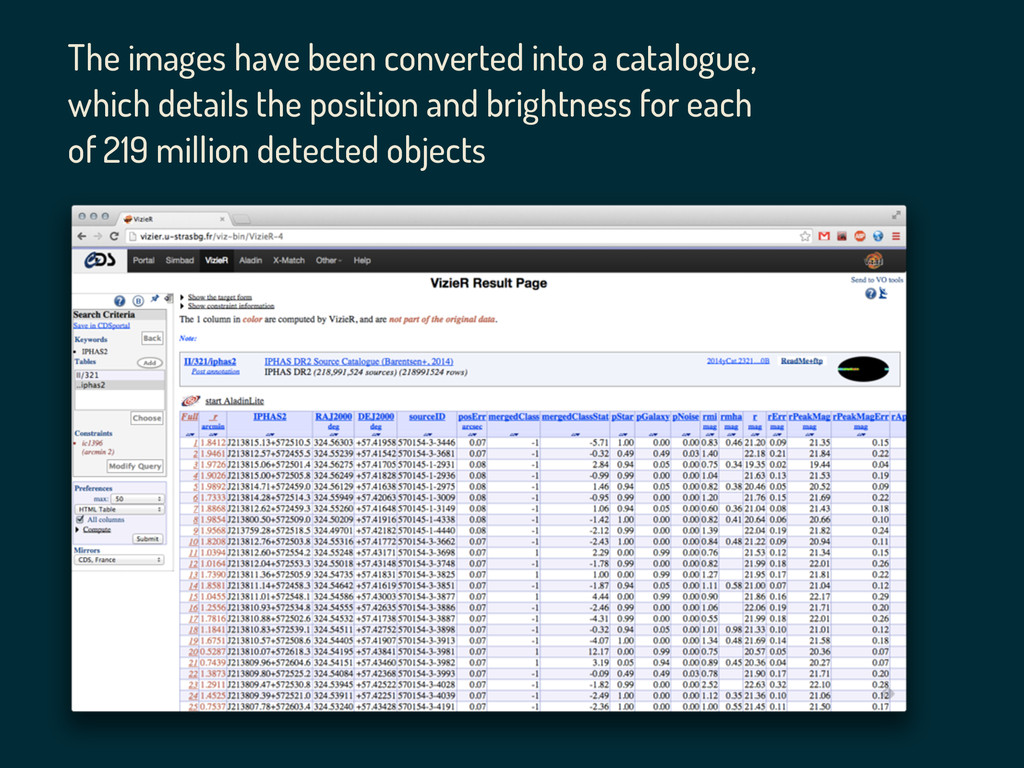
The images have been converted into a catalogue, which details
the position and brightness for each of 219 million detected objects
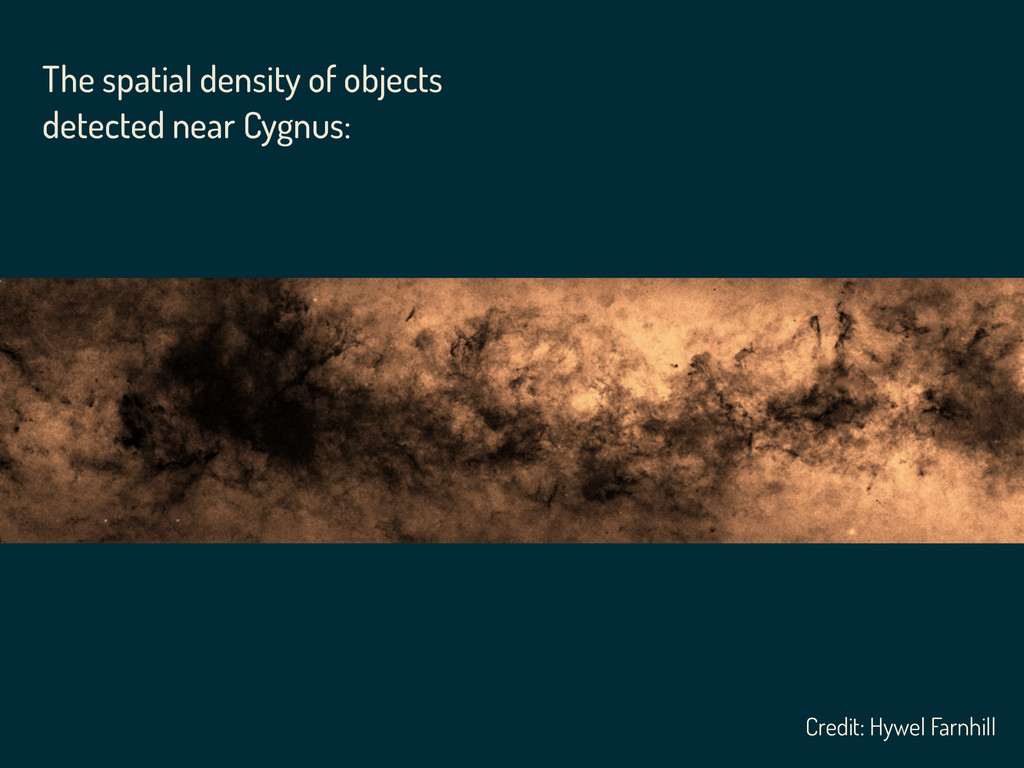
The spatial density of objects detected near Cygnus: Credit:
Hywel Farnhill
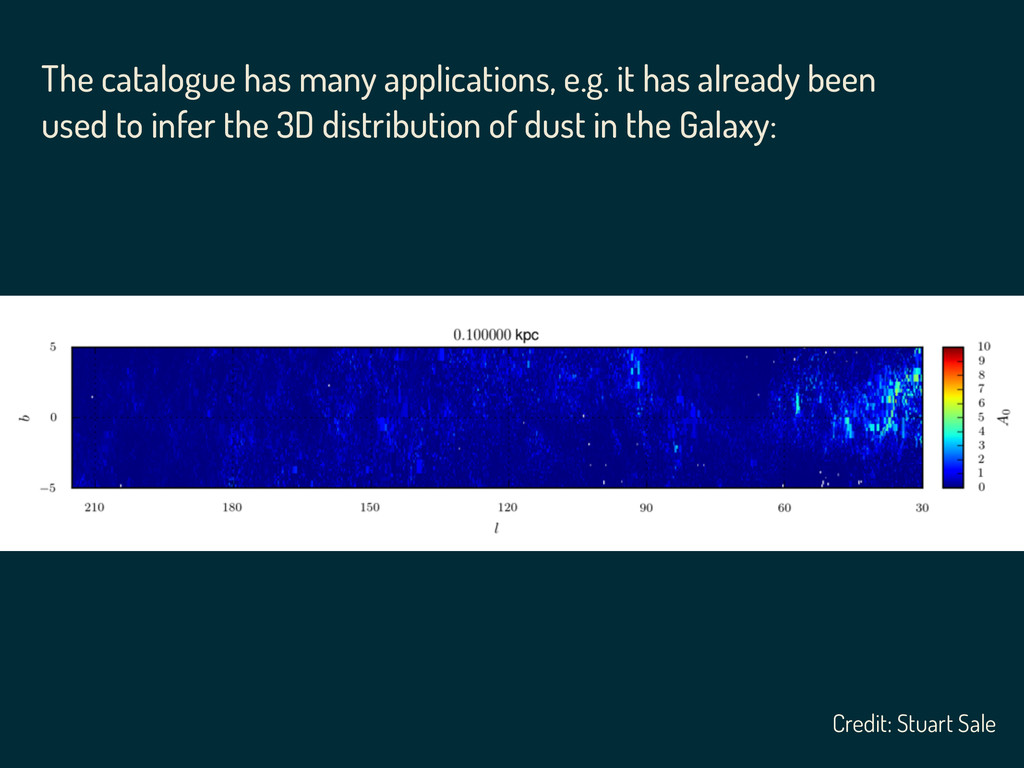
The catalogue has many applications, e.g. it has already been
used to infer the 3D distribution of dust in the Galaxy: Credit: Stuart Sale
Credit: Nick Risinger (www.skysurvey.org)
Credit: Nick Risinger (www.skysurvey.org)
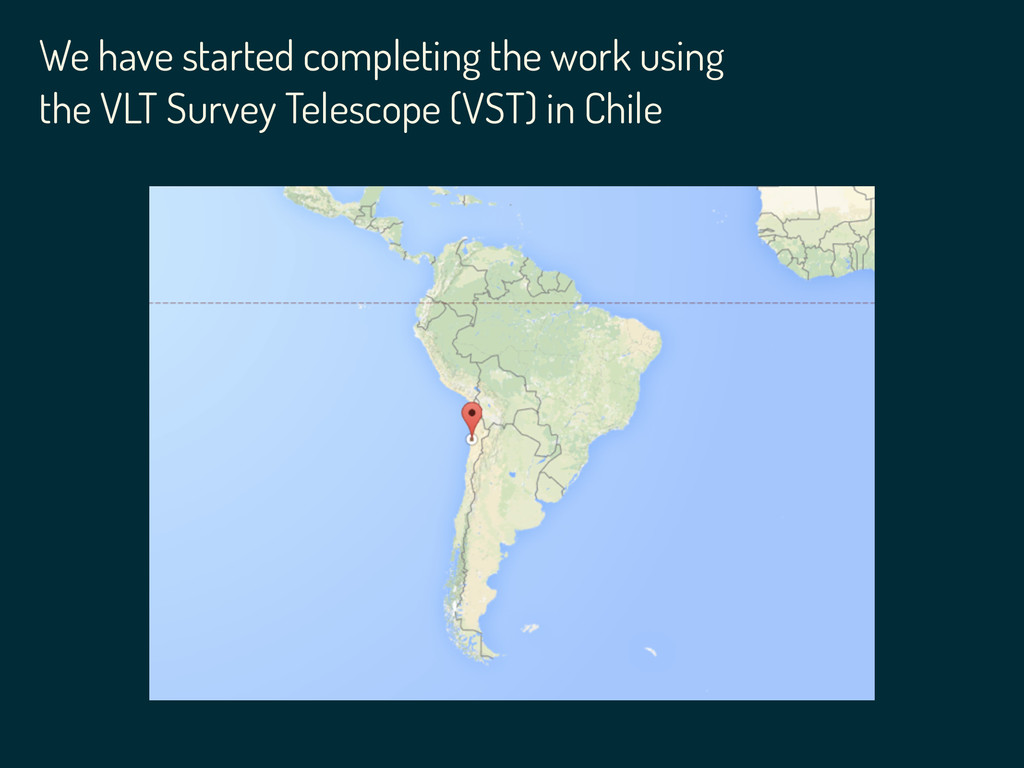
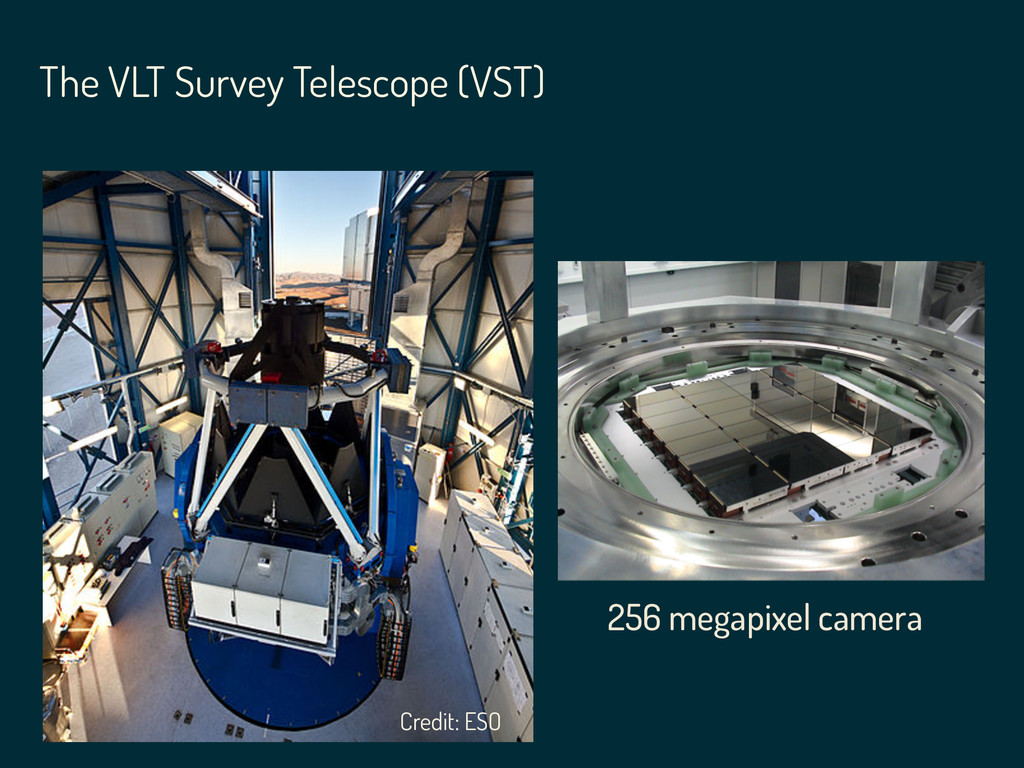
We have started completing the work using the VLT Survey
Telescope (VST) in Chile
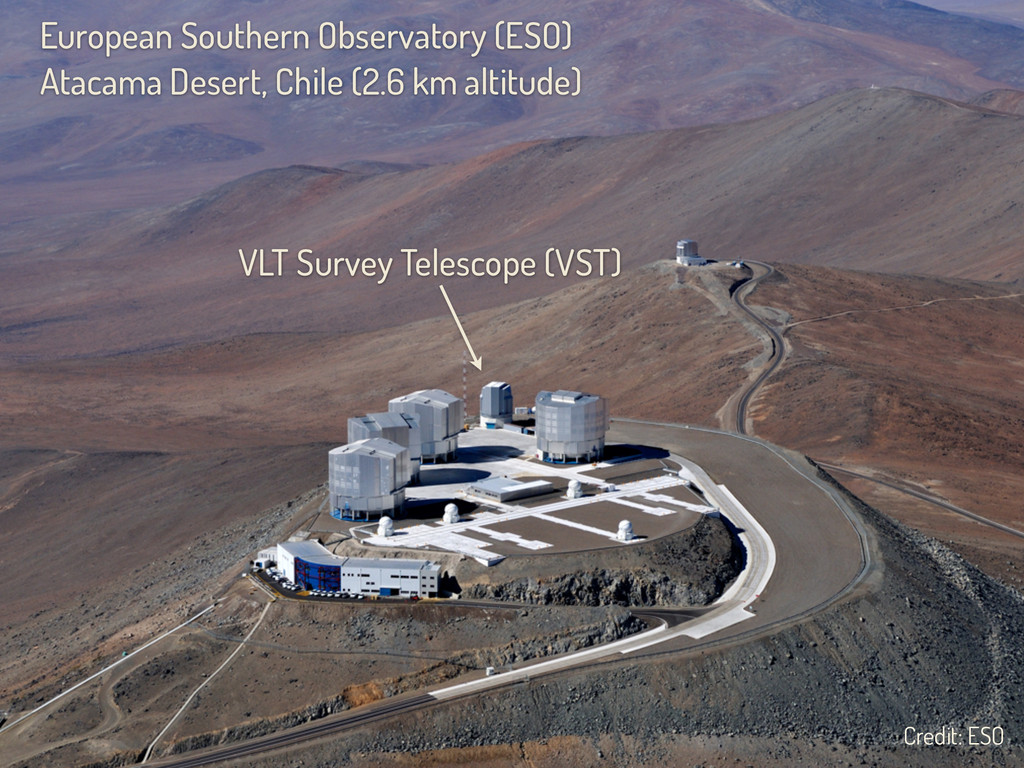
VLT Survey Telescope (VST) European Southern Observatory (ESO) Atacama Desert,
Chile (2.6 km altitude) Credit: ESO
256 megapixel camera The VLT Survey Telescope (VST) Credit: ESO
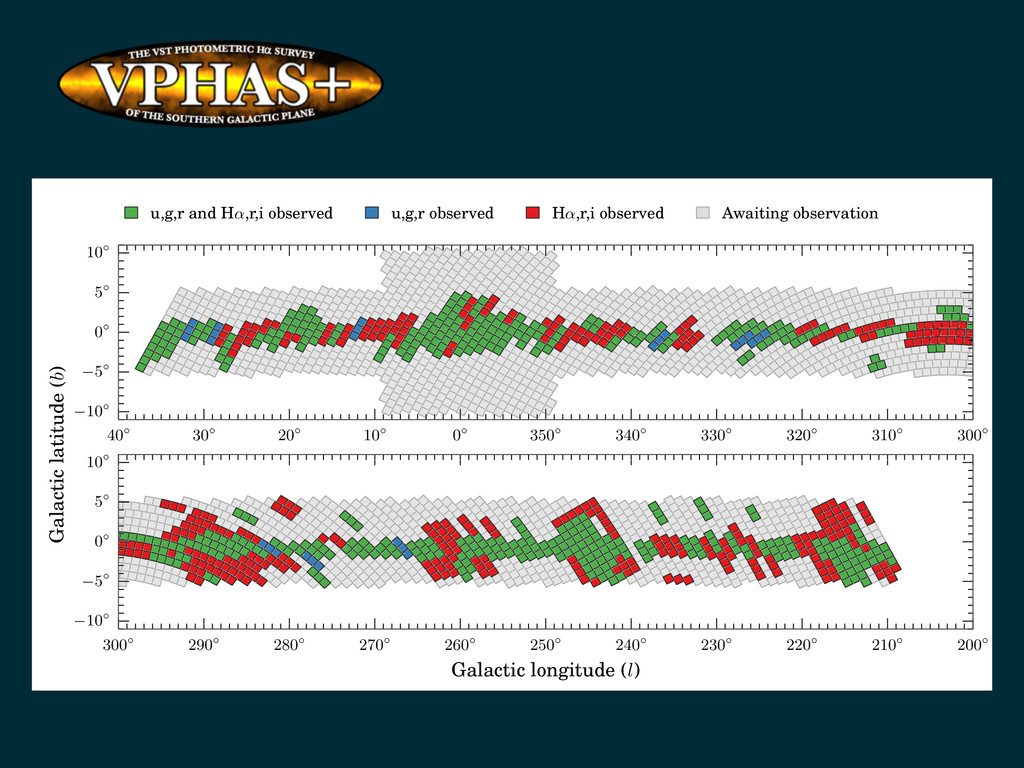
300 310 320 330 340 350 0 10 20 30
40 10 5 0 5 10 u,g,r and H↵,r,i observed u,g,r observed H↵,r,i observed Awaiting observation 200 210 220 230 240 250 260 270 280 290 300 Galactic longitude (l) 10 5 0 5 10 Galactic latitude (b)
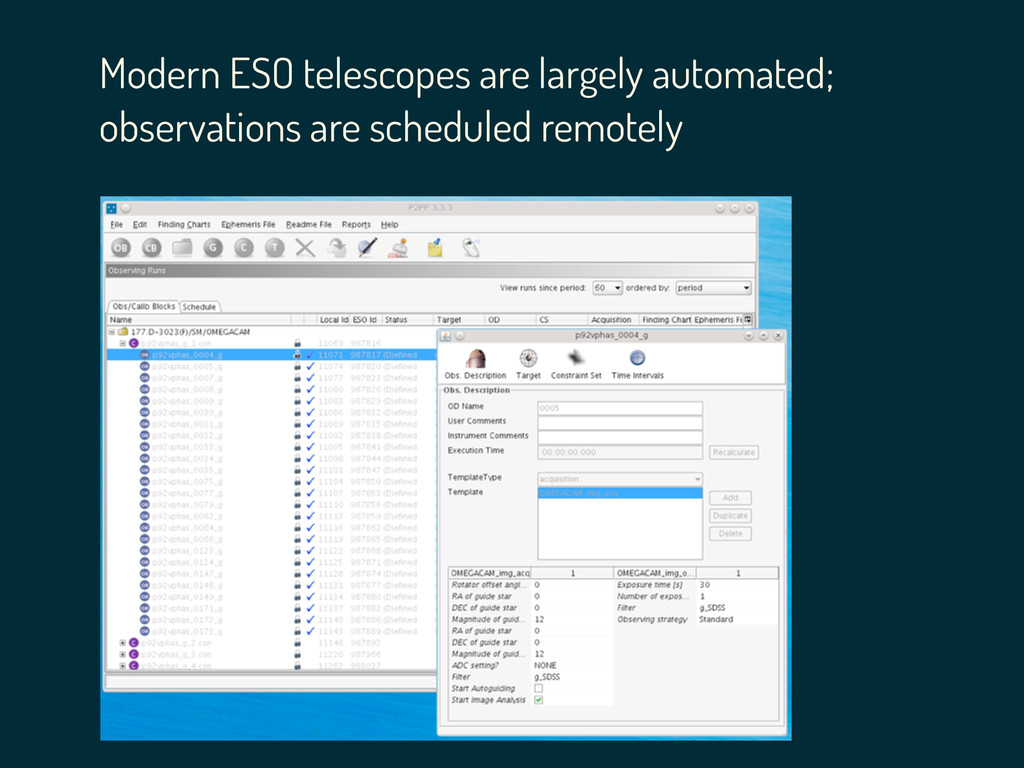
Modern ESO telescopes are largely automated; observations are scheduled remotely
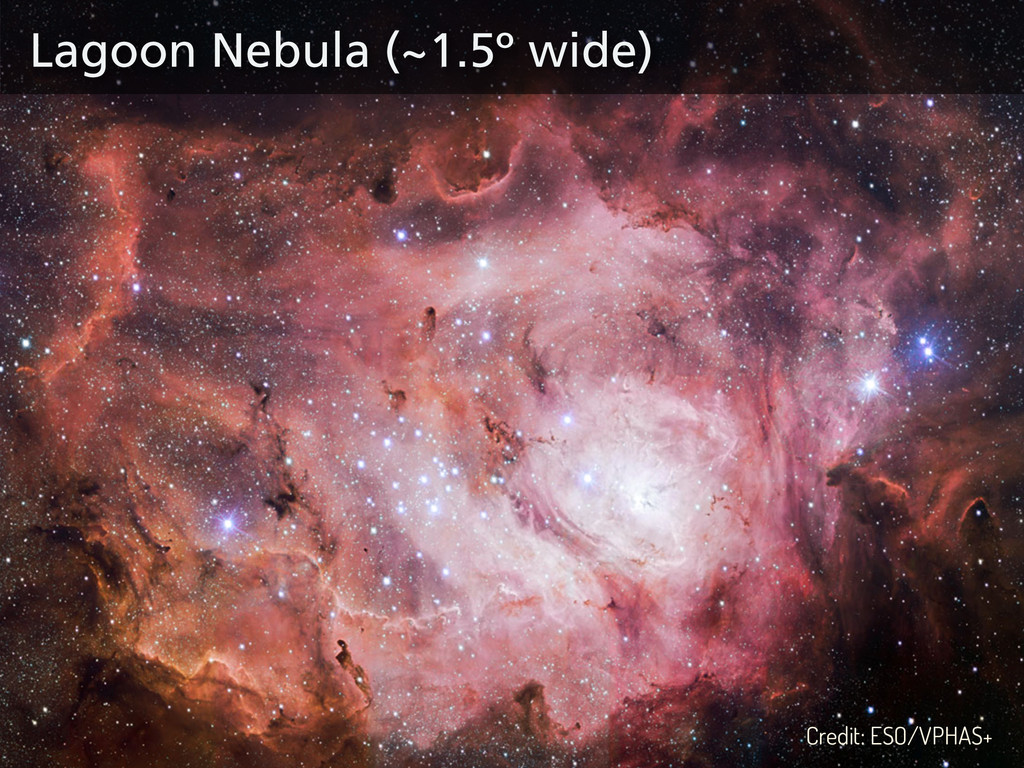
Lagoon Nebula (~1.5º wide) Credit: ESO/VPHAS+
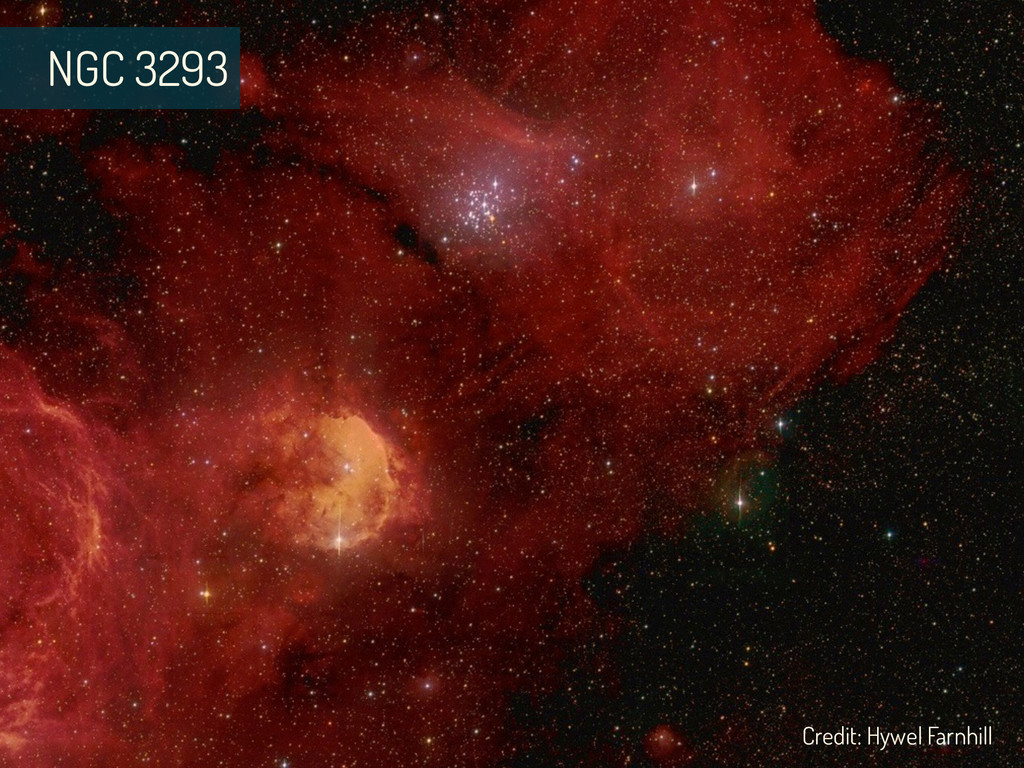
NGC 3293 Credit: Hywel Farnhill
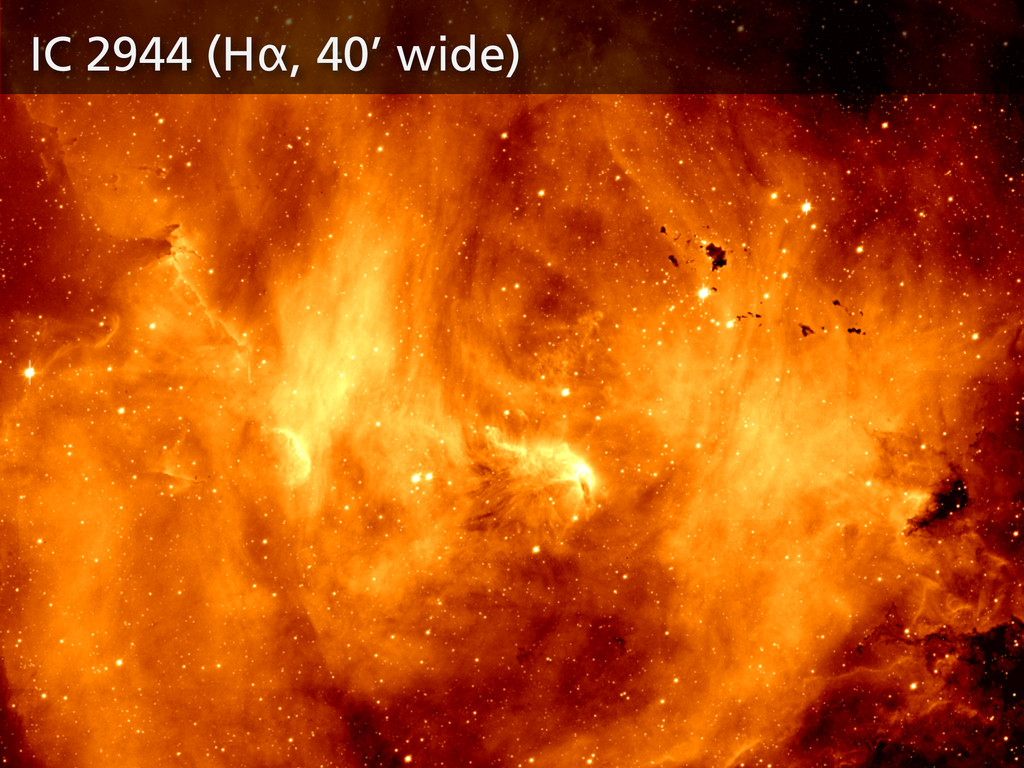
IC 2944 (Hα, 40’ wide)
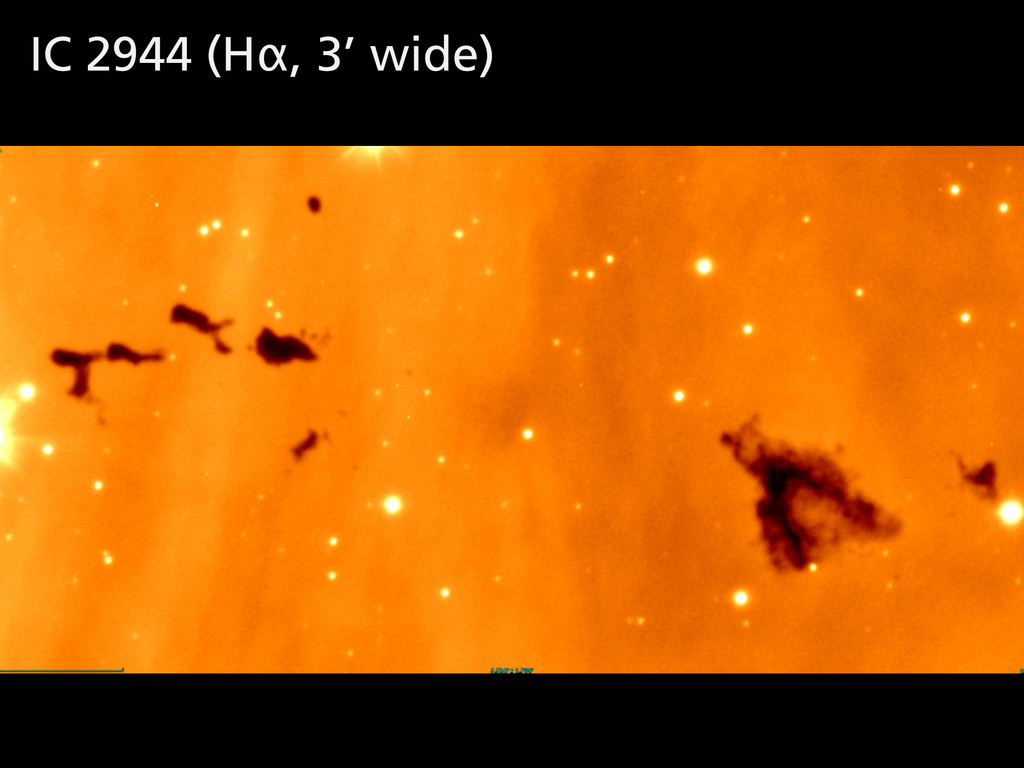
IC 2944 (Hα, 3’ wide)
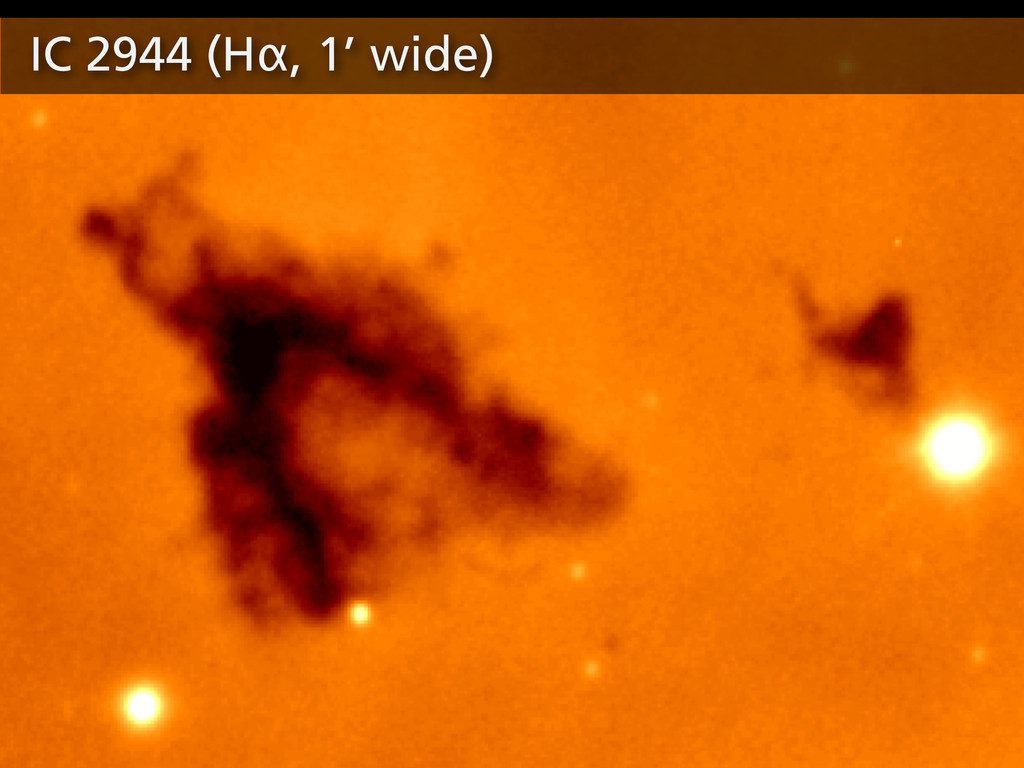
IC 2944 (Hα, 1’ wide)
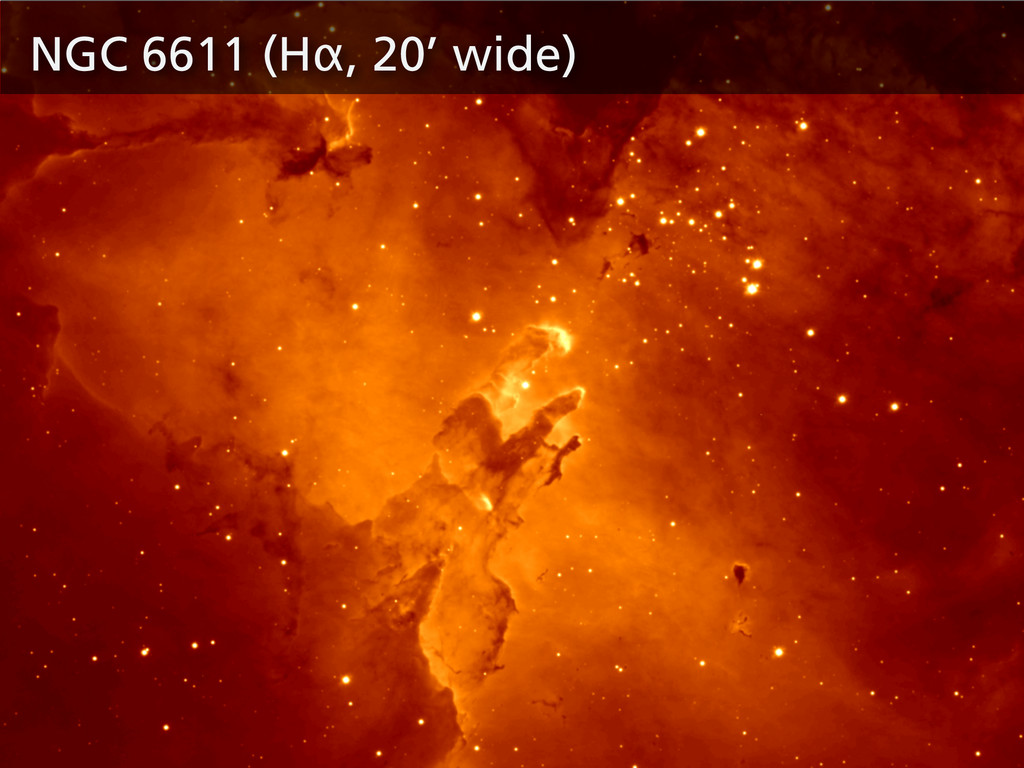
NGC 6611 (Hα, 20’ wide)
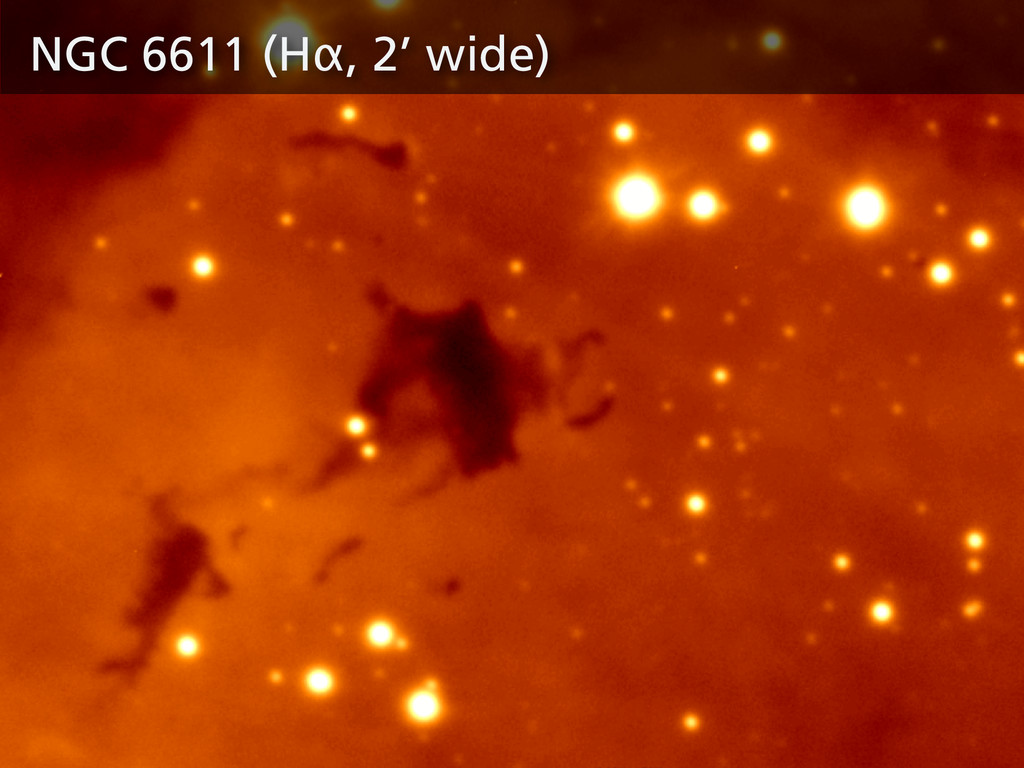
NGC 6611 (Hα, 2’ wide)
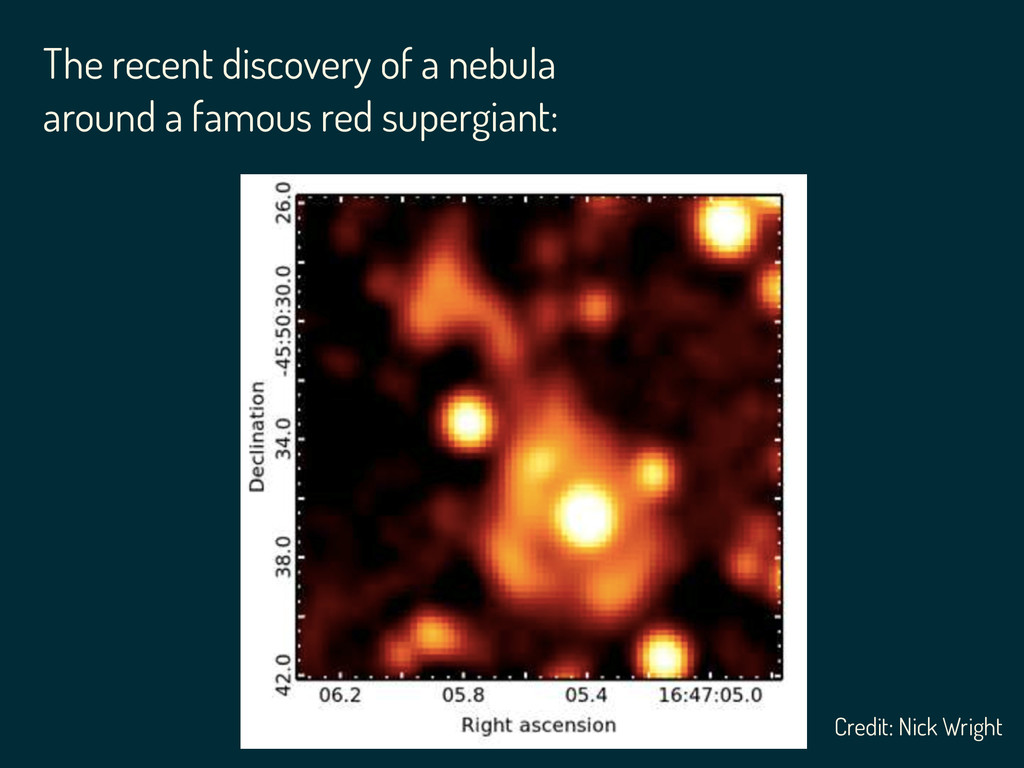
The recent discovery of a nebula around a famous red
supergiant: Credit: Nick Wright
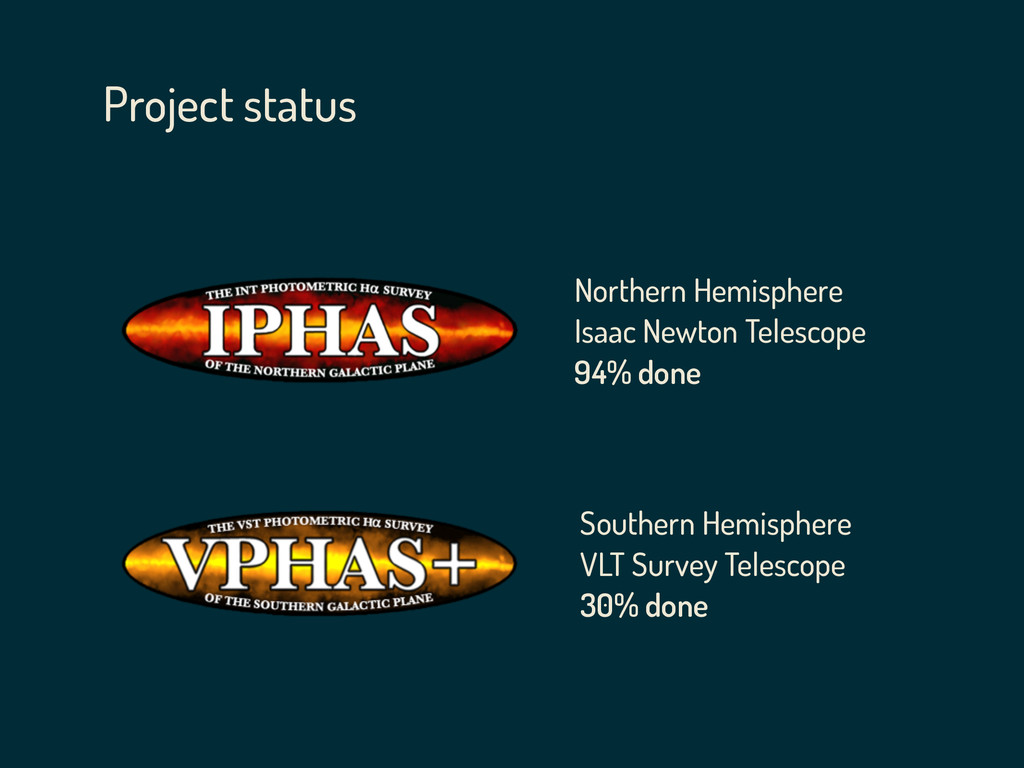
Project status Northern Hemisphere Isaac Newton Telescope 94% done Southern
Hemisphere VLT Survey Telescope 30% done
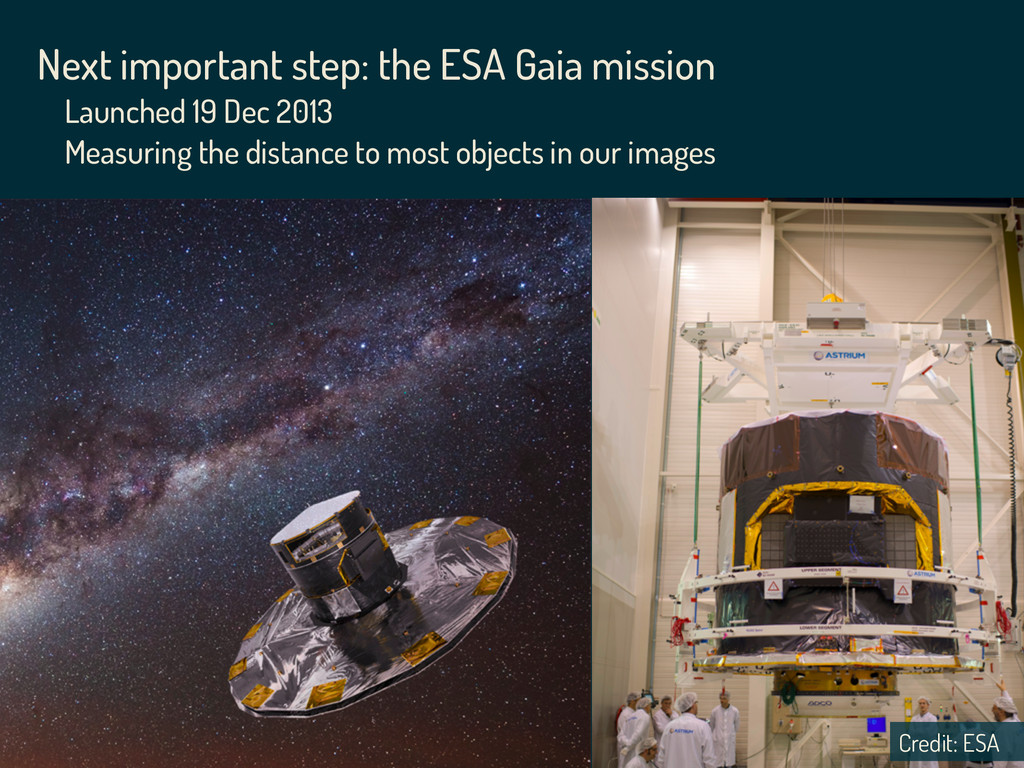
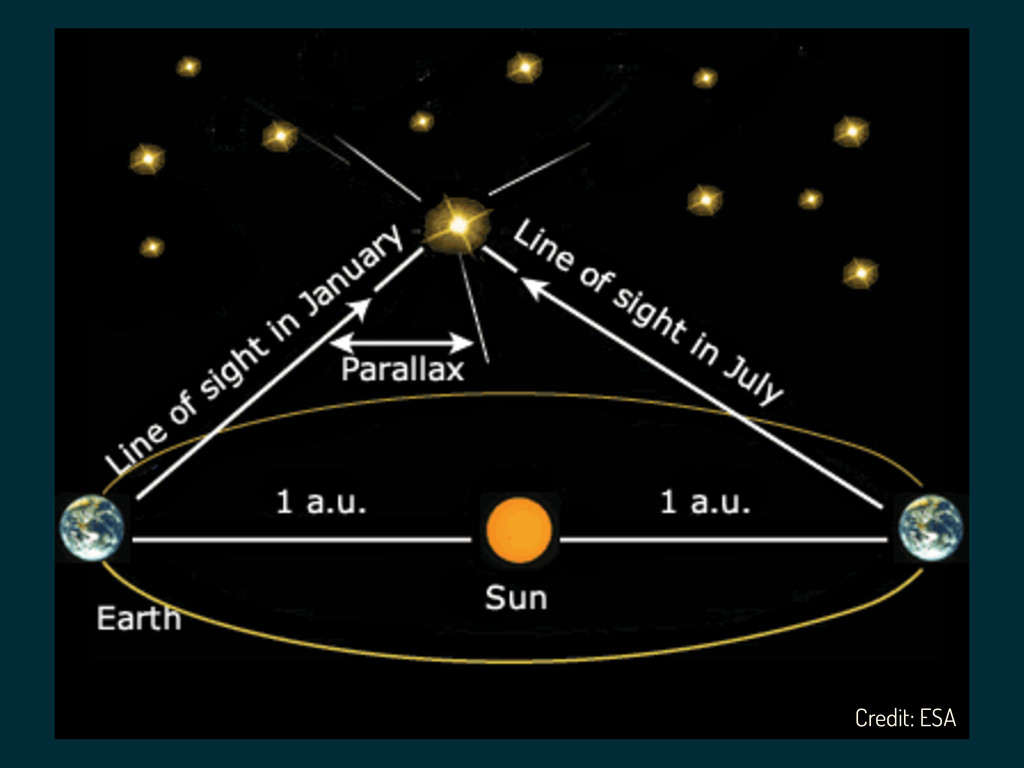
Next important step: the ESA Gaia mission Launched 19 Dec
2013 Measuring the distance to most objects in our images Credit: ESA
Credit: ESA
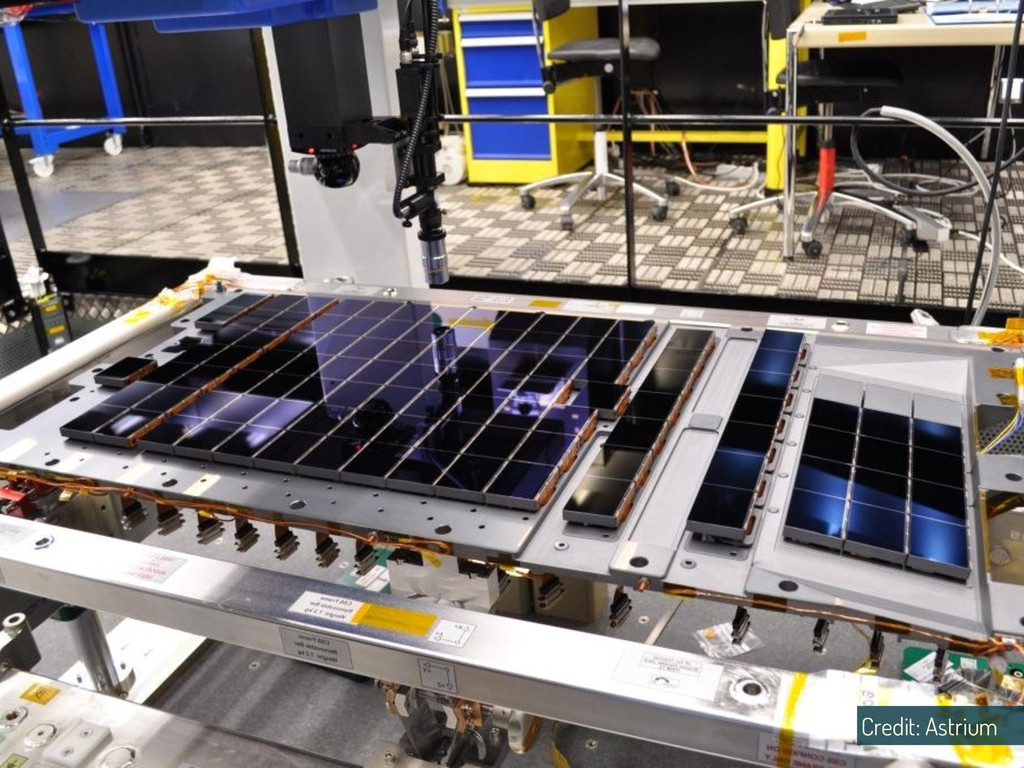
Credit: Astrium
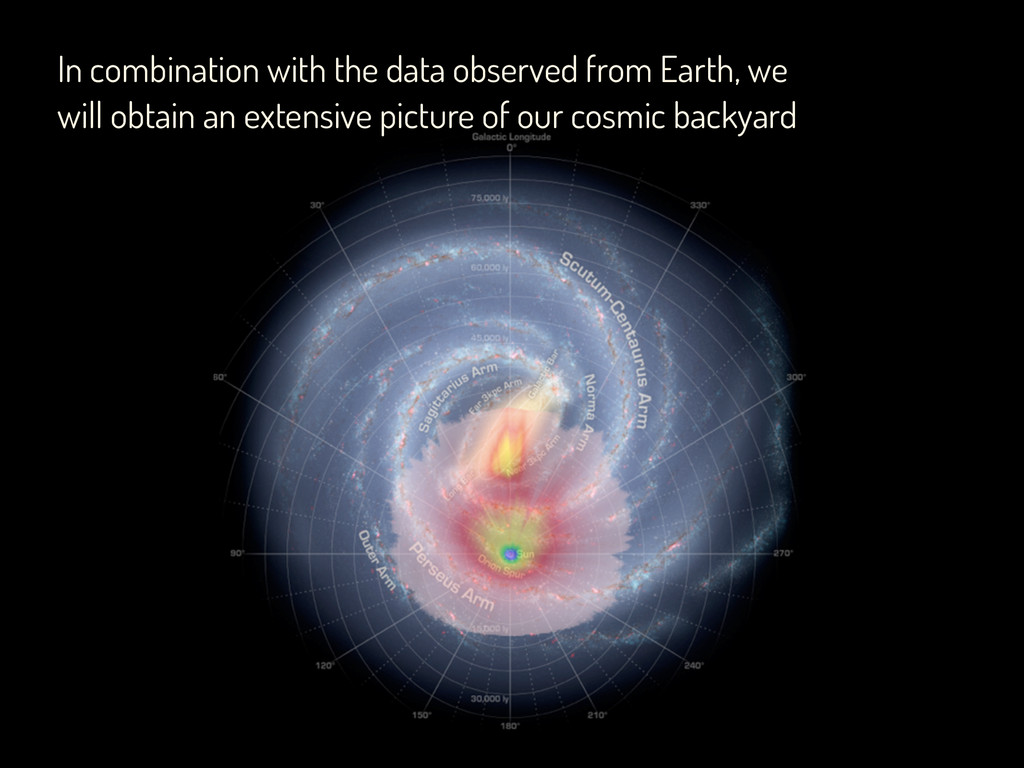
In combination with the data observed from Earth, we will
obtain an extensive picture of our cosmic backyard
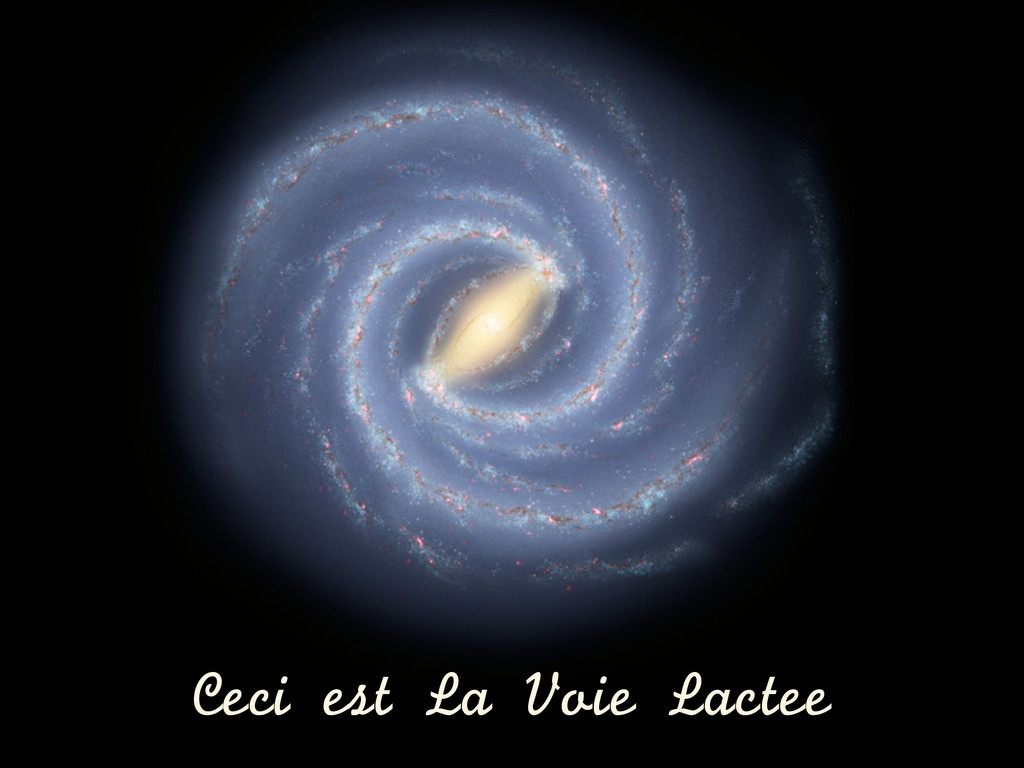
Ceci est La Voie Lactee
Thank you