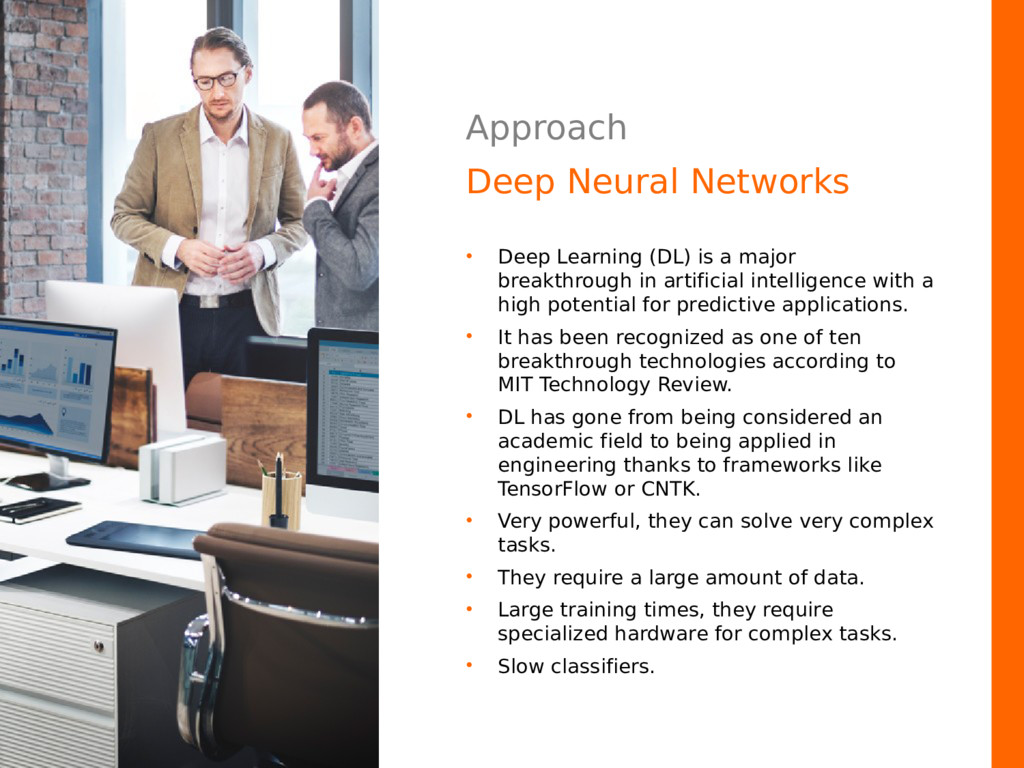
Deep Learning (DL) is a major breakthrough in artificial intelligence with a high potential for predictive applications.
https://www.bigdataspain.org/2017/talk/a-deep-learning-use-case-for-water-end-use-detection
Big Data Spain 2017
November 16th - 17th Kinépolis Madrid
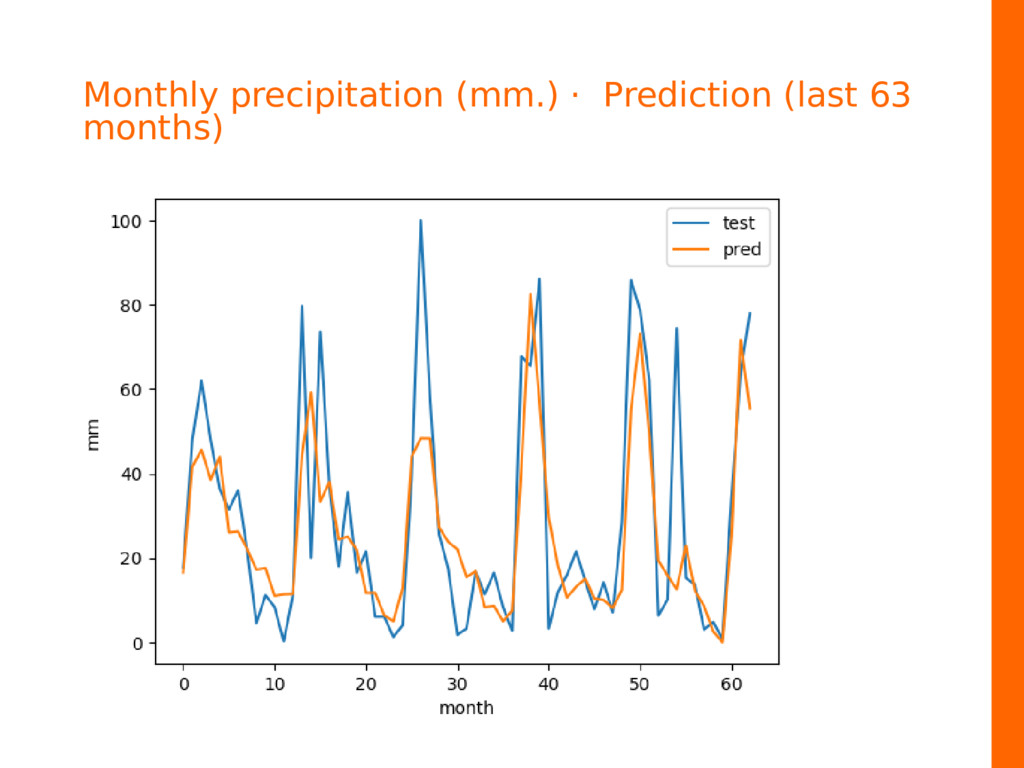
![[**] https://datamarket.com/data/set/22ls/monthly-precipitation-mm-southwestern-mountain-region-1932-1966 Southwestern precipitation forecast Monthly precipitation (mm.) Southwester mountain](https://files.speakerdeck.com/presentations/7f27664f17794f448dbde7760961bae7/slide_39.jpg)