Upgrade to Pro — share decks privately, control downloads, hide ads and more …

Data Science for Growth

Data Science for Growth

Because of all this potential people have been really eager to invest in data science.
It’s easy to think about it as magic. Perform a bit of analysis and derive novel insights.
Sprinkle some deep learning and make your product more engaging.
But this is not necessarily helpful, to startups or to the field.
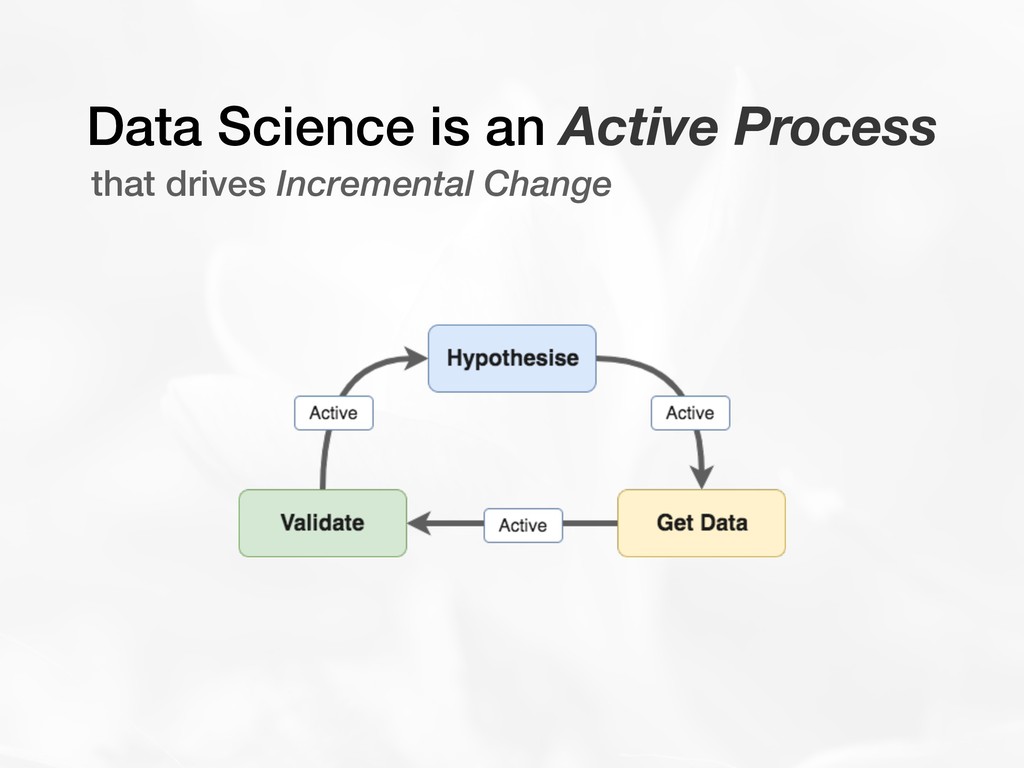
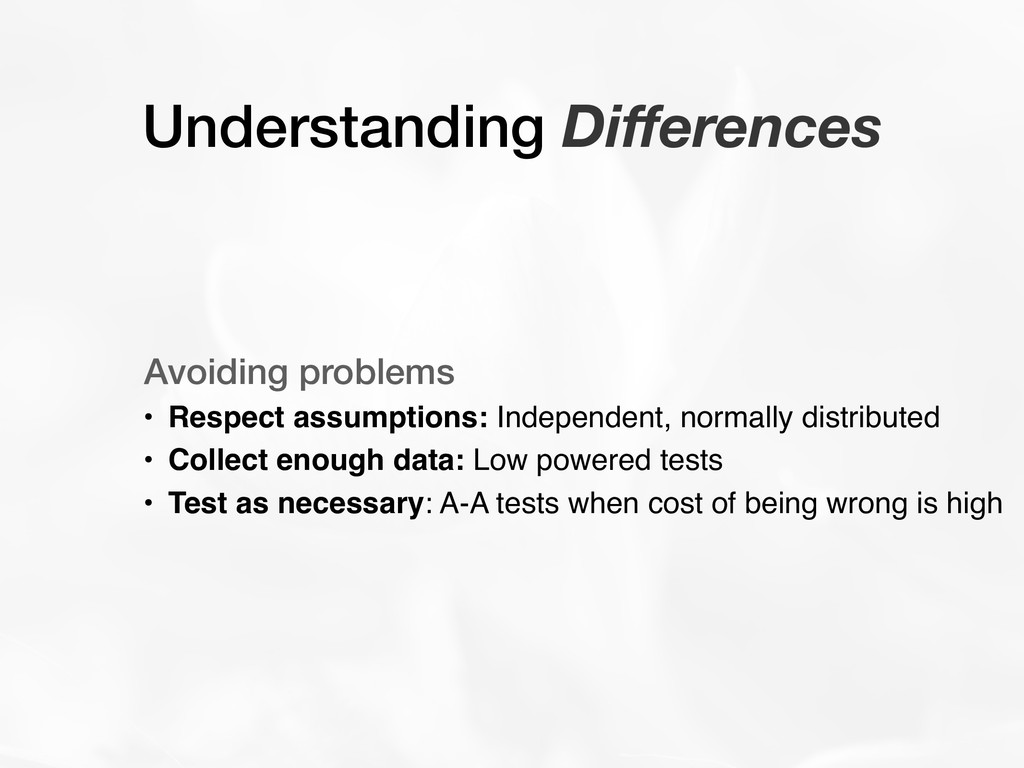
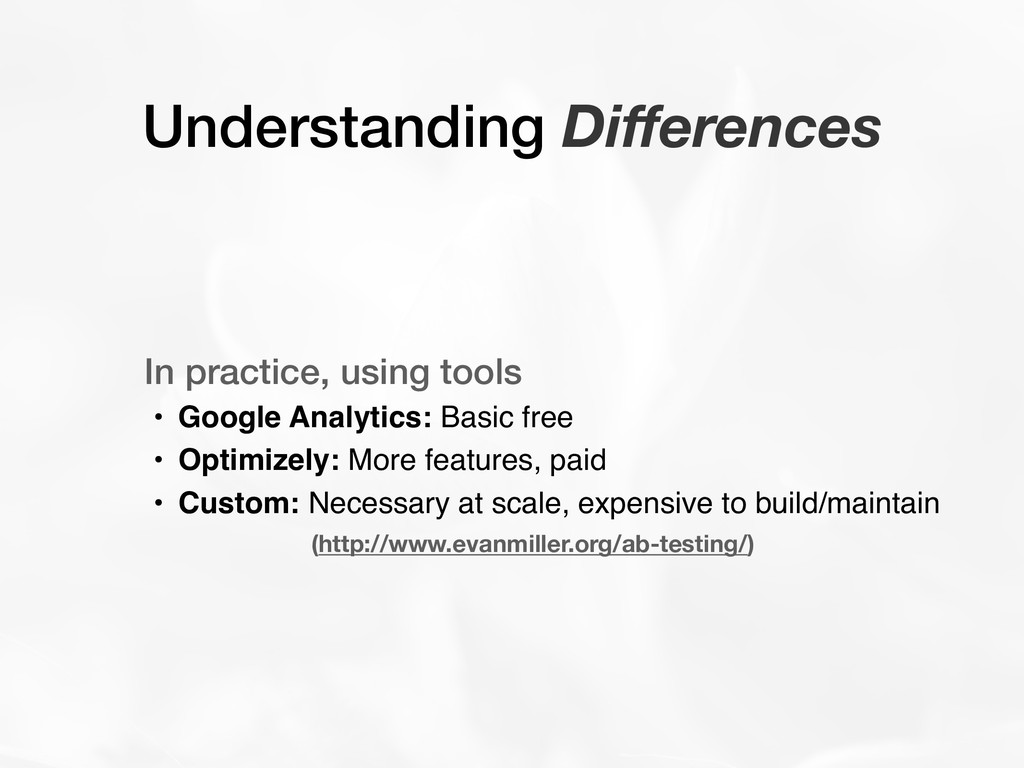
Instead we need to understand what tools and techniques data science can provide and the circumstances in which they are appropriate.

Sean Braithwaite

August 23, 2017
Tweet

More Decks by Sean Braithwaite

Other Decks in Technology

Transcript

  1. • Data Science as a Discipline • Data Science as

    a Process • Techniques for Growth • Understanding Users • Understanding Groups • Understanding Change Agenda
  2. Understanding your Users Username Age Channel $ Spent Active Omar

    21 Twitter 2 Yes Nour 45 Facebook 4 No Fatima 30 Organic 7 Yes … … … … …
  3. Understanding your Users Username Age Channel $ Spent Active Omar

    21 Twitter 2 Yes Nour 45 Facebook 4 No Fatima 30 Organic 7 Yes … … … … … as mixes of Numeric and Categorical fields Numeric Categorical
  4. Understanding your Users Username Age Channel $ Spent Active Omar

    21 Twitter 2.4 Yes Nour 45 Facebook 4.2 No Fatima 30 Organic 2.7 Yes … … … … … as mixes of Observed and Derived fields Derived Observed
  5. Understanding your Users Through Exploring Correlations $ Spent orders Cost

    Impressions Clicks $ Spent orders Cost Clicks Impressions
  6. Understanding your Users as Groups of Users Campaign $ Spent

    1 2 3 4 1 2 3 4 5 6 Acquisition Cost $
  7. Understanding your Users In practice, using tools • Excel: Surprisingly

    powerful! Works at small scale • Mixpanel: Cheap to get started, straight forward integration • IPython: Learning curve, works well at small scale (http://python-for-multivariate-analysis.readthedocs.io/)
  8. Understanding Differences in the outcomes of experiments Null: Option A

    and option B are equally good Alternative: Option B is significantly better than option A
  9. Understanding Differences that are Significant Conversion Rate Probability density 0.15

    0.225 0.1 Probability > 0.19 0.19 Most likely conversion rate 5%
  10. Understanding Differences Avoiding problems • Respect assumptions: Independent, normally distributed

    • Collect enough data: Low powered tests • Test as necessary: A-A tests when cost of being wrong is high
  11. Understanding Differences In practice, using tools • Google Analytics: Basic

    free • Optimizely: More features, paid • Custom: Necessary at scale, expensive to build/maintain (http://www.evanmiller.org/ab-testing/)