central to the success of the ICT industry through proactive interventions in equipment and services, rollout eg the National Optic Fibre Backbone Infrastructure, TEAMS and SEACOM • Kenya has successfully delivered efficient and well-regulated communication infrastructure • The lowering of communication costs – means easier and cheaper access to communication networks by the majority of citizens • The Kenyan government has been central to the success of the ICT industry through proactive interventions in equipment and services, rollout eg the National Optic Fibre Backbone Infrastructure, TEAMS and SEACOM • Kenya has successfully delivered efficient and well-regulated communication infrastructure • The lowering of communication costs – means easier and cheaper access to communication networks by the majority of citizens
users •818, 119 Mbps •Mobile Money Transfer Subscription 24.8 million •The mobile data/Internet subscriptions on GPRS/EDGE and 3G continued to dominate the internet market, representing a ratio of 98.8 per cent of the total Internet subscriptions. •30 % Internet Penetration- 12.4 Million users •818, 119 Mbps •Mobile Money Transfer Subscription 24.8 million •The mobile data/Internet subscriptions on GPRS/EDGE and 3G continued to dominate the internet market, representing a ratio of 98.8 per cent of the total Internet subscriptions.
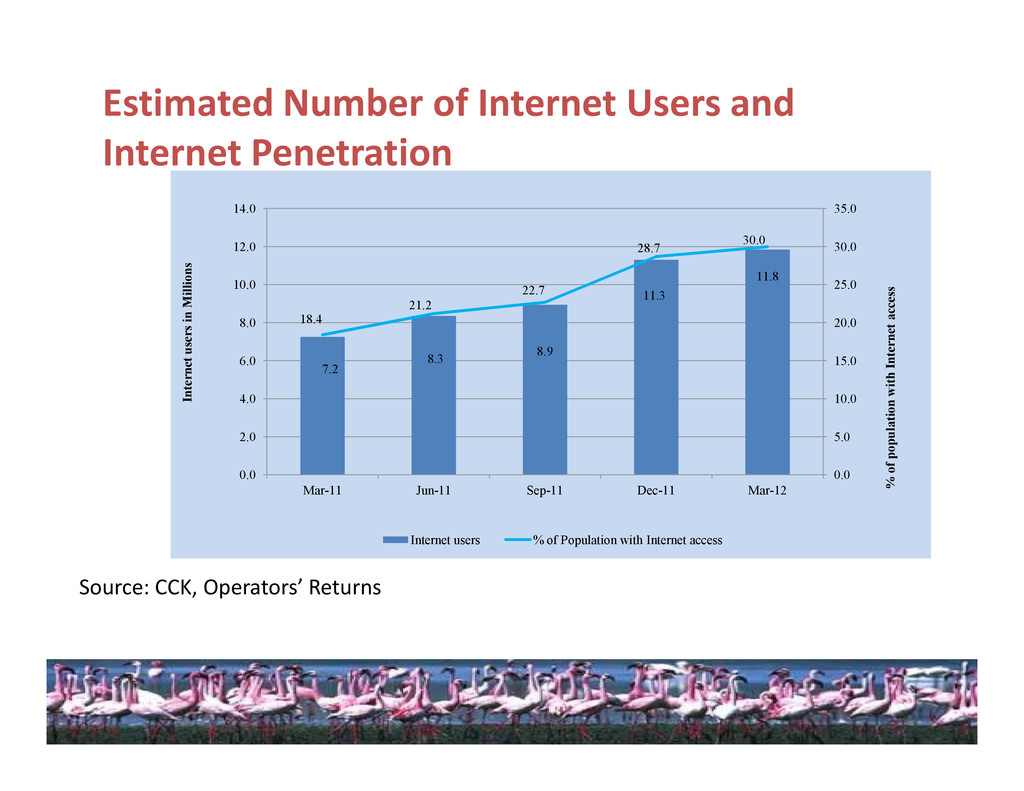
8.9 11.3 11.8 18.4 21.2 22.7 28.7 30.0 10.0 15.0 20.0 25.0 30.0 35.0 4.0 6.0 8.0 10.0 12.0 14.0 Internet users in Millions % of population with Internet access Source: CCK, Operators’ Returns 0.0 5.0 10.0 0.0 2.0 4.0 Mar-11 Jun-11 Sep-11 Dec-11 Mar-12 Internet users in Millions Internet users % of Population with Internet access % of population with Internet access