Upgrade to Pro — share decks privately, control downloads, hide ads and more …

Estimating and forecasting rice yields

CGIAR-CSI
September 23, 2014
38

Estimating and forecasting rice yields

CGIAR-CSI

September 23, 2014
Tweet

Transcript

  1. Estimating and forecasting rice yields! Remote sensing, crop models, field

    data and the future! ! Andy Nelson ! Monday 22nd September 2014
  2. ! It is a public-private partnership – PPP - project

    to implement national scale crop monitoring systems for food security and crop insurance applications, initially focusing on rice in Asia. ! ! Funded by the Swiss Agency for Development and Cooperation (SDC) in Phase I (2011-2014), and by SDC, GIZ and national governments in Phase II (2015-2018). Remote sensing based information and insurance for crops in emerging economies - RIICE
  3. 1. Governments and other stakeholders use the crop / yield

    information system in agricultural and disaster risk management policies, strategies, and action plans to strengthen food security and to transfer risks to the insurance sector.! ! 2. Governments have integrated / accepted RIICE-supported insurance solutions in the respective agricultural insurance schemes or guidelines. ! ! ! 3. Institutions in the target area offer needs-based, efficient, accessible and qualitative RIICE insurance solutions to target client segments. !! ! RIICE anticipated outcomes by 2018 1. Governments and other stakeholders use the crop / yield information system in agricultural and disaster risk management policies, strategies, and action plans to strengthen food security and to transfer risks to the insurance sector.! ! 2. Governments have integrated / accepted RIICE-supported insurance solutions in the respective agricultural insurance schemes or guidelines. ! ! ! 3. Institutions in the target area offer needs-based, efficient, accessible and qualitative RIICE insurance solutions to target client segments. !! !
  4. In Phase I RIICE demonstrates that remote sensing and other

    technologies can provide accurate and timely information on rice and builds capacity in-country to sustain the technology. Remote sensing Weather, soil, etc. Field measurements Image processing! Crop modeling! GIS & WebGIS! Databases! Expert knowledge! Training Rice area! Planting dates! Yield & production! Yield forecasts! Flood & drought! Yield gaps Data Technolo gy Informat ion Users Statistical Bureaus! Policy makers! Government! Researchers! Disaster response! NGOs Remote sensing based information and insurance for crops in emerging economies - RIICE
  5. Rice has distinctive temporal features Backscatter or σ0 is a

    measure of the intensity of the signal, in dB, reflected back to the sensor. Here we observe temporal changes in σ0 No other crop has such a large dynamic range over such short time. No other crop has such low dB values at start of the season.
  6. It is distinct from other land cover σ0 values from

    CosmoSkyMed X-band SAR, HH polarisation, 45° We can exploit these agronomically relevant temporal features to distinguish rice crops from other land cover, providing information on both the where and the when.
  7. Settlements, built up areas Canals/Rivers Ponds, aquaculture Rice area, colours

    indicate different planting dates Rice paddies and bunds Example in Nam Dinh with images on 26th May, 13th July and 29th One hectare and one square km SAR data in RIICE are provided by ASI/e-GEOS and GISTDA from COSMO-SkyMed and by InfoTerra GmbH from TerraSAR-X. What do we see in the σ0 time series?
  8. RIICE demonstration sites in Asia 13 sites across six countries

    – India, Thailand, Cambodia, Vietnam, Indonesia, Philippines! ! 127 SAR images in the 2013 monitoring season, almost 10 per footprint per season! ! 4.78 million hectares covered by these images! ! 1,339 rice map validation points collected, over 100 per footprint! ! 228 monitoring sites within those footprints, an average of 17 per footprint! ! 1,922 visits to those monitoring sites, an average of eight visits to each site per season! ! 1.65 million hectares of rice mapped and monitored! !
  9. Nam Dinh in the Red River Delta ! ! Soc

    Trang in the Mekong River Delta Where? Rice area estimates Rice map classification accuracy (%) is based on a standard confusion matrix from around 100 ground truth points per footprint.
  10. Site Season Period Fields & visits Establishment Maturity (days) Water

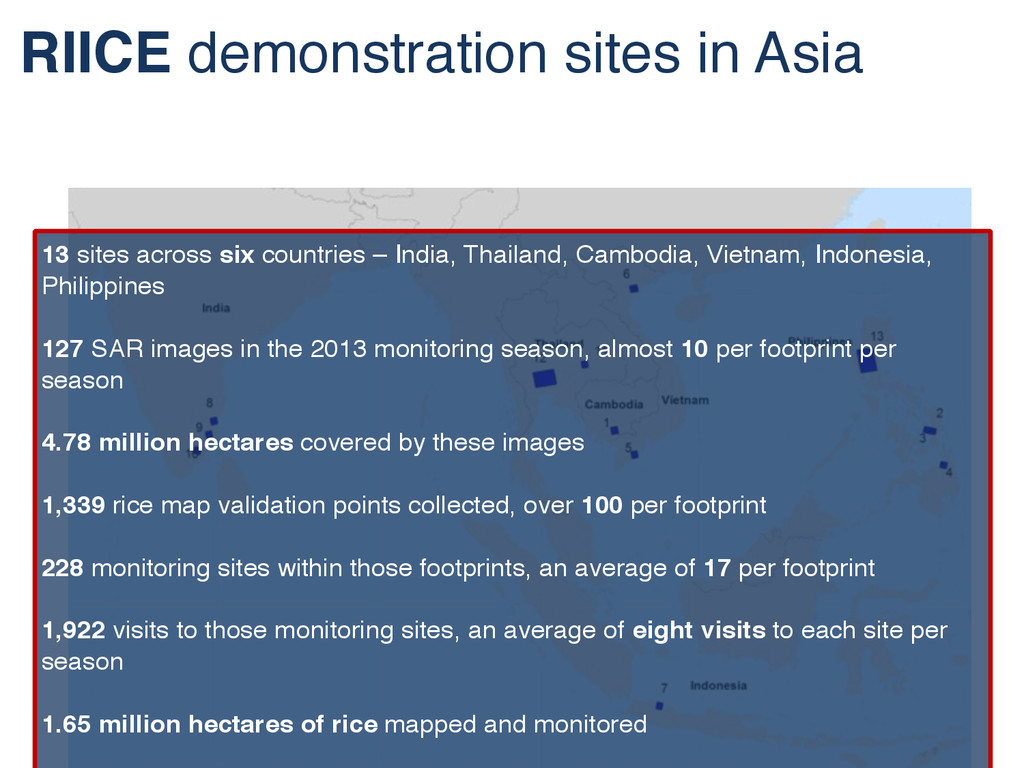
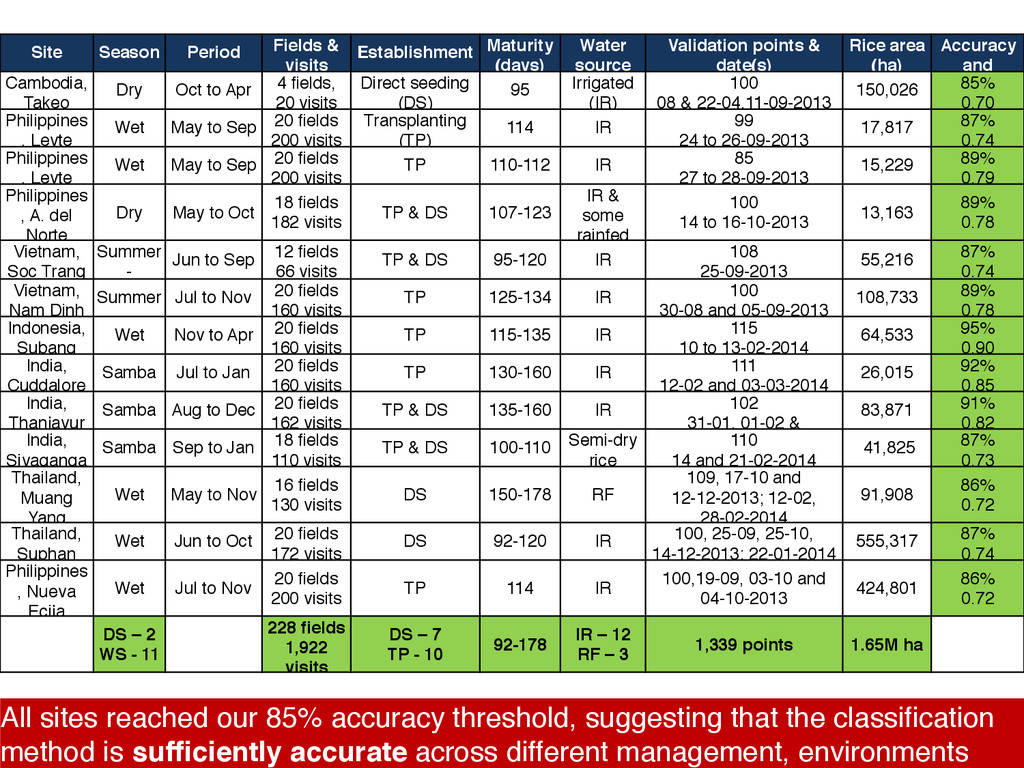
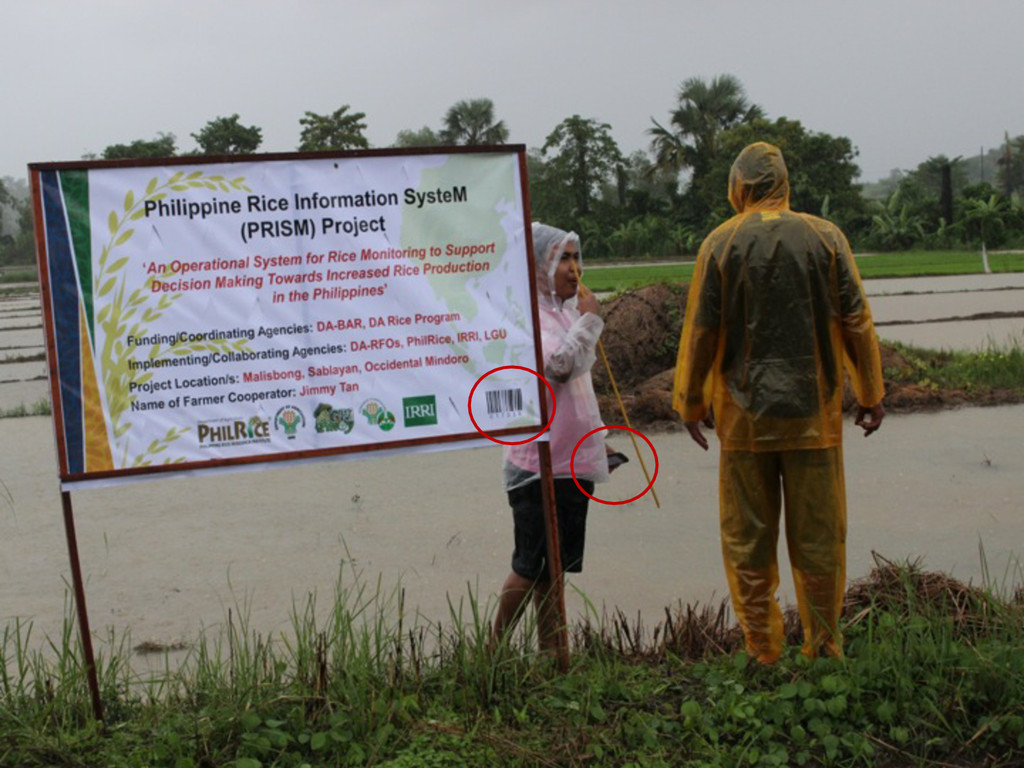
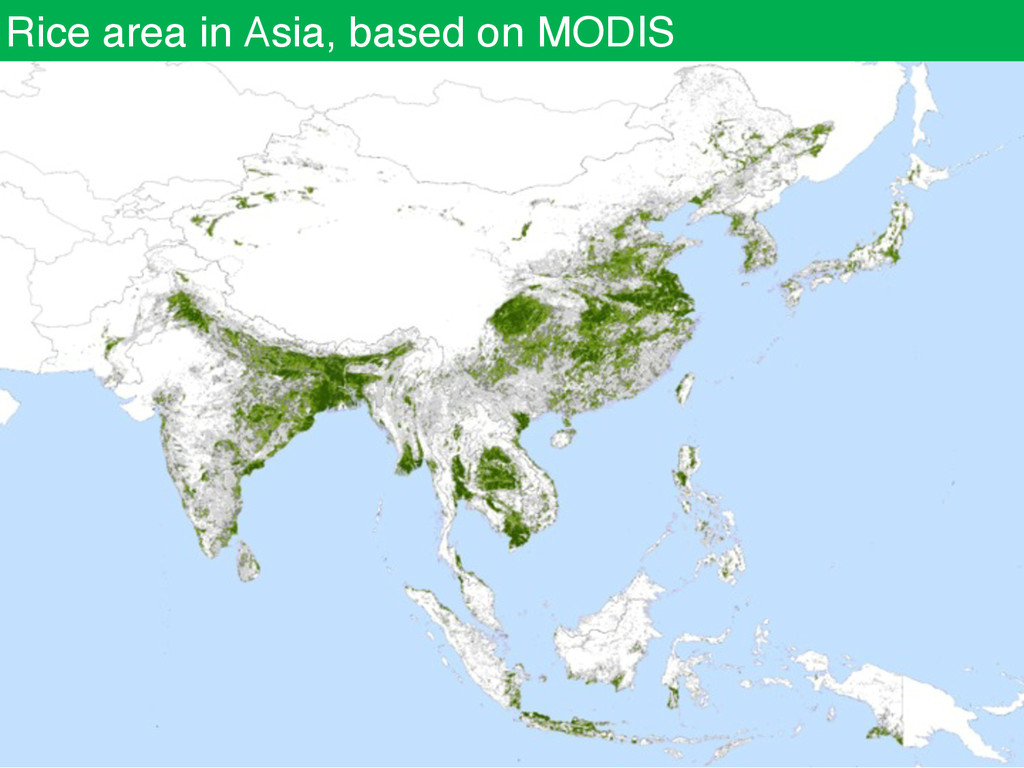
    source Validation points & date(s) Rice area (ha) Accuracy and Cambodia, Takeo Dry Oct to Apr 4 fields,! 20 visits Direct seeding (DS) 95 Irrigated (IR) 100 ! 08 & 22-04,11-09-2013 150,026 85%! 0.70 Philippines , Leyte Wet May to Sep 20 fields! 200 visits Transplanting (TP) 114 IR 99! 24 to 26-09-2013 17,817 87%! 0.74 Philippines , Leyte Wet May to Sep 20 fields! 200 visits TP 110-112 IR 85! 27 to 28-09-2013 15,229 89%! 0.79 Philippines , A. del Norte Dry May to Oct 18 fields! 182 visits TP & DS 107-123 IR & some rainfed 100! 14 to 16-10-2013 13,163 89%! 0.78 Vietnam, Soc Trang Summer - Jun to Sep 12 fields! 66 visits TP & DS 95-120 IR 108! 25-09-2013 55,216 87%! 0.74 Vietnam, Nam Dinh Summer Jul to Nov 20 fields! 160 visits TP 125-134 IR 100! 30-08 and 05-09-2013 108,733 89%! 0.78 Indonesia, Subang Wet Nov to Apr 20 fields! 160 visits TP 115-135 IR 115! 10 to 13-02-2014 64,533 95%! 0.90 India, Cuddalore Samba Jul to Jan 20 fields! 160 visits TP 130-160 IR 111! 12-02 and 03-03-2014 26,015 92%! 0.85 India, Thanjavur Samba Aug to Dec 20 fields! 162 visits TP & DS 135-160 IR 102
 31-01, 01-02 & 83,871 91%! 0.82 India, Sivaganga Samba Sep to Jan 18 fields! 110 visits TP & DS 100-110 Semi-dry rice 110! 14 and 21-02-2014 41,825 87%! 0.73 Thailand, Muang Yang Wet May to Nov 16 fields! 130 visits DS 150-178 RF 109, 17-10 and 12-12-2013; 12-02, 28-02-2014 91,908 86%! 0.72 Thailand, Suphan Wet Jun to Oct 20 fields! 172 visits DS 92-120 IR 100, 25-09, 25-10, 14-12-2013; 22-01-2014 555,317 87%! 0.74 Philippines , Nueva Ecija Wet Jul to Nov 20 fields! 200 visits TP 114 IR 100,19-09, 03-10 and 04-10-2013 424,801 86%! 0.72 DS – 2! WS - 11 228 fields! 1,922 visits DS – 7! TP - 10 92-178 IR – 12! RF – 3 1,339 points 1.65M ha All sites reached our 85% accuracy threshold, suggesting that the classification method is sufficiently accurate across different management, environments
  11. Nam Dinh in the Red River Delta ! ! Soc

    Trang in the Mekong River Delta When? Start of season Start of Season (SoS) is defined as the date when the lowest dB signal was observed prior to a rapid increase in dB. It is very closely correlated with the date of agronomic flooding prior to transplanting or direct seeding. In most cases, the SoS detection is correct to within one acquisition period (16 days or
  12. Remote sensing information to improve yield estimates in CGSM •

    Crop growth simulation models (CGSM) like Oryza2000 can estimate yield when all necessary parameters and conditions are known.! • This can be achieved in controlled experimental conditions, but not in farmers fields and certainly not over large areas.! • Remote sensing information on the crop growth can capture this spatial variability in the crops response to different environment and management.! • There are well known relationships between SAR backscatter and crop characteristics, like biomass, water content and Leaf Area Index (LAI)! • So far we have focused only on LAI!
  13. Leaf Area Index from SAR is used to calibrate the

    CGSM. Day of Year 180 200 220 240 260 280 LAI 1 2 3 4 5 Yield (t/ha) 1 2 3 4 5 6 7 8 Days after transplanting -20 -10 0 10 20 30 40 50 60 70 80 90 LAI from model LAI from model+RS LAI observations from SAR Yield from CGSM Yield from CGSM+RS Observed yield
  14. How much? Yield estimates Compared against crop cut experiments (CCE),

    the yield accuracy at district level was 91% in Soc Trang and 97% in Nam Dinh. Accuracy = 100 * (1 – Normalised RMSE). We do not report yield at field level, but we can look at local variability in yield. We use LAI up to 50 days after establishment, so this Nam Dinh in the Red River Delta ! ! Soc Trang in the Mekong River Delta
  15. RIICE WebGIS is on The Cloud ArcGIS Server is set

    up on an Amazon Elastic Compute Cloud (EC2) instance. © ESRI
  16. RIICE WebGIS is on The Cloud Running cost is around

    200-300USD a month so far. Elastic Compute Cloud (EC2) instance configuration! • CPU units: 4 ! • CPU Cores: 2! • Memory: 7.5GB! Applications! • OS: MS windows server 2008 R2! • Web service: Internet Information Services (IIS) 7! • ArcGIS server - (includes manager, directory services, ArcCatalog, ArcMap desktop)! • ArcGIS viewer for flex - front end designer! • Beyond compare: - data sync tool! Storage space! • 35 GB Elastic Compute Cloud (EC2) - contains the OS and ArcServer applications! • 100 Elastic Block Store (EBS) - houses all the data
  17. We’ve tried to implement low cost, rapid field monitoring and

    data collection. After three seasons of experience and learning with our partners across six countries we have developed the following:! ! • Protocols for site selection, site characterisation, regular monitoring, yield measures and ground truthing.! • Digital training materials including video demonstrations.! • Data collection with smartphones, with a suite of Apps for GPS, photos, barcode scanner, survey forms and LAI measurement.! • Data is sent, over the mobile network or WiFi network to an aggregator hosted on a cloud platform (Amazon AWS) - immediately available for quality control.! • Yield is still measured by crop cuts, but farmer surveys are being tested. Rapid field data collection protocols
  18. 3 2 1 4 Photos and training materials by IRRI,

    PhilRice, DA regional offices, sarmap and University of Milan
  19. Pre- season Land preparation – crop establishment Vegetative Reproductive Ripening

    -Harvesting Component A Metadata (pre season)! ! 1_Metadata Metadata (2 2_Metadata Metadata (last)! 3_Metadata Monitoring! 4_Monitoring ! LAI! (tillering) LAI! (pre-flowering) ! Damage Assessment (only when needed)! 6_Damage Rice/Non-rice Area Validation! 5_RNR Component B Crop health (booting) Crop health (pre harvest) Crop-cut Sampling PocketLAI is developed by the University of Milan and customised for IRRI & partners 2nd monitoring visit activity Scan Barcode! Get GPS coordinates (4 corners of the site)! fill in the monitoring form ! 4_Monitoring! (Land prep, Soil moisture, Crop Growth Stage)! fill in the metadata form ! 2_Metadata! (Field Survey)! ! during tillering stage
  20. There is often tension between public and private partners! •The

    pace of product development is different! •The risk management style is different! •Perception that PPP becomes PPP-PPP: public partner pays - private partner profits! •Distrust of private sector from external parties! ! Need for clear IPR agreements from the start! Need for joint investment and risk taking! Need for clear role definitions and demonstration of mutual benefits! Need for long term commitment from both sides! In other words, a real partnership Public Private Partnership projects
  21. In the Philippines we are linking RS- based information and

    crop health surveys to understand the relationship between different rice production systems and their dominant yield reducing factors. We already have some successes This information will be linked to site-specific rice crop advisories and recommendation tools that are already in the hands of extension services. Together these tools provide farmers with pre-season and mid-season information to improve the health of their crop and incrementally improve productivity towards a sustainable and achievable target (yield gain, profit gain or both). We are developing a national-scale rice crop information system with a big investment from the Department of Agriculture.
  22. Questions?! ! [email protected] / www.irri.org! ! Acknowledgements! RIICE and PRiSM

    partners including PhilRice, sarmap, University of Milan, Can Tho University, IMHEN, DA- Philippines, DA-BAR
  23. 1 rice exclusion! mean(σo (t)) < a or mean(σo (t))

    > b or span(σo (t)) > c ! or σo (t) < a for t∈[t 2- t 1 ]! 3 rice or late rice?! max[σo (SoS), σo (SoS+t minlength )] > e! and! max[σo (SoS), σo (SoS+t minlength )] - σo (SoS) > f no, t=0 2 agronomic flooding?! σo (t) < d yes, SoS=t t=t+1 no 4 late rice?! (day (t last ) - day(SoS)) < t minlength yes yes no yes t > t last 2b early rice?! span(σo (t)) > f and! deriv((max σo (t) - σo (t last )) < 0 a! =! lowest mean! b! =! highest mean! c! =! maximum variation! d! =! maximum value at SoS! e! =! minimum value at maximum peak! Multi-temporal σo images Not rice Rice 5 unexpected drop in σo?! min[σo (SoS+1) , σo (SoS +t maxlength )] > a Late rice Early rice t ! = time! t 2 -t 1! = maximum time under water! t minlength != number of days between SoS and peak σo ! t maxlength ! = number of days between σo minima! yes yes no no no no yes This is a new approach to detecting rice with SAR time series data using Temporal Feature Descriptors. ! Nelson et al. (forthcoming) Towards An Operational SAR-Based Rice Monitoring System in Asia: Examples from 13 Demonstration Sites across Asia in the RIICE Project. Remote Sensing. Thresholds derived from SAR signatures at monitoring sites